Energy overview
This report presents comprehensive information on and analysis of New Zealand’s energy supply and demand for the 2022 calendar year.
On this page
Overview at a glance
National self-sufficiency

Share of electricity generated from renewable sources
Share of primary energy supply from renewable sources
Share of final energy consumption from renewable sources
National energy consumption
National average energy intensity
High hydro inflows increased our renewable electricity generation
The share of renewable electricity generation in 2022 was one of the highest in recent decades, as autumn and winter rain ensured hydro inflows remained high.
Renewable sources generated 95% of electricity in the fourth quarter of 2022 — the highest quarterly share from renewables since 1980. Overall, 87% of electricity generated in 2022 came from renewable sources. Hydroelectric generation accounted for 60% of all electricity for 2022 (up 4.4 percentage points on 2021), while coal-fired electricity accounted for only 2.9% (down 4.1 percentage points on 2021). As a result, the amount of coal imported for the year was 61% lower than in 2021, as electricity generation is one of the main uses of imported coal.
Closing Marsden Point Oil Refinery changed the mix of imported oil
The Marsden Point Oil Refinery stopped refining operations on 31 March 2022, transitioning to a dedicated fuel import terminal. As part of this change, Refining New Zealand rebranded as Channel Infrastructure.
With the closure of refining operations in New Zealand, the amount of imported crude oil decreased to zero from April 2022. Crude oil is refined into oil products such as petrol, diesel and aviation fuel. This is the first time that New Zealand has not imported any crude oil for more than a quarter since statistical records began in 1974. As a result, the country switched to importing mainly refined oil products, which were previously produced by the refinery. This saw the amount of imported refined oil products more than double from 2021 levels.
While closing the refinery changed the type of oil that New Zealand imports, it did not significantly change the amount of oil imported. New Zealand has always relied on imported oil, even if the refining was done in New Zealand, as the Marsden Point Oil Refinery was designed to run on heavier, foreign crude oil.
New Zealand’s self-sufficiency increased from 2021, but continues to trend downwards
New Zealand relies on a combination of domestically produced and imported fuels to meet its energy needs. We can measure this reliance using a self-sufficiency indicator, which shows how well we can meet our own energy supply needs through domestic production.
For more information about New Zealand’s energy indicators, see:
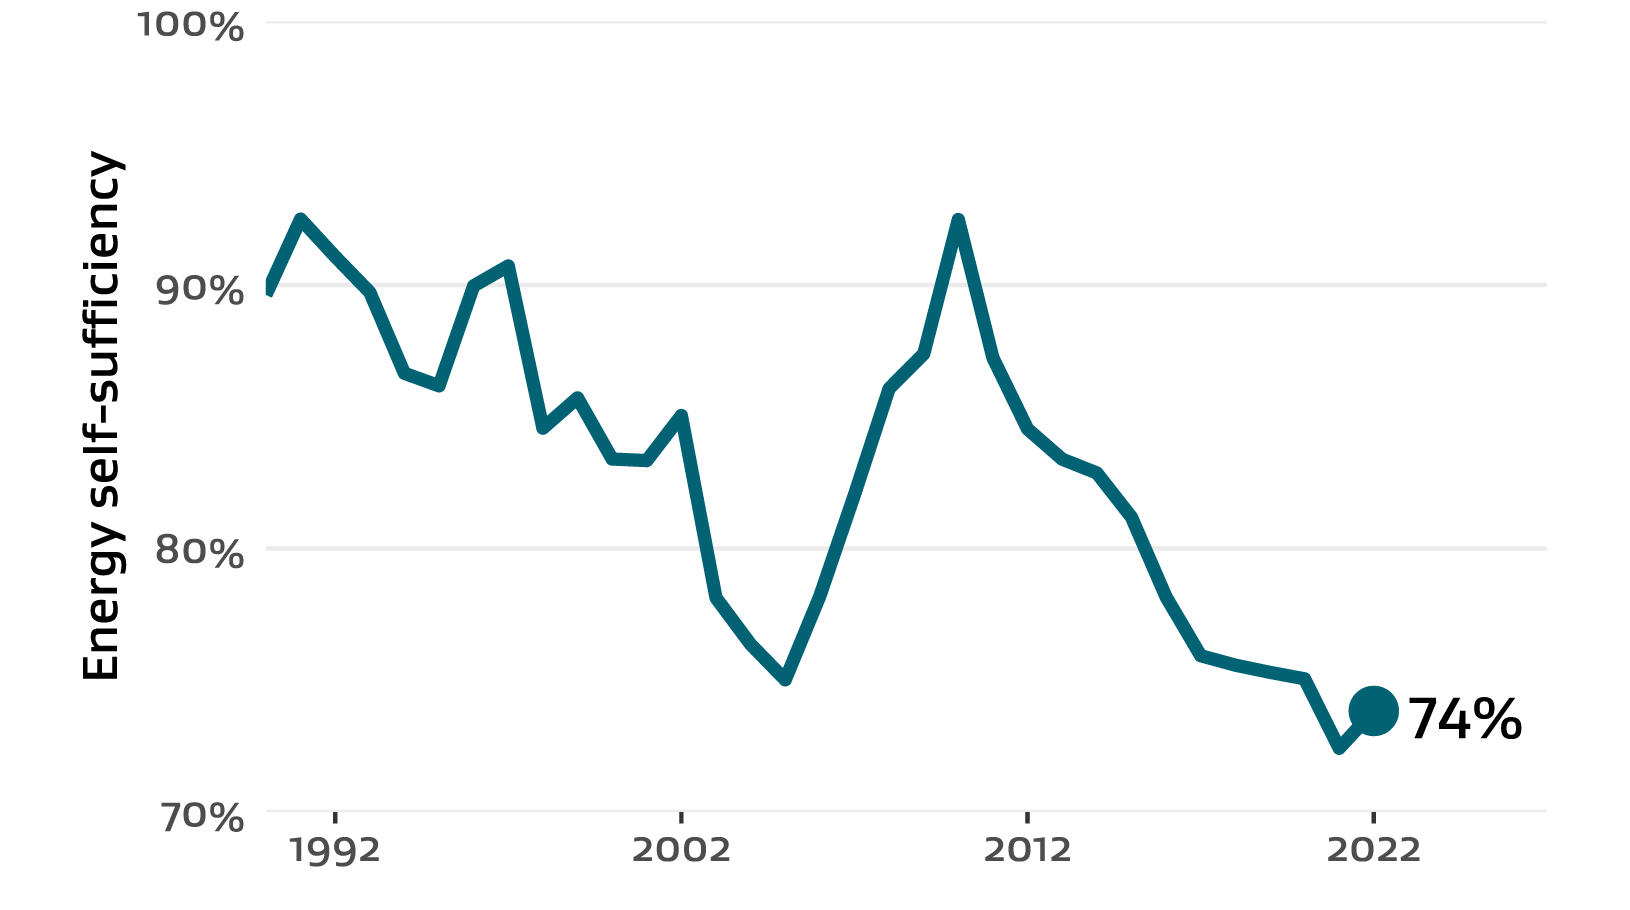
New Zealand’s energy self‑sufficiency for 2022 was 74% (Figure A.1). This means that New Zealand was able to meet 74% of its energy supply requirements for the year through domestic production. This continues a trend of decreasing energy self-sufficiency over time as domestic production is decreasing while demand increases, leading to a steady increase in the total primary supply required.
Figure A.1 New Zealand’s energy self-sufficiency, from 1990 to 2022
Text description of figure A.1
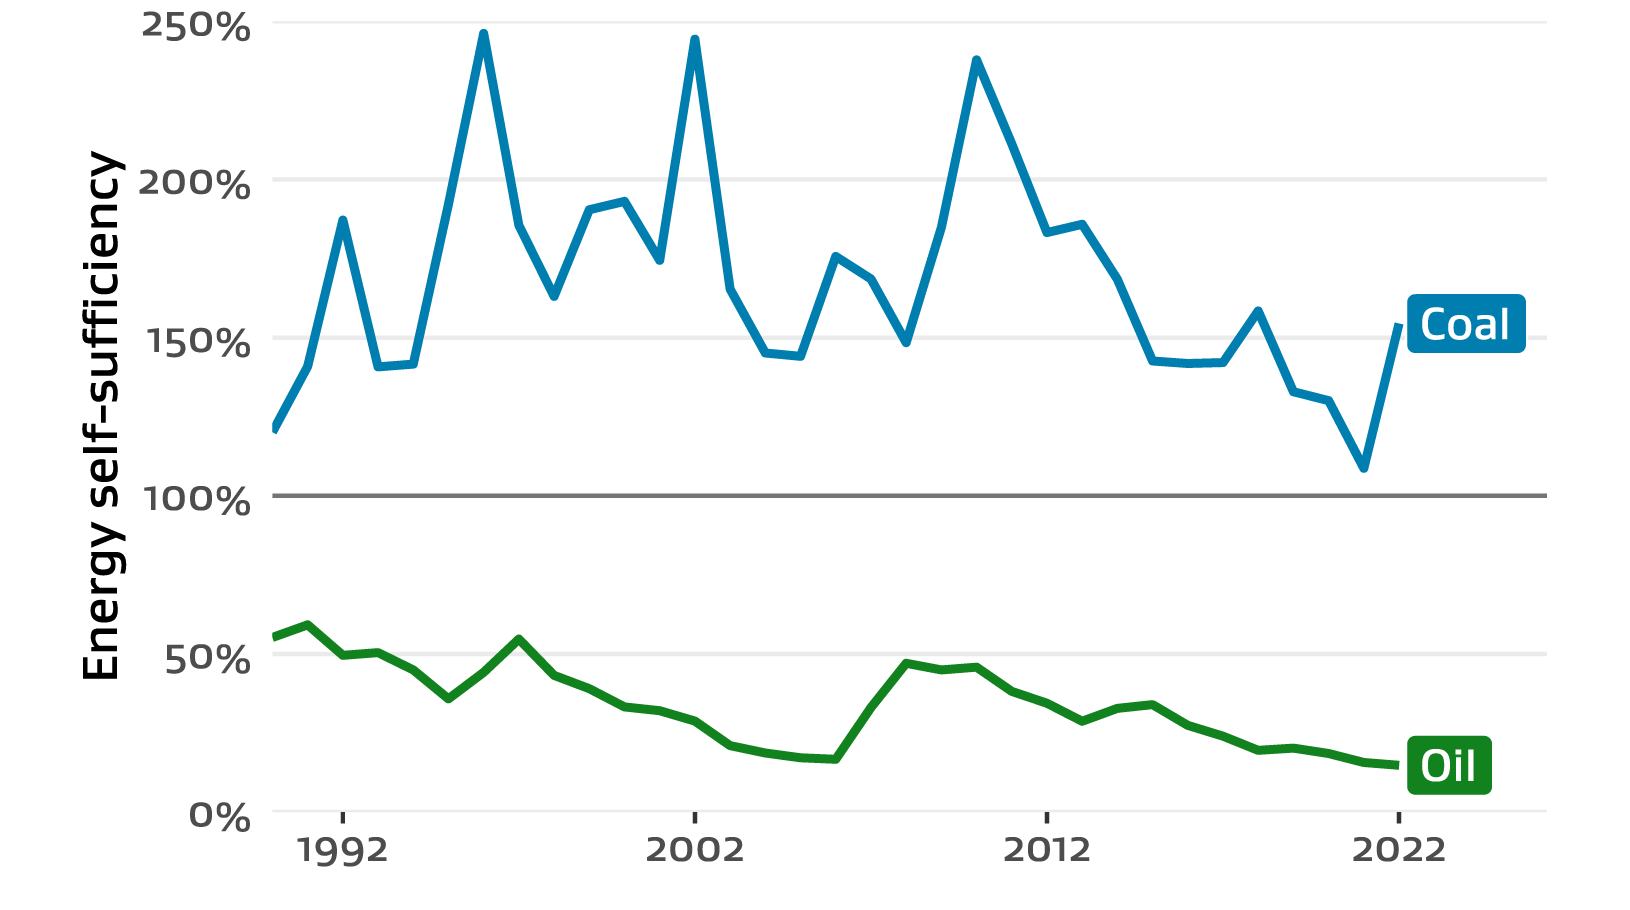
The key contributors to New Zealand’s energy self-sufficiency are coal and oil — the 2 fuels which New Zealand trades internationally. New Zealand has historically been a net exporter of coal (that is, we produce more than we need), and a net importer of oil. This means that our coal self-sufficiency tends to be greater than 100%, while our oil self-sufficiency tends to be less than 100%. Our coal self-sufficiency increased to 154% in 2022 due to a decrease in the amount imported, but oil self-sufficiency decreased to 12%, a record low (Figure A.2).
Figure A.2 New Zealand’s energy self-sufficiency for coal and oil, from 1990 to 2022
Text description of figure A.2
Our energy consumption remains lower than levels measured before COVID-19
Total energy consumption for 2022 was 543 petajoules (PJ), about the same as observed for 2020 and 2021. Historically, energy consumption has gradually increased year-on-year, peaking at 581 PJ in 2019. However, restrictions on activity and movement as part of the response to the coronavirus (COVID-19) pandemic resulted in a dip in energy consumption in 2020. We are yet to see energy consumption return to the levels measured before COVID-19.
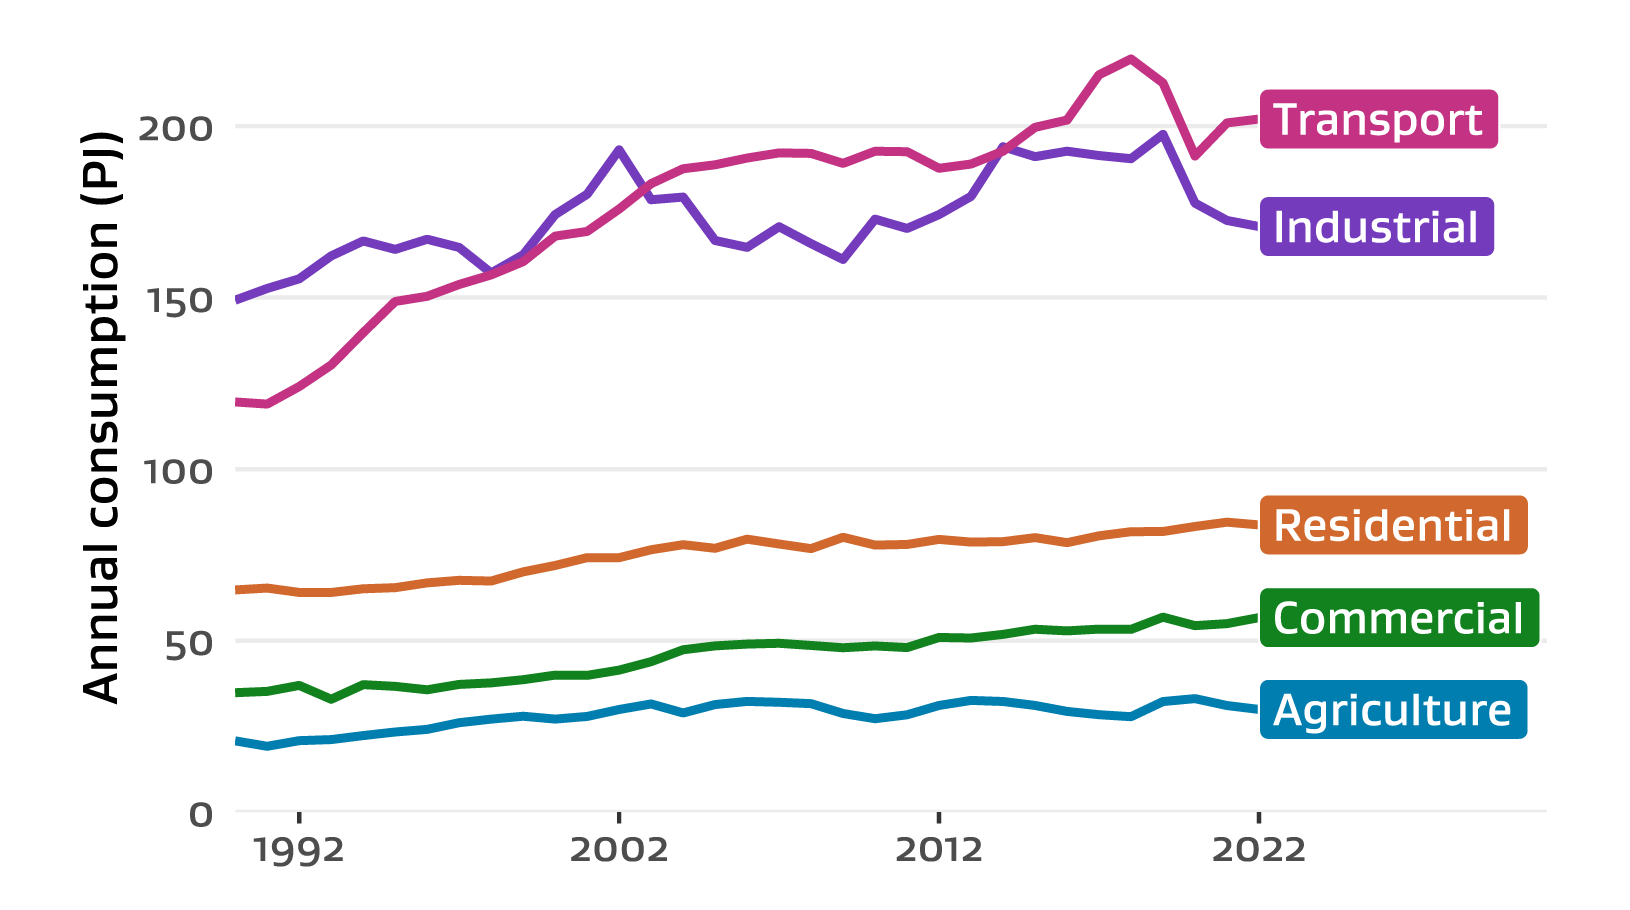
Consumption by sector has changed slightly since last year (Figure A.3). Energy use in the agriculture, forestry and fishing sector fell by 8.3% compared to 2021, driven mainly by a decrease in the use of electricity and natural gas. In contrast, energy consumption in the commercial sector increased by 3.7%, driven by increasing petrol and diesel use.
While overall energy consumption in the industrial sector has stayed relatively constant, the use of natural gas dropped by 9.0% compared to 2021 levels. This can be attributed to the following sectors:
- wood
- pulp and paper
- food processing
- chemical product.
This resulted in a drop in overall energy consumption in the food processing and chemical product sectors. In contrast, overall consumption in the wood, pulp and paper sector increased, with solid biofuel use increasing by 17% to cover the reduction in natural gas use.
Energy consumed from renewable sources accounted for 30% of the total final consumption in 2022, the highest value ever recorded. The share of renewable energy in the total final consumption has steadily increased across most sectors, helped by the large share of renewable electricity generation for the year. The exceptions are the agriculture and transport sectors — 2 sectors which rely heavily on oil for their energy needs.
Figure A.3 New Zealand’s energy consumption by sector, from 1990 to 2022
Text description of figure A.3
New Zealand’s energy intensity continues to improve
Energy intensity gives an indication of the relationship between energy use and economic growth. It is calculated as energy use divided by gross domestic product (GDP) and tells us the amount of energy required to produce each dollar of GDP. A fall in the indicator — where less energy is required to produce each dollar of GDP — is viewed as an improvement.
If energy intensity decreases, it is usually for one of 2 reasons.
- Energy users within a sector are finding ways to use energy more efficiently, increasing the energy efficiency of the sector.
- Activity shifts from more energy-intensive sectors to less energy-intensive sectors, resulting in a lower overall energy intensity.
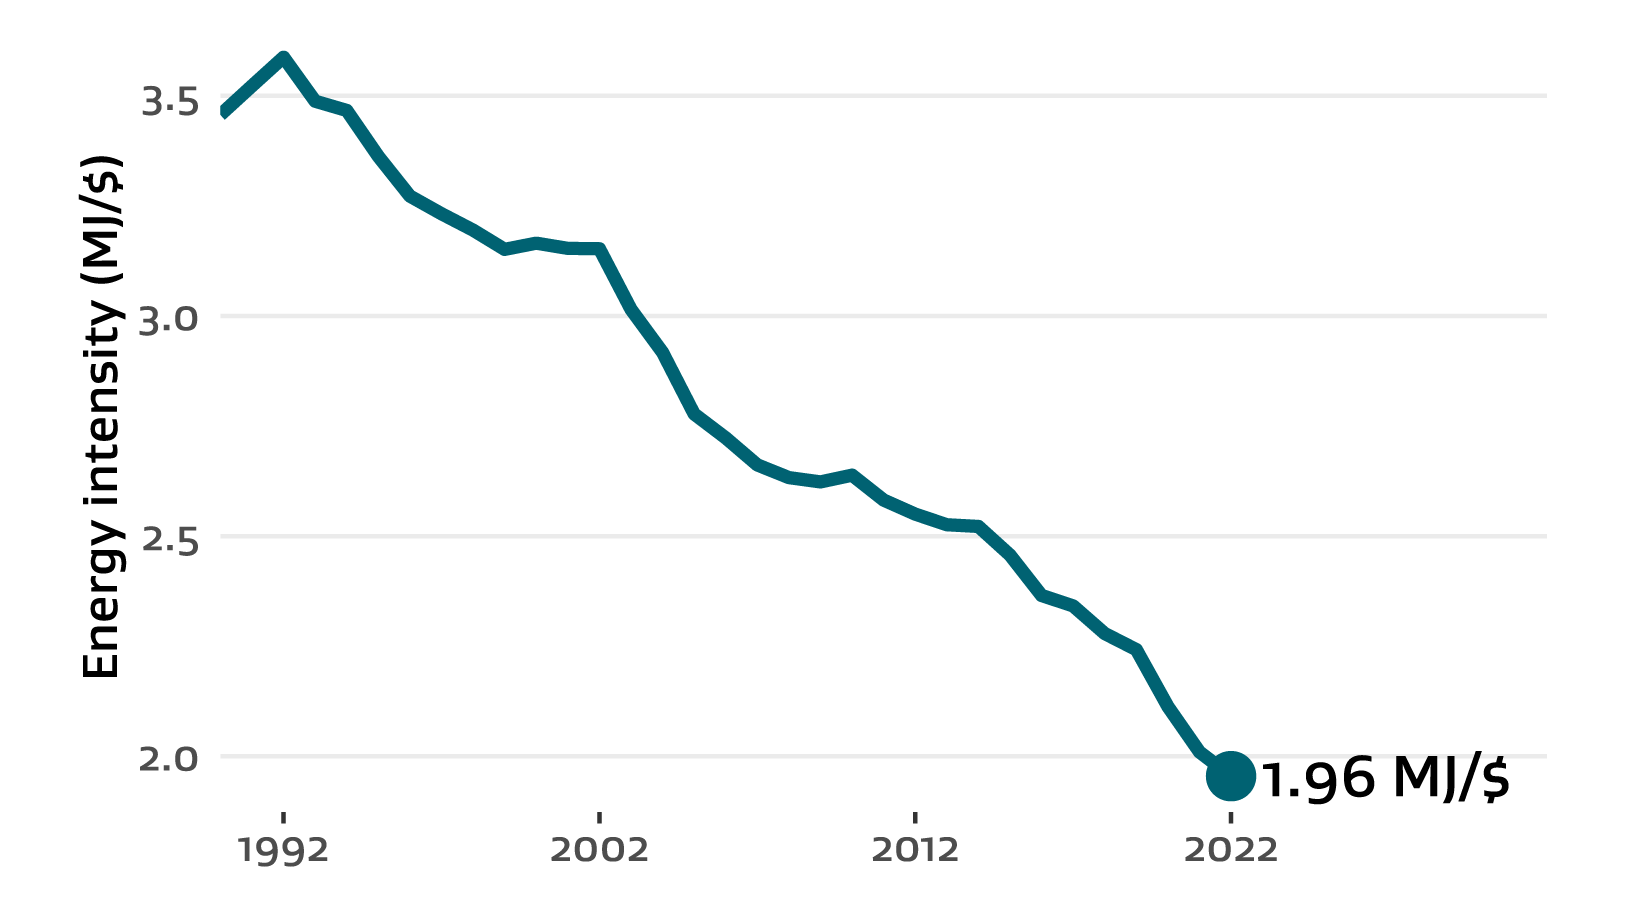
National energy intensity dropped to a record low of 1.96 megajoules per dollar (MJ/$) this year, a 2.7% decrease on 2021 values (Figure A.4). Energy intensity has improved by an average of 1.7% every year between 1990 and 2022. This year’s decrease has been driven by changes in energy use in key sectors. Energy consumption decreased in the agriculture sector (which is relatively energy-intensive), while consumption increased in the commercial sector (which is relatively less energy-intensive).
Figure A.4 New Zealand’s national energy intensity, from 1990 to 2022
Text description of figure A.4