Electricity
New Zealand generates and consumes around 43,500 gigawatt hours (GWh) of electricity a year. Most of our electricity comes from renewable sources such as hydroelectricity, with the overall share of renewable electricity generation exceeding 80% in most years.
On this page
In 2022, the total electricity generated included contributions from the following sources.
- Hydroelectric — 60%
- Geothermal — 18%
- Natural gas — 9.9%
- Wind — 6.5%
- Coal — 2.9%
New Zealand’s industrial sector consumed around 34% of all electricity consumed in the country in 2022. This was mainly led by the metal manufacturing and food processing sectors. The residential sector consumed a similar amount of electricity at 34%.
Electricity at a glance
Share of electricity generated from renewable sources
Total electricity generation
Total electricity consumption
Number of Installation Control Points (ICP)
Total generation capacity
- The wettest and warmest winter on record led to above average hydro lake inflows and snow storage in the second half of the year
- Industrial electricity demand dropped 1.3%, and residential electricity demand dropped 1.9%
- The number of EVs in New Zealand doubled over 18 months
- 2022 saw record electricity generation from both wind and geothermal.
The warmest and wettest winter on record led to a high share of renewable electricity generation
New Zealand generated 43,476 GWh in 2022, a 0.47% increase from 2021. New Zealand generated 0.77% less electricity in 2022, compared to 2019 (before the COVID-19 pandemic). The annual electricity generation from hydro increased by 8.4% in 2022 compared to 2021, while generation from non-renewable sources decreased by 28%.
In 2022 New Zealand again experienced its warmest year on record. It was also New Zealand’s eighth wettest year on record. The primary driver was La Niña weather conditions, marked by ocean temperatures in the Pacific that were cooler than average.
The 2022 winter was the wettest and warmest on record. There was heavy rainfall in parts of the country, notably in August when there was widespread flooding across the top of the South Island. The wet weather also helped hydro lake inflows and snow storage surpass historical averages in the second half of the year.
The share of renewable generation rose to a record high of 95% in the last 3 months of 2022 – this is the highest quarterly share of renewable generation in 43 years. Overall in 2022, renewable sources accounted for 87% of electricity generation (Figure C.1).
Figure C.1 Share of renewable electricity generation, from 1990 to 2022
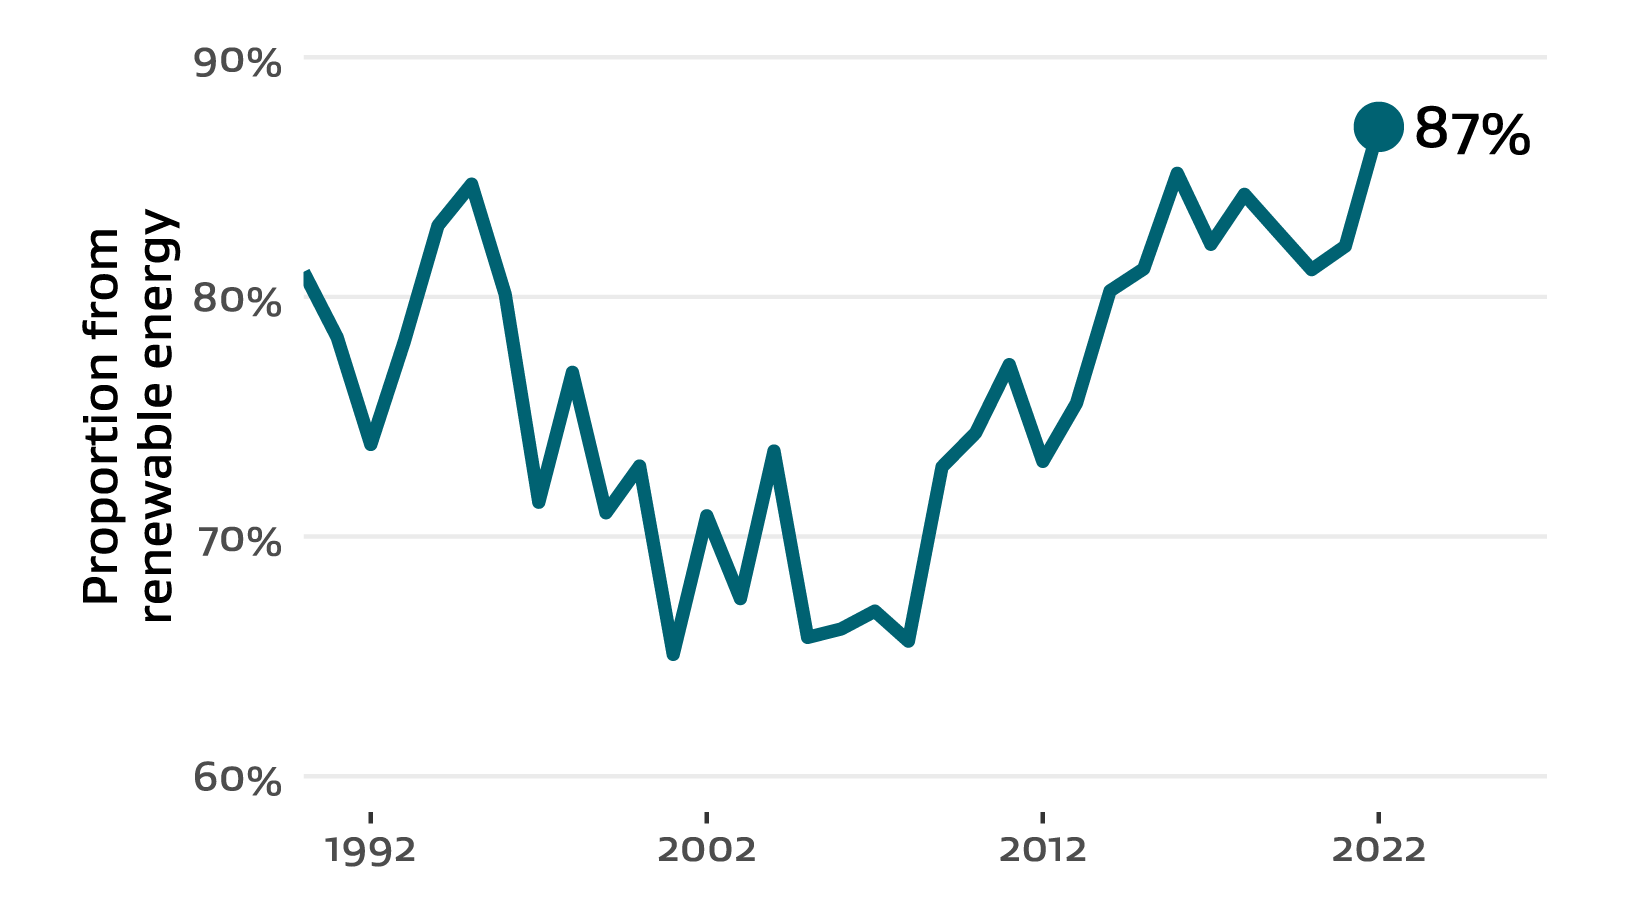
Text description of figure C.1
A record amount of electricity was generated from wind and geothermal in 2022
Energy company, Mercury commissioned the Waipipi and Turitea Wind Farms in 2021, adding a capacity of 223 megawatts (MW). This contributed to the highest annual wind generation on record. Electricity generated from wind increased by 8.4% in 2022 compared to 2021.
Geothermal electricity generation in New Zealand operates as baseload generation. Baseload generation refers to power plants that do not change their electricity generation output quickly. These plants are less flexible with meeting electricity demand and take a long time to start up and shut down. Geothermal electricity generation is not affected by weather conditions that can affect hydro, wind, and solar generation. In 2022, electricity generation from geothermal sources increased by 0.81%, reaching a record high of 8,033 GWh. This is because every plant, including the recently built Ngāwhā OEC4, was operating at capacity.
More wind farms and windy conditions increase wind generation
New Zealand is on the belt of the Roaring Forties. This means that we typically experience higher wind speeds than other parts of the world.
The Southern Annular Mode (SAM) is a proxy for measuring the strength and position of the belt of westerly winds that encircle the Southern Ocean and bring storms to New Zealand. For 76% of the time in 2022 the SAM was positive, the highest annual percentage since 1979. A positive SAM phase is typically associated with an increase in windiness and storm activity over the Southern Ocean.
For more information about the SAM and climate in 2022:
Annual climate summary 2022(external link) — NIWA
Additional renewable capacity is entering the market, while thermal plants are retired
Developers made additional investments into renewable electricity generation in 2022. In addition to Mercury’s commissioning of the Waipipi and Turitea Wind Farms in 2021, more wind, solar, and geothermal capacity will be available in the future.
Contact Energy announced that it would close its Te Rapa cogeneration natural gas plant, which has a capacity of 44 MW, at the end of June 2023. Contact Energy also announced that Taranaki Combined Cycle (TCC) natural gas plant, with a capacity of 380 MW, would close in September 2024. The TCC natural gas plant is typically used as a hydro-firming plant, which means that it generally only runs when demand is high and generation from hydroelectric plants is low.
Contact Energy retired its combined cycle plant at Ōtāhuhu in 2015, while Mercury also retired a combined cycle plant in Southdown in late 2015. After the decommissioning of TCC, Huntly Unit 5 will be the only combined cycle natural gas plant remaining in the country.
Table C.1 Consented renewable electricity plants
| Plant name | Owner | Capacity (MW) | Expected commissioning |
|---|---|---|---|
| Turitea Stage 2 Wind Farm | Mercury | 103 | Mid-2023 |
| Kaiwera Downs Stage 2 Wind Farm | Mercury | 240 | End of 2023 |
| Tauhara Geothermal Plant | Contact Energy | 168 | End of 2023 |
| Kaitaia Solar Farm | Lodestone Energy | End of 2023 | |
| Harapaki Wind Farm | Mercury | 176 | Mid-2024 |
| Ruakākā Solar Farm | Meridian | 75 | End of 2024 |
| Mt Cass Wind Farm | MainPower | 95 | 2024-2025 |
| Mahinerangi Stage 2 Wind Farm | Mercury | 164 | - |
| Puketoi Wind Farm | Mercury | 230 | - |
| Kaiwaikawe Wind Farm | Mercury | 73 | - |
| Ngāwhā OEC5 Geothermal Expansion | Top Energy | 32 | - |
| Te Huka Unit 3 Geothermal Plant | Contact Energy | 51 | - |
Favourable hydro conditions decreased our reliance on non-renewable sources for electricity generation
Warm weather accompanied by several storms throughout the year boosted hydro lake inflows. This decreased the country’s reliance on coal for electricity generation.
Following early predictions that the 2022 winter would be dry, Genesis Energy increased the coal stockpile at their Huntly Power Station. The coal stockpile at the Huntly Power Station was 835 kilotonnes (kt) at the end of 2021. This was the highest level since 2014.
Electricity generated from coal fell to 2.9% of total generation in 2022, a decrease from 7.0% of total electricity generation in 2021. Figure C.2 shows a drop in the total share of coal generation in 2022. Electricity generated from natural gas also fell in 2022 to 9.9% of total electricity generation, down by 0.8 percentage points compared to 2021.
Figure C.2 Share of total electricity generation by source, from 1990 to 2022
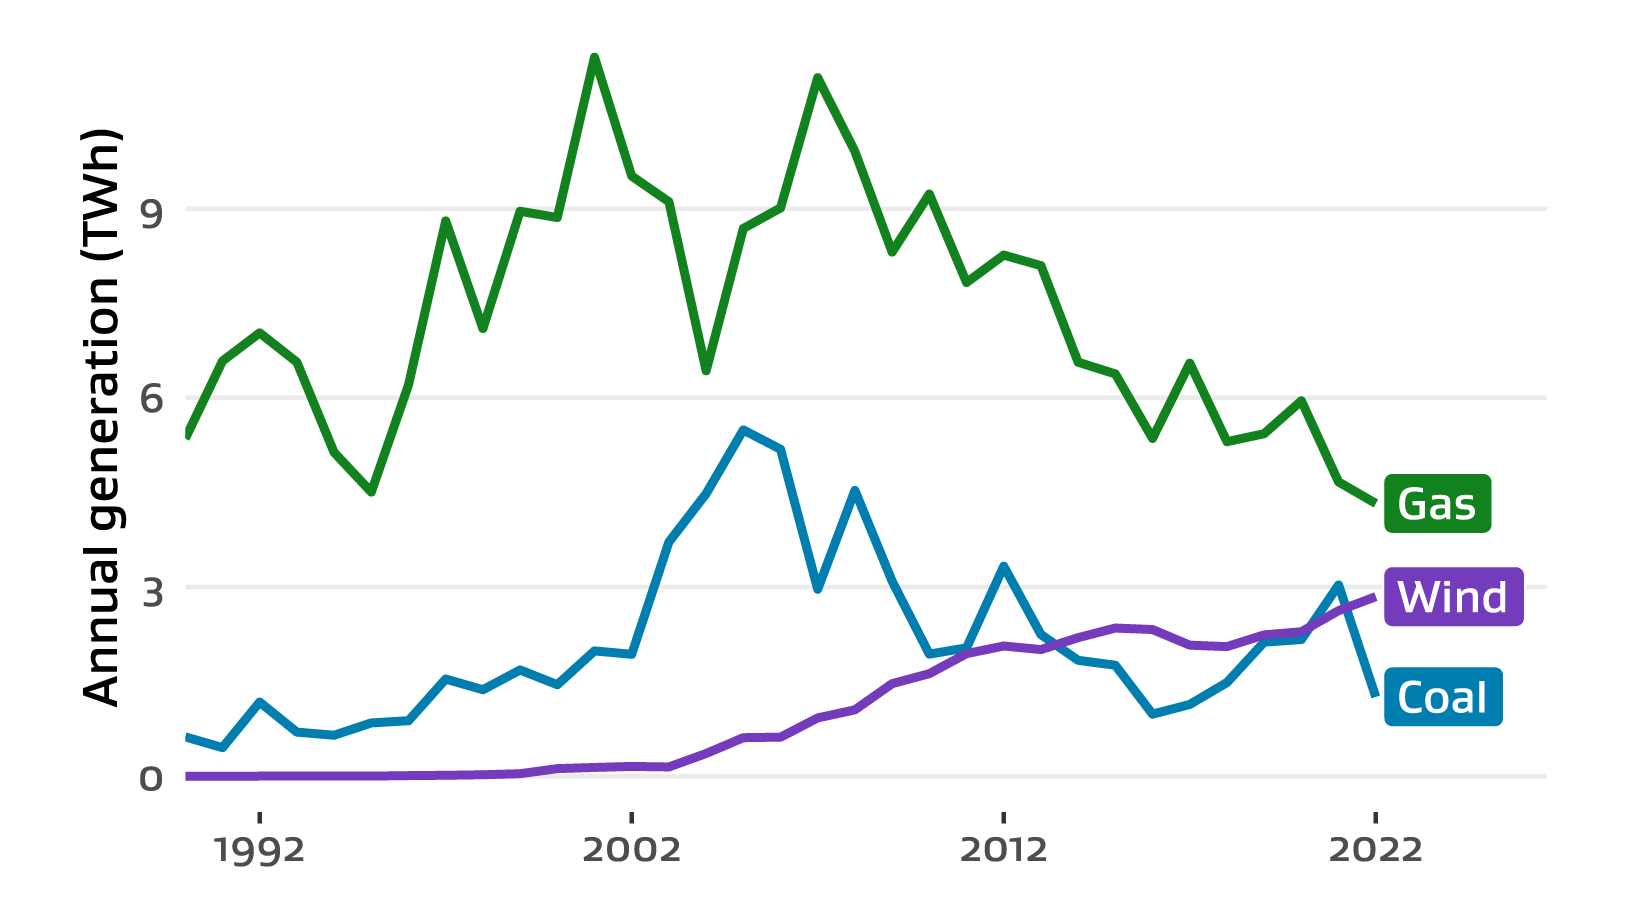
Text description of figure C.2
Electricity demand from residential and industrial sectors fell
Compared to 2021, electricity consumption slightly decreased by 1.3% in 2022. This was driven by a decrease in demand from residential, industrial, and agriculture sectors. Demand from the food processing sector in 2022 increased by 5.7%, however this increase was not enough to offset the decreases in demand from the chemicals and wood, pulp, and paper sectors.
Notable winter-like cold snaps carried on into spring, particularly during the early parts of both September and October. However, electricity demand from the residential sector decreased by 2.8% in the third quarter of the year compared to the same period in 2021 (Figure C.3).
Compared to 2019, electricity demand dropped by 3.2% in 2022.
Figure C.3 Electricity consumption in New Zealand by sector, from 1990 to 2022
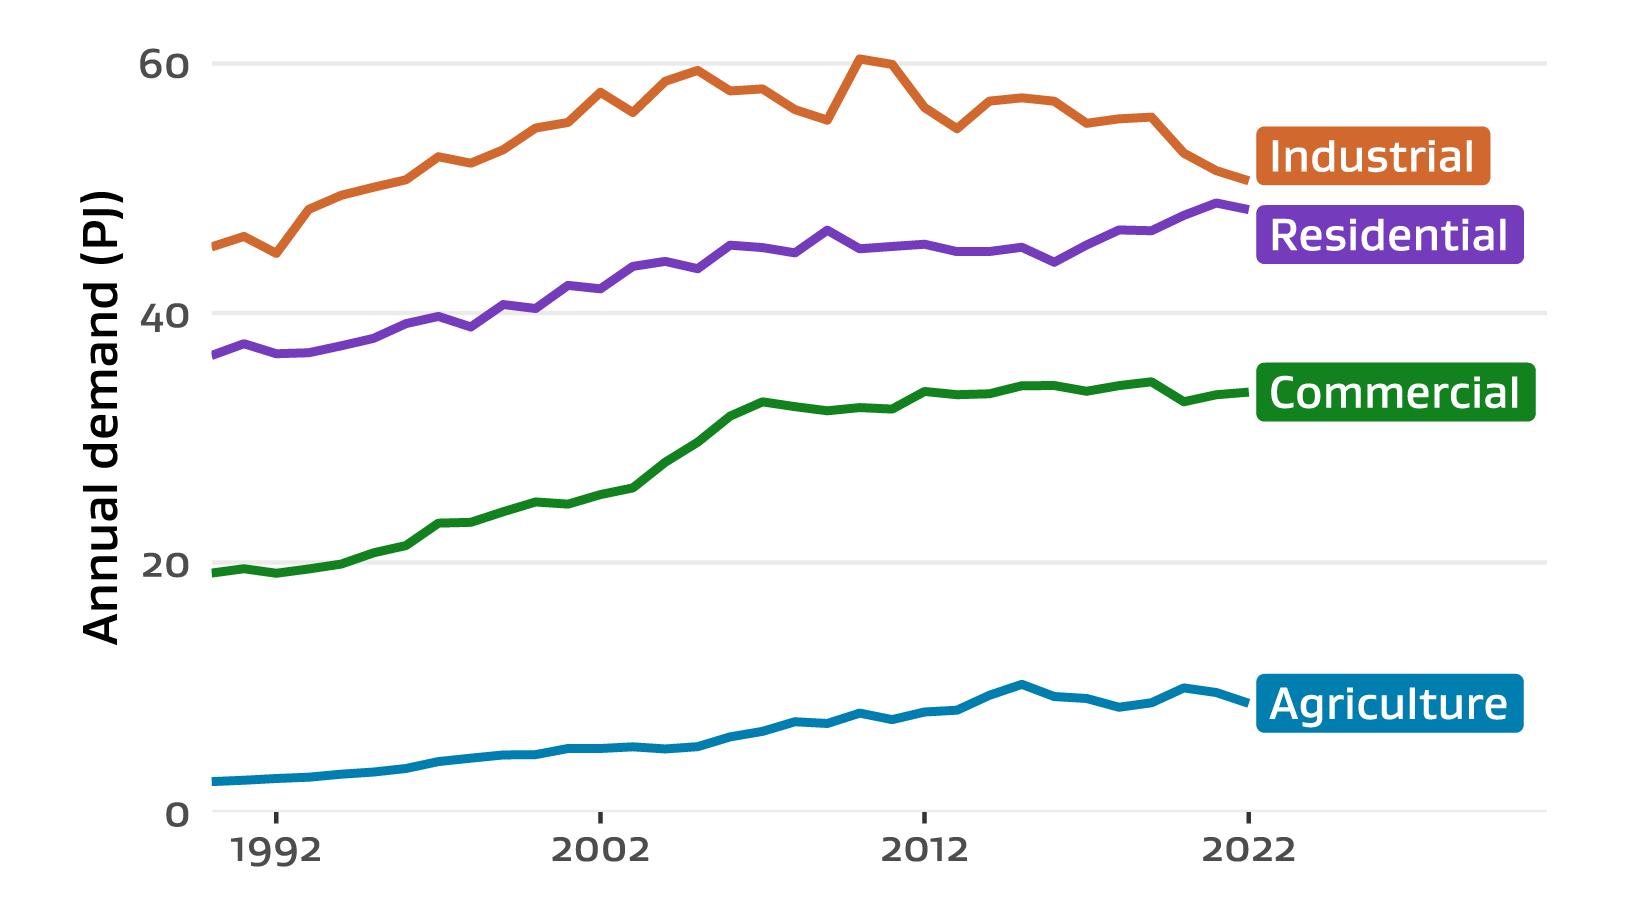
Text description of figure C.3
Charging electric vehicles will have an impact on the demand from the residential sector
Battery electric vehicles (BEVs) made up about 1.0% of our total fleet at the end of 2022, doubling since mid-2021 (Figure C.4). In 2022, 20,896 BEVs were registered for the first time, twice as many as in 2021. The Government introduced the Clean Car Discount in 2021 to make low emission vehicles more affordable.
Figure C.4 Registrations of electric vehicles in New Zealand, from 2014 to 2022
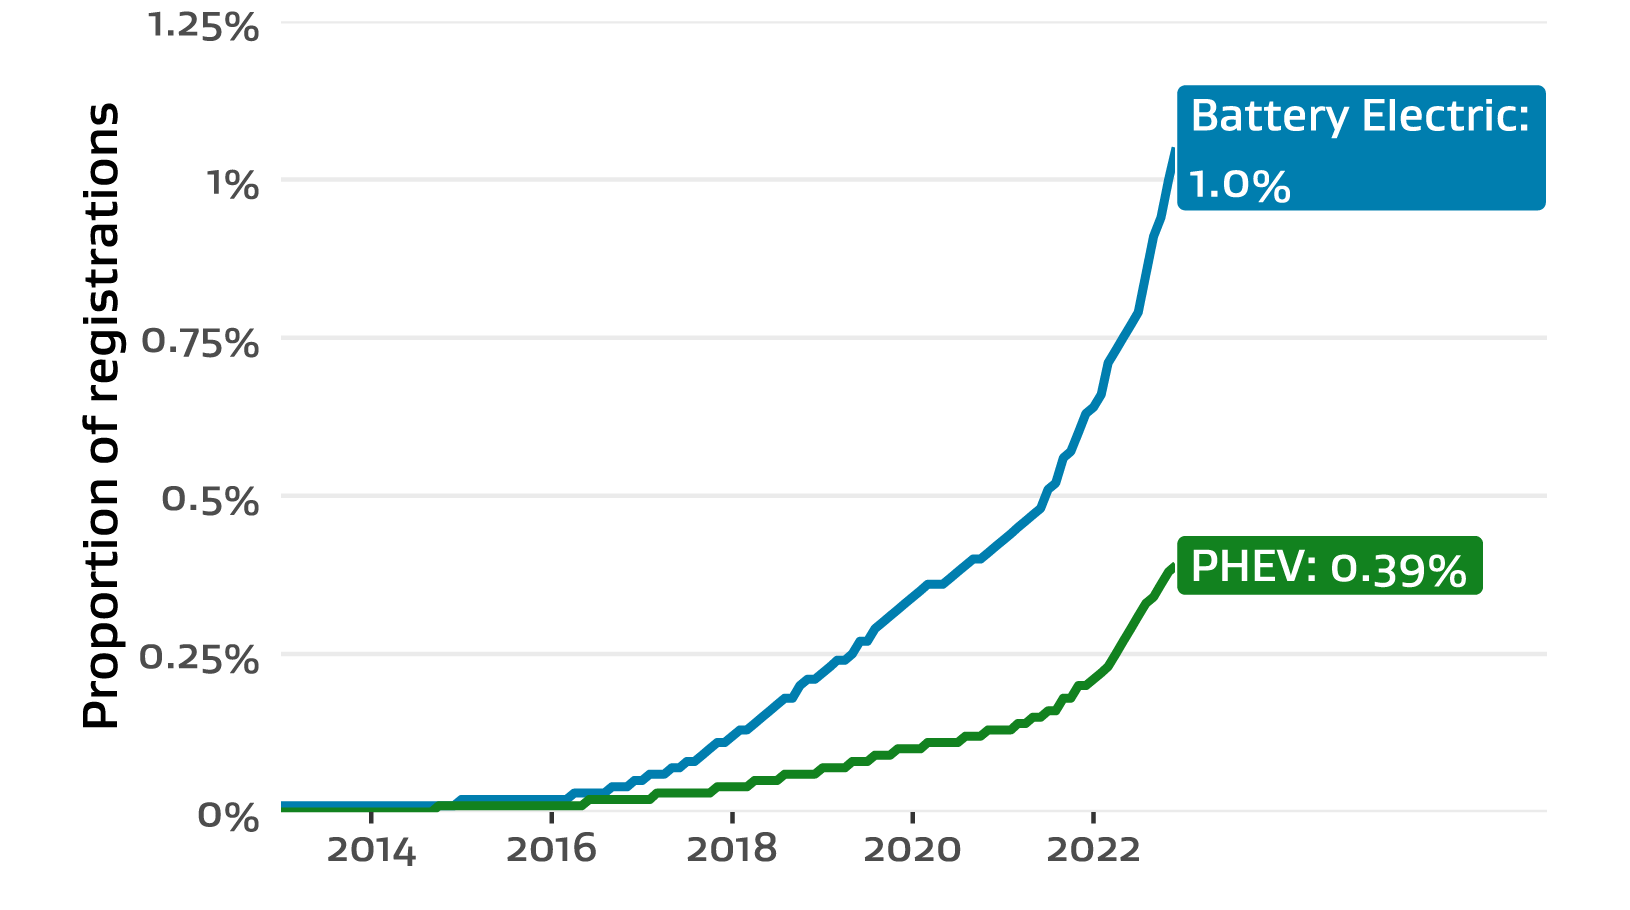
Text description of figure C.4
A high rate of EV uptake will help us increase the share of renewable transport energy consumption. EV owners typically charge their vehicles overnight when demand is low, making use of cheaper rates offered by many retailers for off-peak electricity consumption. EV charging can also be automated through technology like smart EV chargers. In addition, retailers can provide incentives that reward customers for allowing more flexibility over when EVs are charging. This enables increased charging when there is extra renewable generation, or reduces demand to avoid congestion of the local network.
The projected increase in demand of electricity for charging EVs will require more investment in New Zealand’s electricity infrastructure for the generation, transmission, and distribution of electricity. However, the amount of investment in generation capacity and transmission could be moderated using smart EV chargers. Smart charging and overnight charging of EVs outside of peak times would not only reduce the cost for customers taking advantage of off-peak rates, but also decrease the burden on our electricity infrastructure.
Electricity used for irrigation decreased because of higher soil moisture levels than average
Irrigation is a significant user of electricity, and the national irrigation load can make up 2% to 3% of national demand during summer. As the weather warms between October and April each year in New Zealand, national household electricity demand decreases overall. However, in some agricultural regions the load increases during this time, as farmers compensate for lower rainfall with increased irrigation.
The La Niña phenomenon in 2022 brought higher soil moisture levels than usual across the country, particularly in key irrigation regions. This contributed to the decrease in electricity consumption from the agriculture, forestry and fishing sectors which fell by 6.8%.
As a large portion of the country's irrigation load comes from the Canterbury region, Ashburton can be used as an indicator of the national irrigation load, see Figure C.5.
Figure C.5 Ashburton Grid Exit Point (GXP) demand, from 2003 to 2022
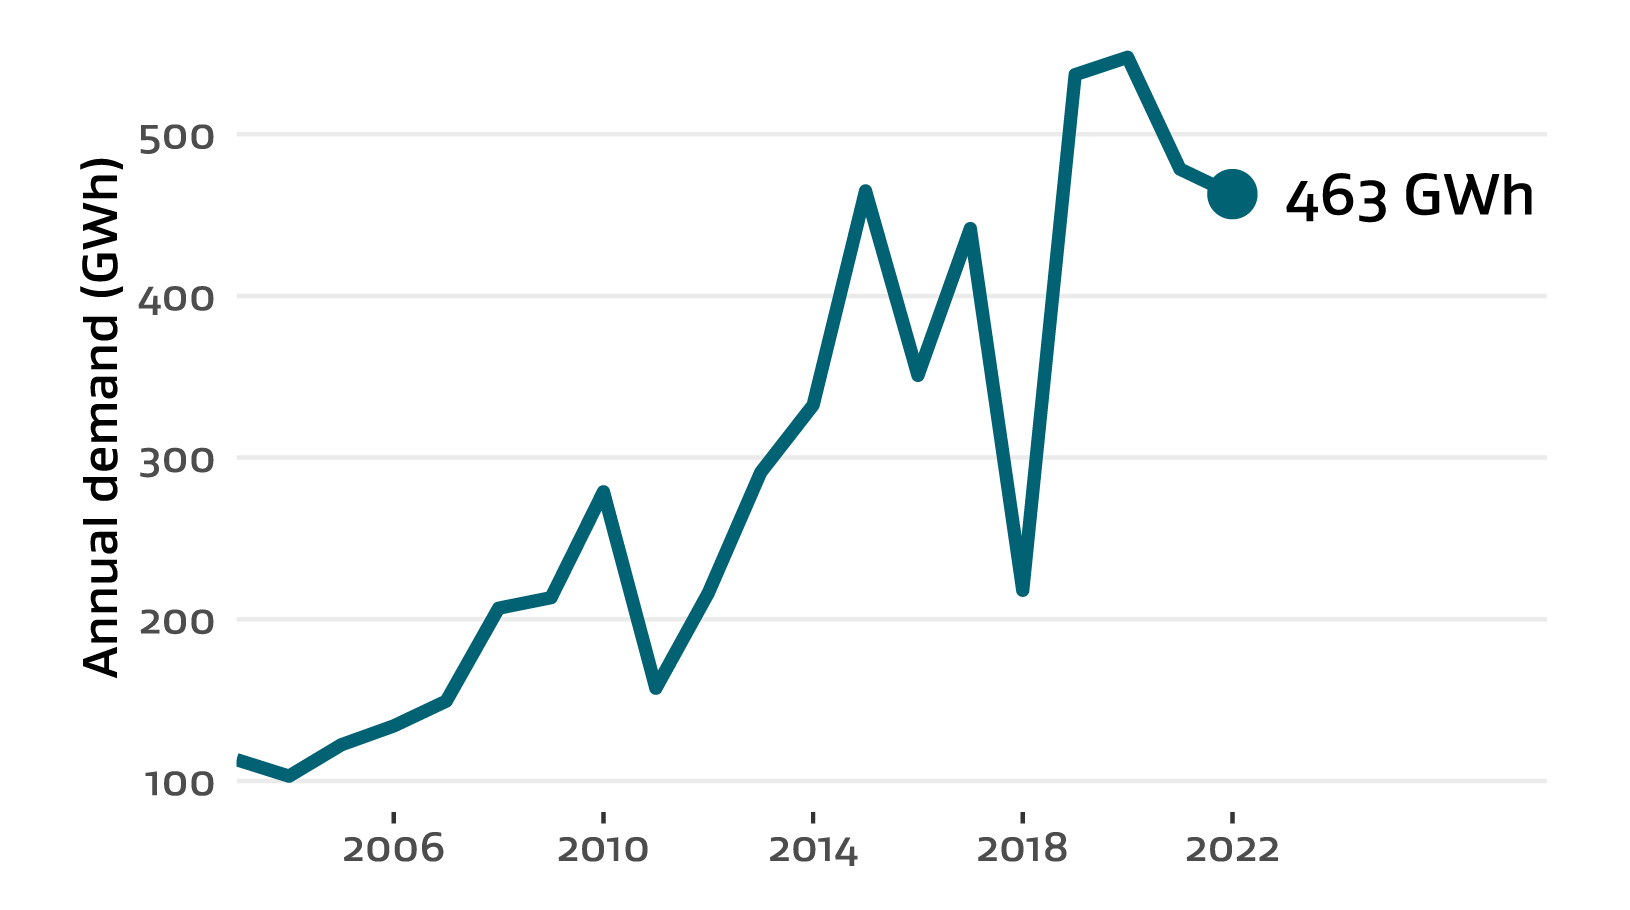
Grid Exit Points (GXP) are the points where electricity leaves the national grid operated by Transpower and enters the local distribution network.
Text description of figure C.5
The decreasing demand from the industrial sector was largely driven by wood and chemical processing
In 2022, the industrial sector’s demand for electricity was 8.4% lower than in 2019, and 1.3% lower than in 2021. Electricity consumption fell by 29% in the chemicals sectors and 12% in the wood, pulp, and paper sector.
We can expect an increase in electricity demand from the commercial and industrial sectors in the future. The Energy Efficiency and Conservation Authority (EECA) announced its list of approved projects from round 3 of the Government Investment in Decarbonising Industry (GIDI) fund in April 2022. The GIDI fund is a multi-year programme to support businesses in the industrial and commercial sectors as they switch from fossil fuels to renewable energy sources. The renewables section has more information about the GIDI fund.
The Government Investment in Decarbonising Industry (GIDI) fund
Box C.1 Electricity price regulations are being phased out
The Low Fixed Charge Tariff regulations are currently being phased out over a 5 year period that began on 1 April 2022. Under these regulations, the fixed charge for households was capped for low users. The fixed charge is on top of paying variable charges relating to the actual amount of electricity they use.
For more information about the phase-out of Low Fixed Charge Tariff regulations:
Phasing out low fixed chare tariff regulations
This cap is going to be gradually increased over 5 years before it is removed.
What were the regulations and why are they being removed?
These Low Fixed Charge Tariff regulations were introduced in 2004 to provide electricity plans with a discounted fixed charge aimed to reduce power bills for low-use, low-income households. However, as the regulations were poorly targeted, they have only helped some low-use households. The regulations have pushed others into greater energy hardship, including many low-income families with high electricity use, for example larger families.
Under the regulations, low users tended to pay more for each unit of electricity.
Figure C.6 The annual cost of electricity for Low Fixed Charge Tariff versus Standard Tariff. Costs are illustrative only

Text description of figure C.6
Line chart showing the annual cost of electricity versus annual electricity consumption for a low fixed charge tariff and standard tariff electricity plan. Below the threshold of 8000 kilowatt-hours per year, the low fixed charge tariff is less expensive than the standard tariff. Meanwhile the low fixed charged tariff is more expensive than the standard tariff when above the 8,000 kilowatt-hours threshold.
This higher rate could be up to 30% more than high-use households paying the standard fixed charge. Low-income homes may choose to under-heat their homes to save on power bills, which can negatively affect their health and wellbeing.
The Low Fixed Charge Tariff regulations also created barriers for the industry to undertake distribution pricing reform. Removing the regulations will help electricity retailers introduce pricing plans, like Time of Use pricing, where households get cheaper rates if they can shift their power use away from peak periods. This has the potential to save households money while also reducing the need for expensive network upgrades that could see further costs passed onto households’ bills.
What are the expected impacts?
We are still uncertain over how power companies will choose to structure their pricing plans during the phase-out, and therefore what the impact on households will be. It may be that fixed charges rise and variable charges fall, meaning greater benefits for larger households that use more electricity.
Overall, we expect about 60% of all households — about 970,000 households — will have lower power bills during the phase-out as the lower rate for electricity used will have a greater impact on their overall power bill. These households are likely to be those on standard-use plans and those on low-use plans using more than 6,500 kilowatt hours (kWh) a year.
Box C.2 The effects of Cyclones Dovi and Gabrielle on the electricity market
Cyclone Dovi and Cyclone Gabrielle brought a large amount of rain to the North Island in 2022 and 2023 respectively.
The week that Cyclone Dovi arrived in February 2022, hydro storage in the North Island increased by 29%, bringing our national hydro storage to 93% of full capacity. Lake Tekapo was operating above its maximum operating level, resulting in spill. Cyclone Dovi also brought strong winds to the country, which meant we required low levels of thermal and hydro generation.
Cyclone Gabrielle affected the country differently in February 2023. North Island hydro storage was not affected because the central North Island avoided the worst of the rain associated with the cyclone. National demand decreased by 4% from the previous week, to 705 GWh. The reduction in demand was due to a significant number of power outages in the distribution networks because of the cyclone. Transpower issued a Grid Emergency Notice (GEN) when supply from the grid was cut to Hawke's Bay and Gisborne. Demand peaked at 5,618 MW at 17:30 on Monday evening, 13 February, before the Grid Emergency started.
Additionally, Cyclone Gabrielle brought significant challenges to energy security. The Redclyffe sub‑station in Napier was flooded, leaving households in the region disconnected from the national grid. The power cuts also led to the failure of communication infrastructure in the region.
The Auckland Panmure Grid Exit Point (GXP) saw a decrease in electricity demand due to flooding, while Southdown GXP saw an increase. Both GXPs power Auckland’s rail network, while Panmure GXP also powers the charging stations for Auckland EV buses. Pan Pac’s Whirinaki plant was also flooded and shut down. At the time of writing, Pan Pac had yet to fully restore operations at the plant.
Figure C.7 Auckland metro GXP demand, from March 2019 to March 2023
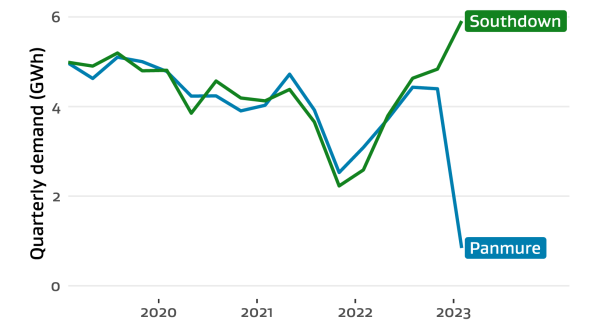
Grid Exit Points (GXP) are the points where electricity leaves the national grid operated by Transpower and enters the local distribution network.
Text description of figure C.7
Line chart showing monthly demand for electricity at the Southdown and Panmure Grid Exit Points from March 2019 through March 2023. Demand for both points is about the same until December 2022, when demand in Panmure dropped suddenly while demand at Southdown increased to around 6 gigawatt-hours.