June 2025 summary
On this page I tēnei whārangi
This is the web version of the New Zealand Energy Quarterly December 2024 Summary.
Download the PDF and word versions:
New Zealand Energy Quarterly June 2025 summary [PDF, 784 KB]
New Zealand Energy Quarterly June 2025 summary [DOCX, 5.5 MB]
Geothermal generation hits another record high
Hydro generation was down 6.8% the June 2024 quarter, with lower hydro storage in April contributing to this. This reduction in hydro generation was compensated for with an increase in generation from other renewable sources. Additions to geothermal generation capacity over the past year (Tauhara in May 2024 and Te Huka 3 in October 2024) saw geothermal generation hit a record 2,471 GWh in the June 2025 quarter (enough to meet the annual electricity use of over 300,000 households), up 12.6% from the June 2024 quarter. Wind generation was also up 17.6%, while capacity additions also contributed to a 48.7% increase in generation from solar.
The combination of increased generation from renewable sources and lower electricity demand (meaning that less supply was required) saw a reduction in the level of electricity generation required from non-renewable sources. As a result, generation from gas and coal generation were both down (by 0.9% and 38.3% respectively) and the share of electricity generation from renewable sources increased 2.7 percentage points to 84.1%.
National electricity consumption fell 4.0% from the June 2024 quarter. Contributing to this was lower electricity use by New Zealand Aluminium Smelters due to its demand response agreement being in effect. Additionally residential electricity consumption was down 4.0% on the previous June quarter, which had seen increased electricity use by households in response to a cold snap in May 2024.
Total gas use in the economy was down 19.8%, with the quarter seeing Methanex pausing operations at its Motunui facility for 8 weeks to free up gas for electricity generation.
Coal imports increased from 71.5 kilotonnes in the June 2024 quarter to 539 kilotonnes in the June 2025 quarter as shipments of coal arrived in the country to increase the stockpile for electricity generation.
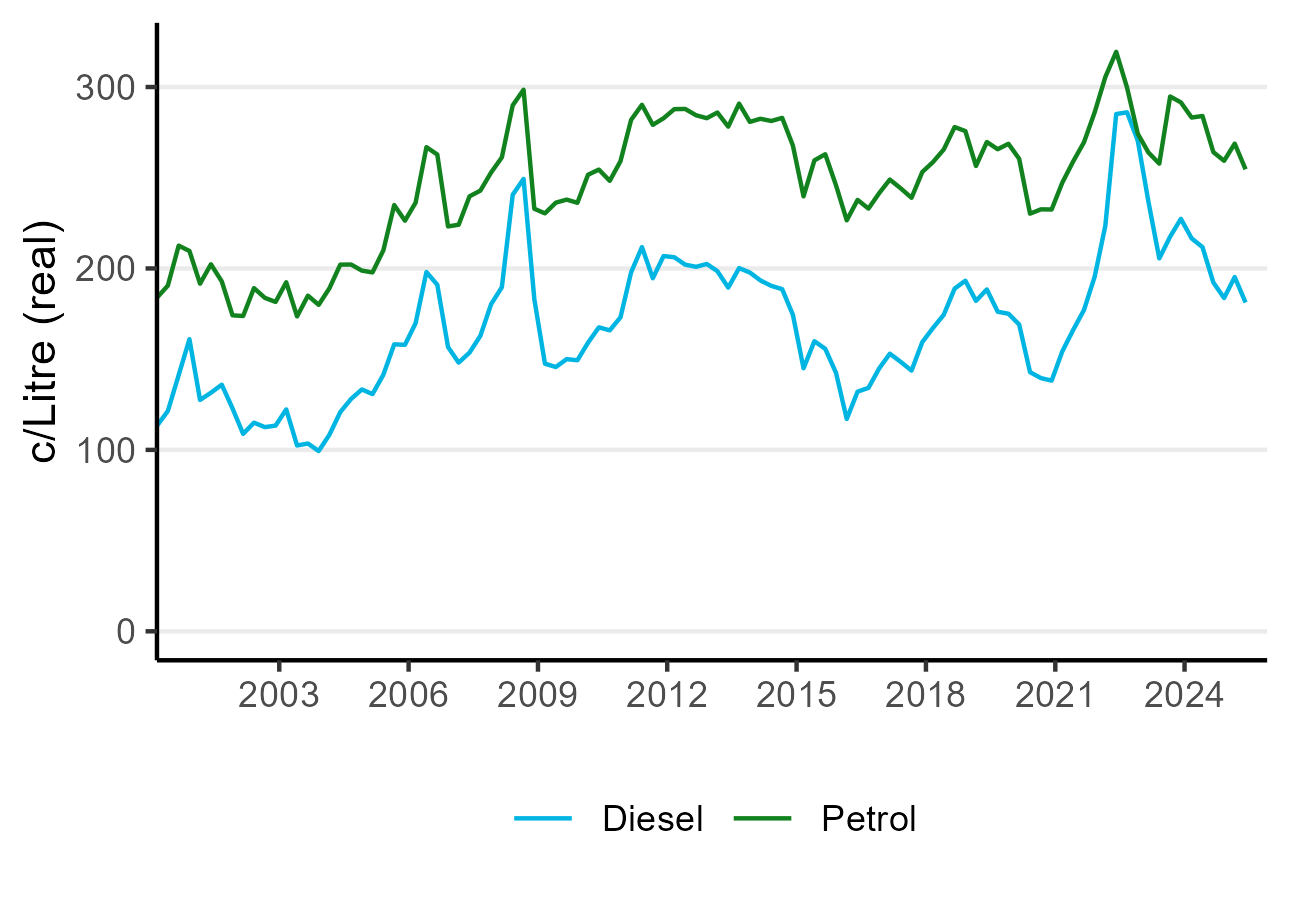
Petrol and diesel prices fell due to decisions by OPEC+ to increase their output, along with the removal of the Auckland Regional Fuel Tax on 30 June 2024. Petrol prices decreased 10.3% to 255 cents per litre, while diesel retail prices decreased 14.4% to 181 cents per litre.
Summary charts
Electricity generation by source
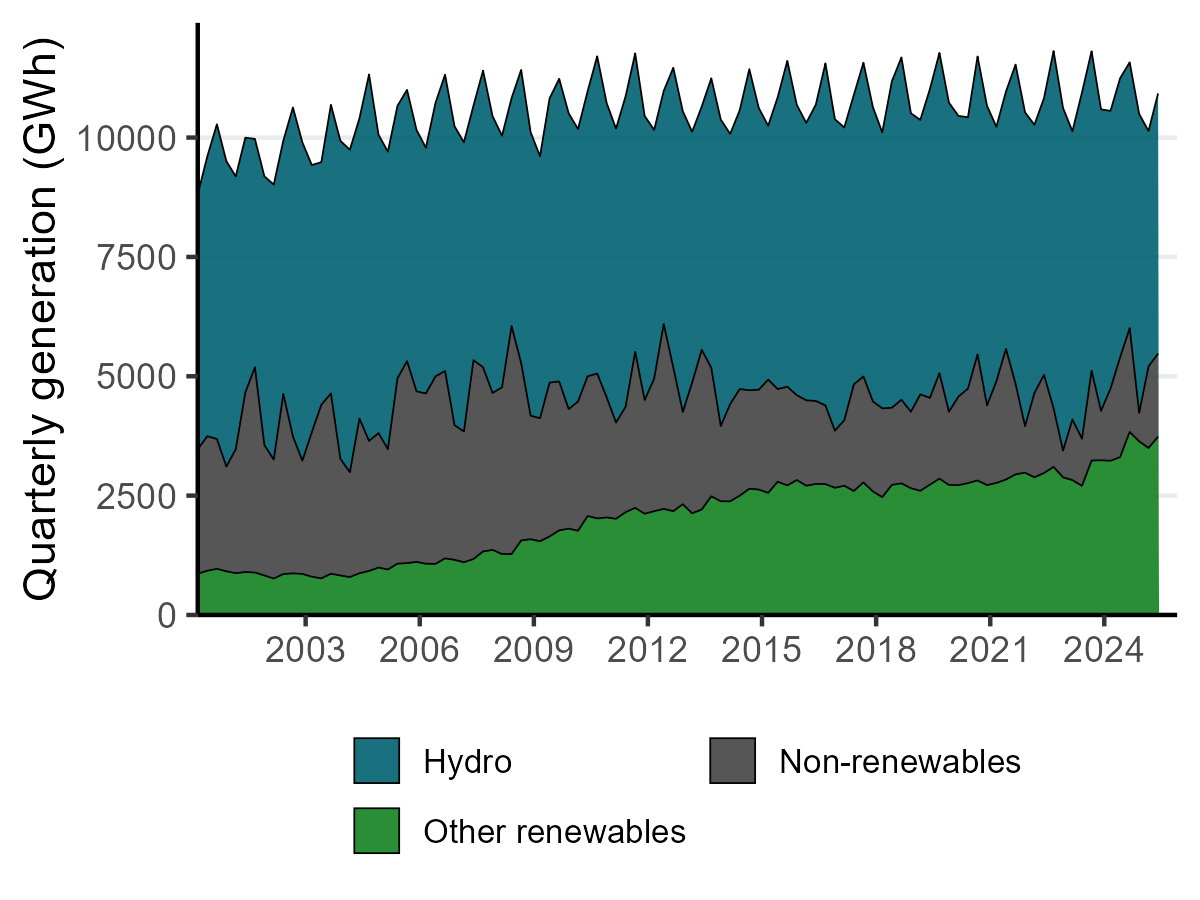
Text description of chart - Electricity generation by source - June 2025
Electricity generation from geothermal
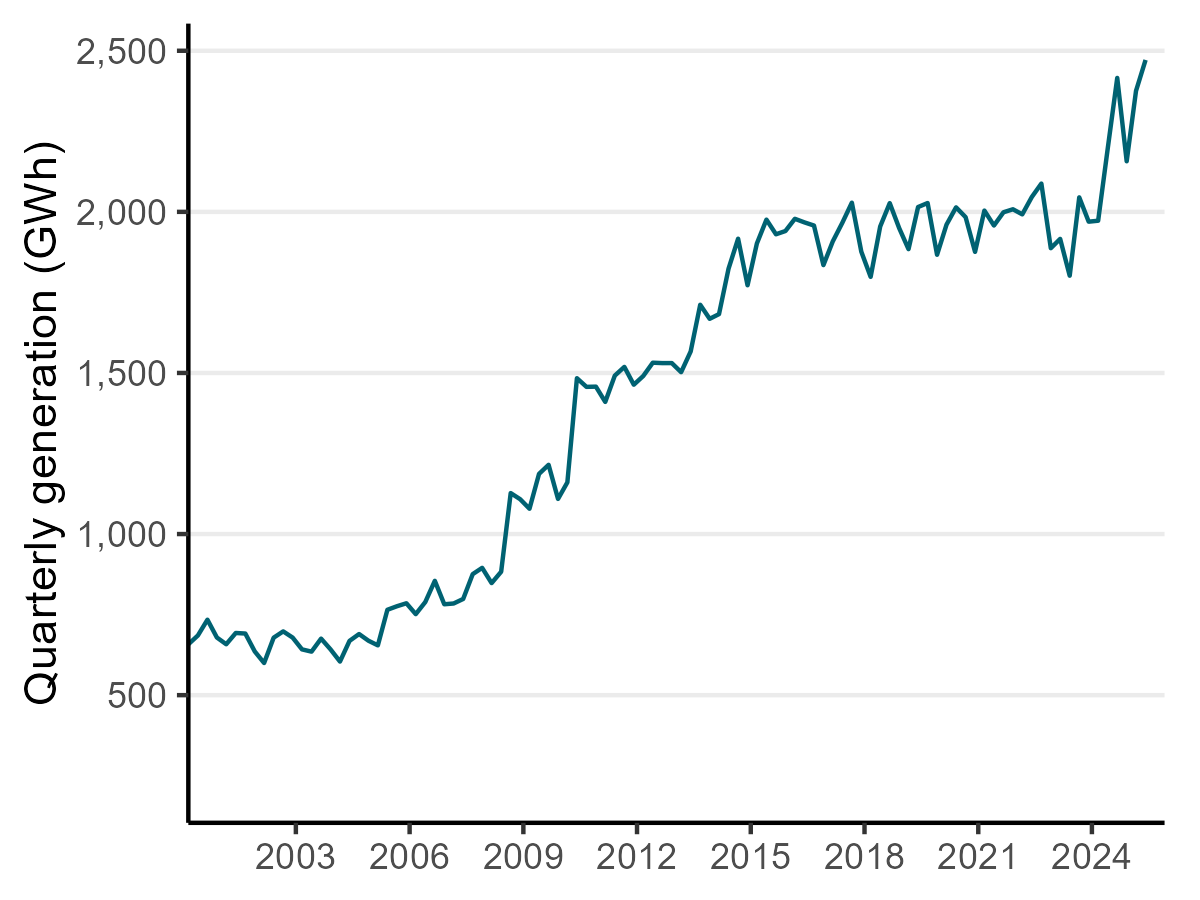
Text description of chart - Electricity generation from geothermal - June 2025
Electricity consumption
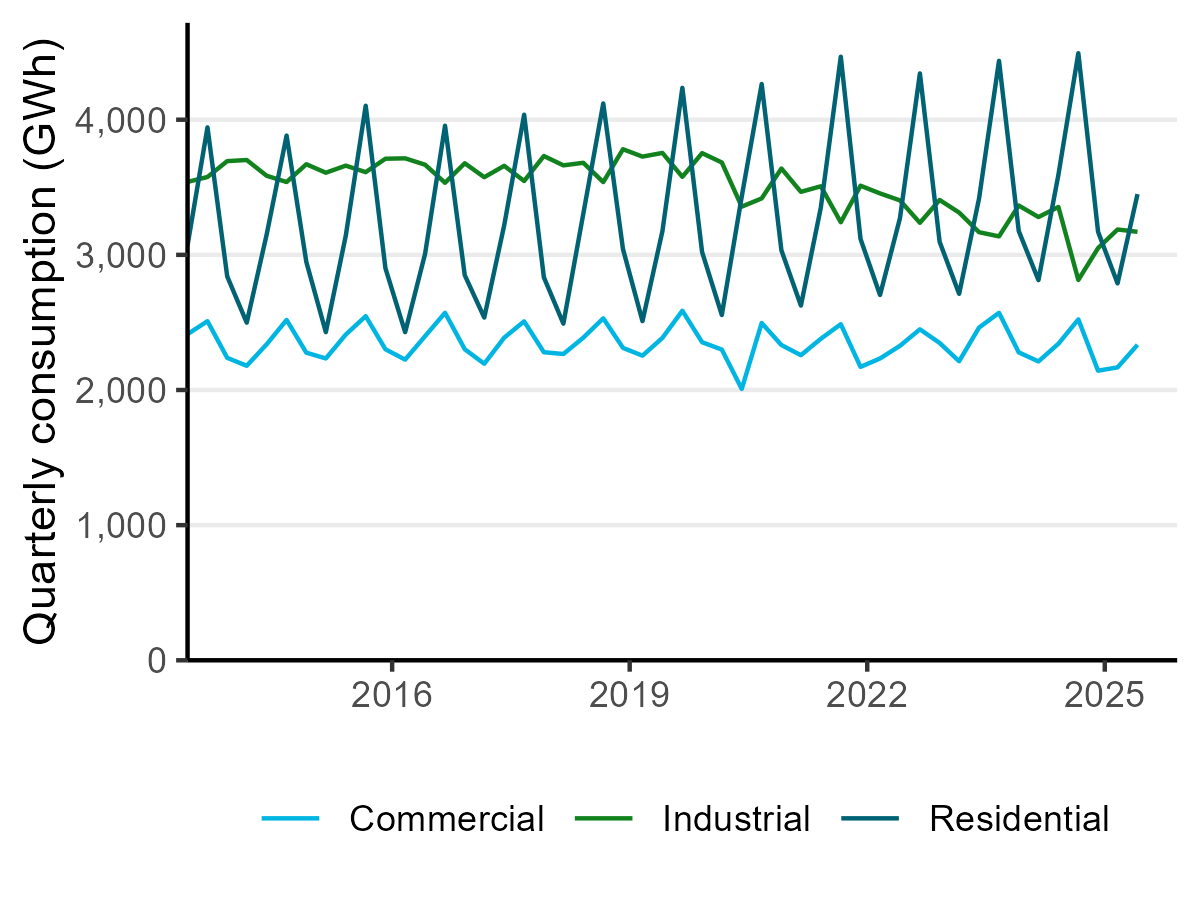
Text description of chart - Electricity consumption - June 2025
Gas use by purpose
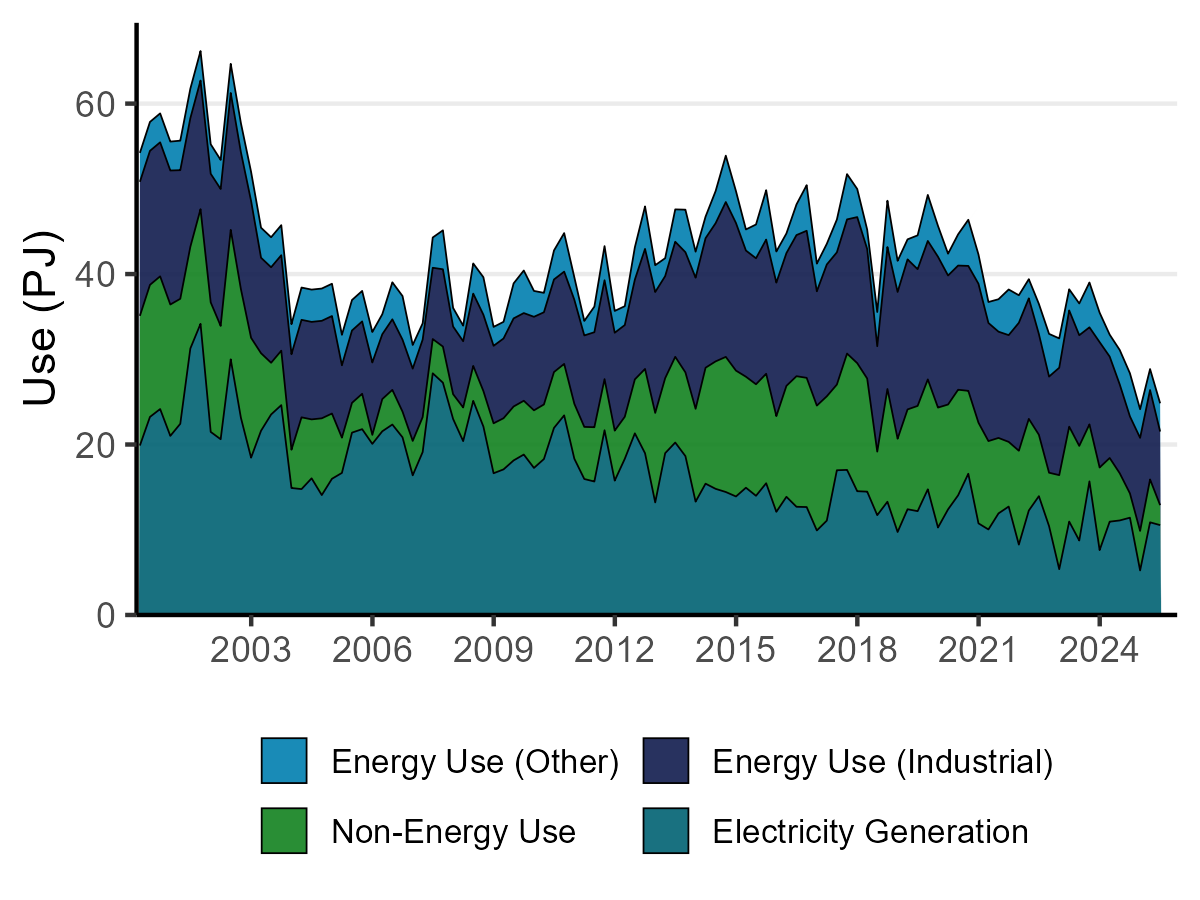
Text description of chart - Gas use by purpose - June 2025
Petrol and diesel prices
Text description of chart - Petrol and diesel prices - June 2025