Regional Tourism Indicators country analysis
This page explores electronic card spending patterns for the China market, and provides insights into the types of analysis the Regional Tourism Indicators can produce.
On this page
In-depth market analysis using the RTIs
The Regional Tourism Indicators (RTI) is a rich source of data, which can be used to explore onshore spending dynamics for particular visitor markets and across different regions of New Zealand. We have not previously had such detailed expenditure data at a regional level.
See The Regional Tourism Indicators (RTIs) development and data sources for a detailed description of what's included in the RTI data.
Why the China market is so important for NZ
Note: The material below is no longer current, but is preserved for reference purposes.
China is New Zealand’s fastest growing market for international visitors, rapidly overtaking other major markets to become our second largest source of visitor revenue and third largest in terms of arrivals.
In the year ended September 2012, Chinese arrivals grew by 38% to reach 187,000, while expenditure by Chinese visitors reached $555 million (Figure 1).
Figure 1: Visitor expenditure across key visitor markets, 1998-2012
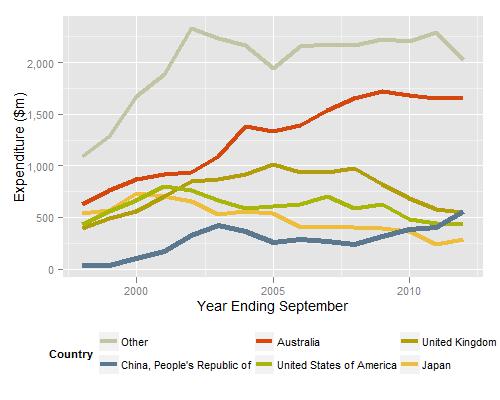
Source: MBIE, International Visitor Survey
China’s relative importance to New Zealand has been dramatically increased with the onset of global economic difficulties, which are expected to suppress demand from New Zealand’s other long haul visitor markets for some time.
Visitor arrivals forecast
The New Zealand Tourism Forecasts for 2012–2018 show that Chinese visitor arrivals are forecast to grow more strongly than total visitor expenditure. Recognising the huge potential of China, and the need to get it right, the Government embarked on the China Market Review. This project draws expertise from the public and private sectors to look at how to better attract and cater for Chinese visitors, and importantly, increase the value of the market.
Chinese visitors spend an average of $3300 when they visit New Zealand. However, this average rate of expenditure is forecast to fall almost continually over the coming years to only around $1500 in 2020, due to the changes in the visitor mix.
Length of stay
Chinese visitors don't stay for very long when they visit New Zealand. Although in the year ending September 2012, the average length of stay was 16.6 days (and is forecast to decline), half of Chinese visitors actually only spend 4 days in the country. Categories of tourism spending that are closely linked to the number of days spent in the country can be particularly impacted by shorter stays, such as spending on accommodation, and food and beverage.
The more knowledge we have on expenditure patterns and market behaviour, the more likely we are able to influence the current trajectories and drive any change that is needed to best benefit from this rapidly growing market.
Regional spread of Chinese electronic card spend
Figure 2 below shows the proportion of Chinese expenditure across the regions, compared with the UK market. The majority of Chinese electronic card spend is spread across:
- Auckland (62%)
- Bay of Plenty (includes Rotorua) (12%)
- Otago (14%)
with the remaining 12% spread across the other regions.
Figure 2: Percentage market share across regions, China vs United Kingdom, year ending October 2012
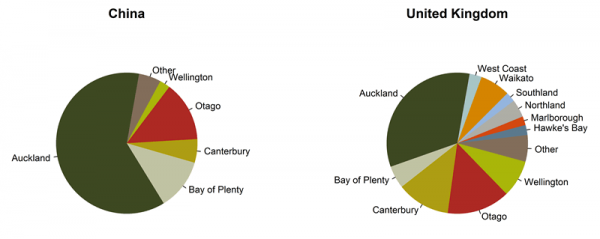
Source: MBIE, Regional Tourism Indicators
The comparison between China and the UK is to illustrate the differences in regional spread between the two visitor markets, and does explain why businesses in some regions have no visibility of the changes being experienced in volume often reported in media.
Growth in Chinese electronic card spend
Figure 3 below shows the growth in Chinese electronic card spending since 2008. The circles on the map represent the overall size of expenditure in the regions and can be seen in context with the overall growth in expenditure.
Since 2008, the Bay of Plenty region, which has been a key focal point for Chinese visitors, has seen a 9% decline per year in expenditure. Many South Island regions have seen remarkable growth in expenditure from Chinese visitors — eg, Chinese expenditure has grown:
- 78% per year in the West Coast
- 62% per year in the Otago region
- 58% per year in Southland.
For the South Island, however, much of this growth is on a very small number of card transactions.
Figure 3: Growth in Chinese spending by region, percent per year since 2008
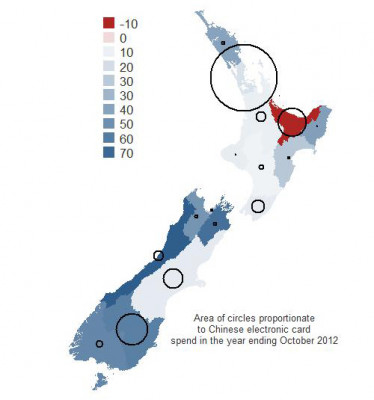
Source: MBIE, Regional Tourism Indicators
What Chinese visitors are spending their money on while in NZ
Figure 4 below shows the changing composition of Chinese electronic card expenditure in selected RTOs (Auckland, Rotorua, Wellington, Christchurch, West Coast and Queenstown). It's important to note that electronic card spend doesn't include prepaid expenditure, which must be taken into account when interpreting the data. For example, prepaid accommodation won't be included in the RTI data.
Figure 4: Composition of Chinese spend in selected RTOs, 2008 and 2011
Area of circles are proportionate to Chinese RTI spend
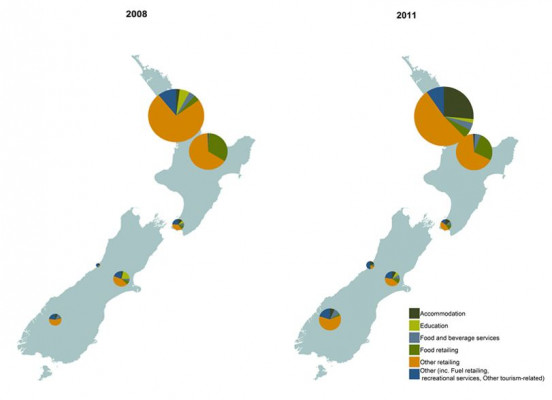
Source: MBIE, Regional Tourism Indicators
As well as the overall magnitude of spend (that is, size of circles) increasing between 2008 and 2011, the composition of this spend has also changed over time.
For example:
- Electronic card spending on accommodation services in Auckland RTO makes up a larger proportion of total spend for the region in 2011 than it did in 2008. However, this is probably due to decreasing use of prepaid accommodation, which isn't included in the RTI data, rather than a change in overall spending pattern.
- While the total amount of spend has decreased for Rotorua RTO since 2008, the region has seen an increased proportion of spending on food and beverage services, over other retailing, during this time.
- The proportion and amount of expenditure on education has decreased since 2008 in Auckland, Wellington and Christchurch RTOs.
- The composition of spend also varies between North and South islands, with ‘other retailing’ comprising a far larger contribution to North Island electronic card spending than in the South Island.
Figure 5 below shows the composition of Chinese spend by ANZSIC groups (see definition below) for New Zealand regions.
Chinese electronic card spend shows different patterns in Auckland, Otago and Bay of Plenty regions compared with electronic card spend for other international visitors. Compared with other international visitors, the Chinese spend a significantly higher proportion on ‘other retailing’ in Auckland and Otago, and ‘food retailing’ in Bay of Plenty. In other New Zealand regions, the difference is less obvious.
Figure 5: Composition of spend by ANZSIC in regions, China versus other countries, year ending Oct 2012

Source: MBIE, Regional Tourism Indicators
What ANZSIC is
The Australian and New Zealand Standard Industrial Classification (ANZSIC) 2006 is used to compile and analyse industry statistics in New Zealand and Australia. Individual business entities are assigned to industries based on their predominant activity.