December 2023 summary
On this page
This is the web version of the New Zealand Energy Quarterly December 2023 Summary.
Download the PDF and word versions:
New Zealand Energy Quarterly December 2023 summary [PDF, 403 KB]
New Zealand Energy Quarterly December 2023 summary [DOCX, 925 KB]
Increased renewable generation capacity for December quarter
The renewable share of electricity generation was 90.3% for the October to December 2023 quarter.
Electricity generation from wind reached a record high of 977 GWh for the quarter and represents an increase of 32.9% compared to the same period last year. There was also a record of 125 GWh of electricity generation from grid connected solar for the quarter.
The Harapaki Wind Farm and the Kaitaia solar farm began operation this quarter, which contributed to the increase in renewable generation. Grid connected solar capacity increased from 2.1 MW to 23.7 MW, and wind capacity will increase by 176MW once the Harapaki Wind Farm is fully operational.
The renewable share of electricity generation remained high, despite hydro inflows being lower than average. Hydro generation was 12% lower than in the previous year’s December quarter, largely due to low rainfall.
The lower hydro inflows resulted in an increase in coal and gas use to meet demand. Despite this, coal and gas-based generation made up just 3.5% and 6.1% of total generation respectively.
Greenhouse gas emissions from electricity generation increased by 352 kt CO2-e (93%) when compared to the same period in 2022. This increase was driven largely by the increase in coal-fired generation.
International aviation fuel use increased 51% on the previous year’s December quarter. This continued the longer term trend and recovery from the drop caused by travel restrictions in response to the COVID-19 pandemic.
Electricity generation from hydroelectric and geothermal sources
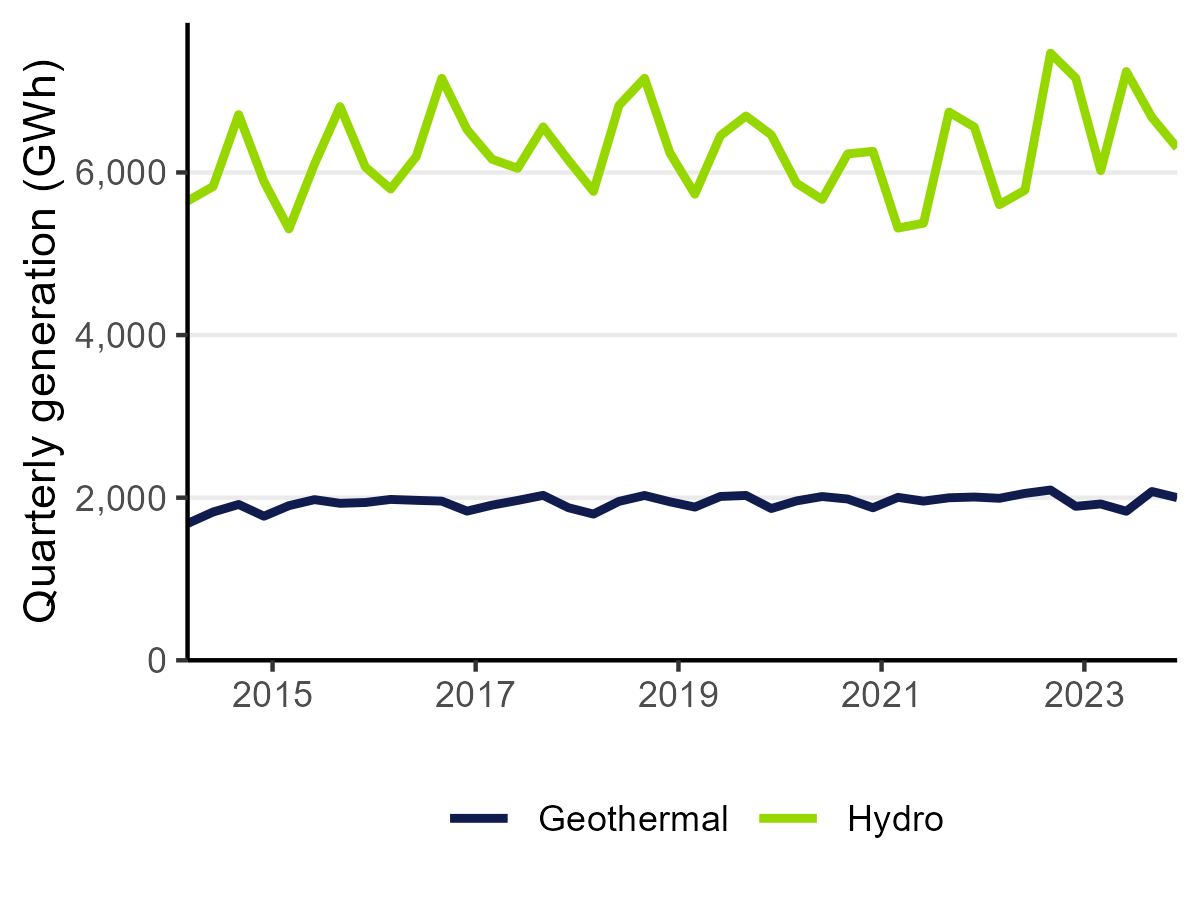
Text description – Electricity generation from hydroelectric and geothermal sources
Electricity generation from solar and wind sources
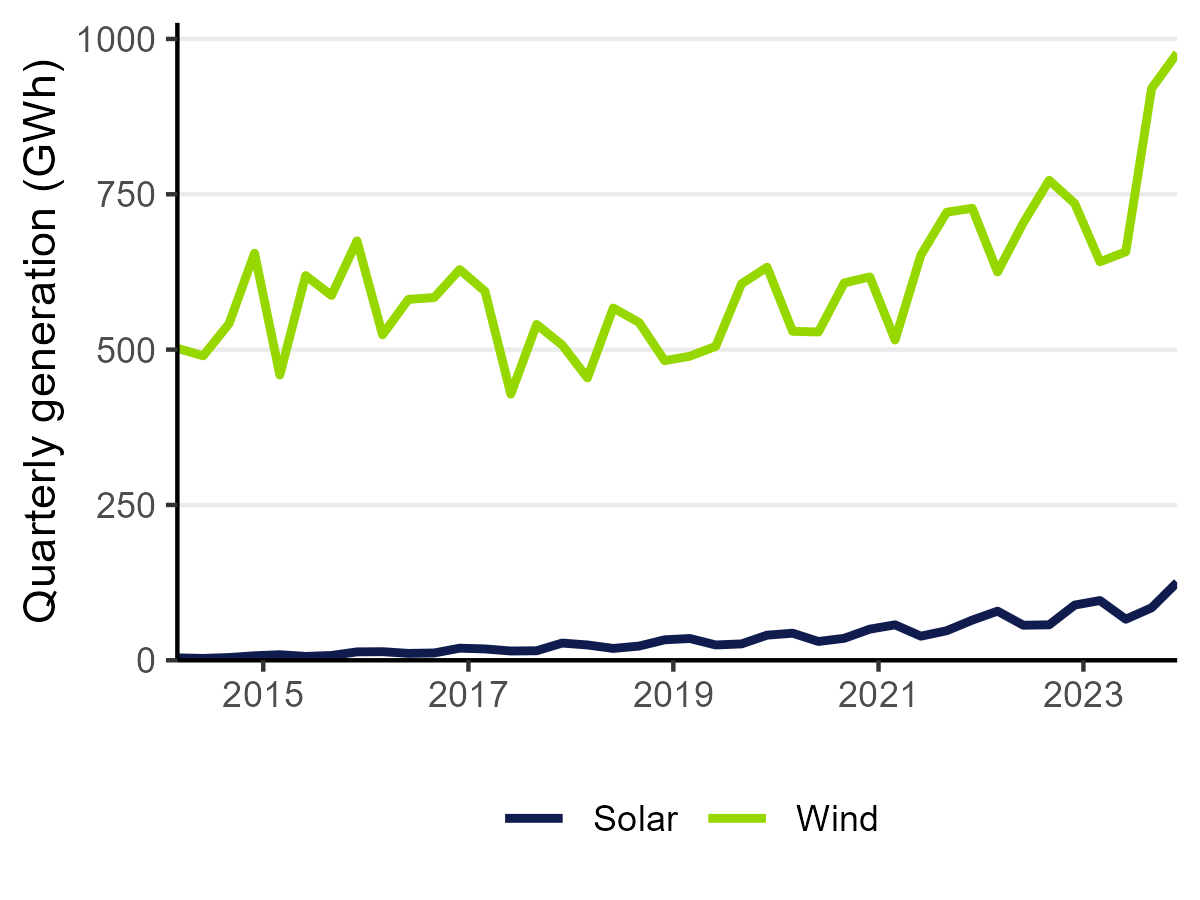
Text description – Electricity generation from solar and wind sources
Electricity generation from coal and gas
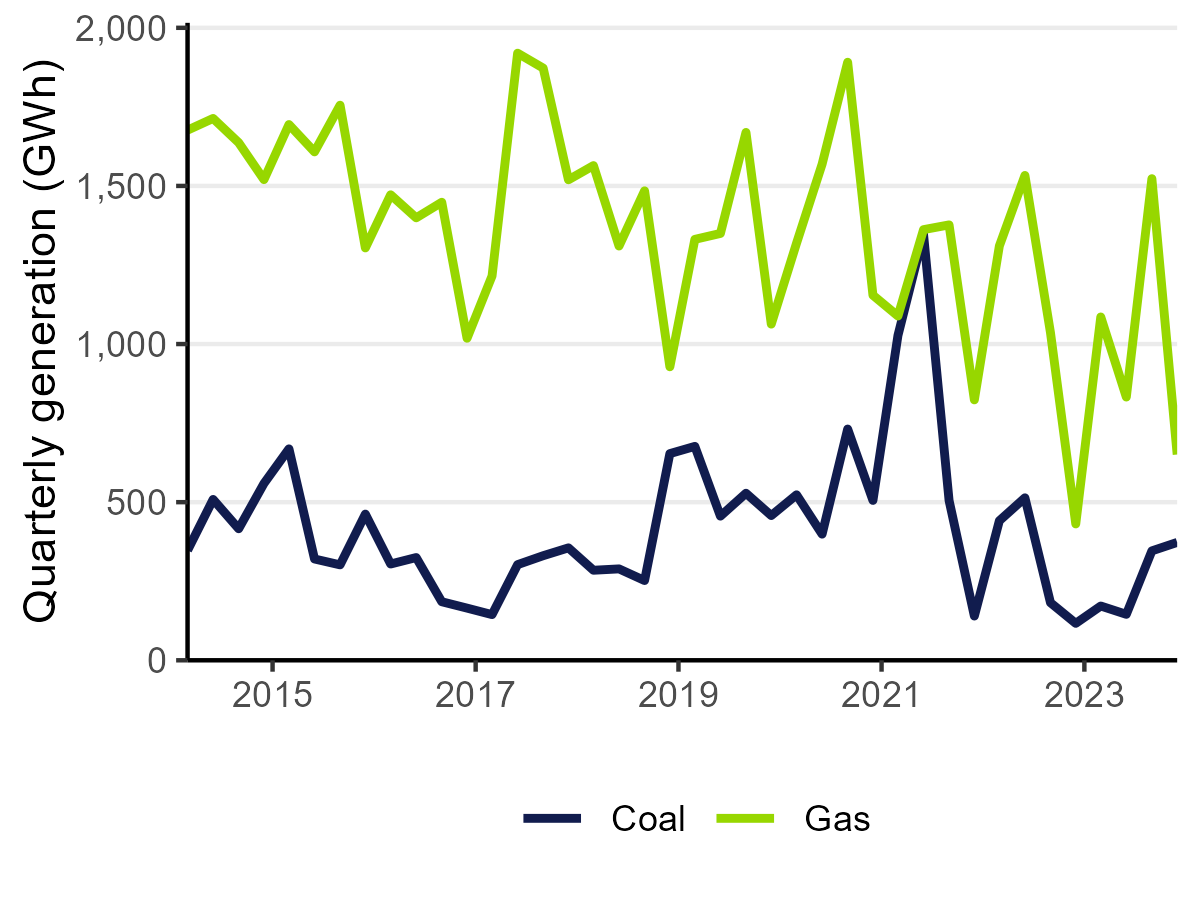
Text description – Electricity generation from coal and gas
Electricity from renewable sources
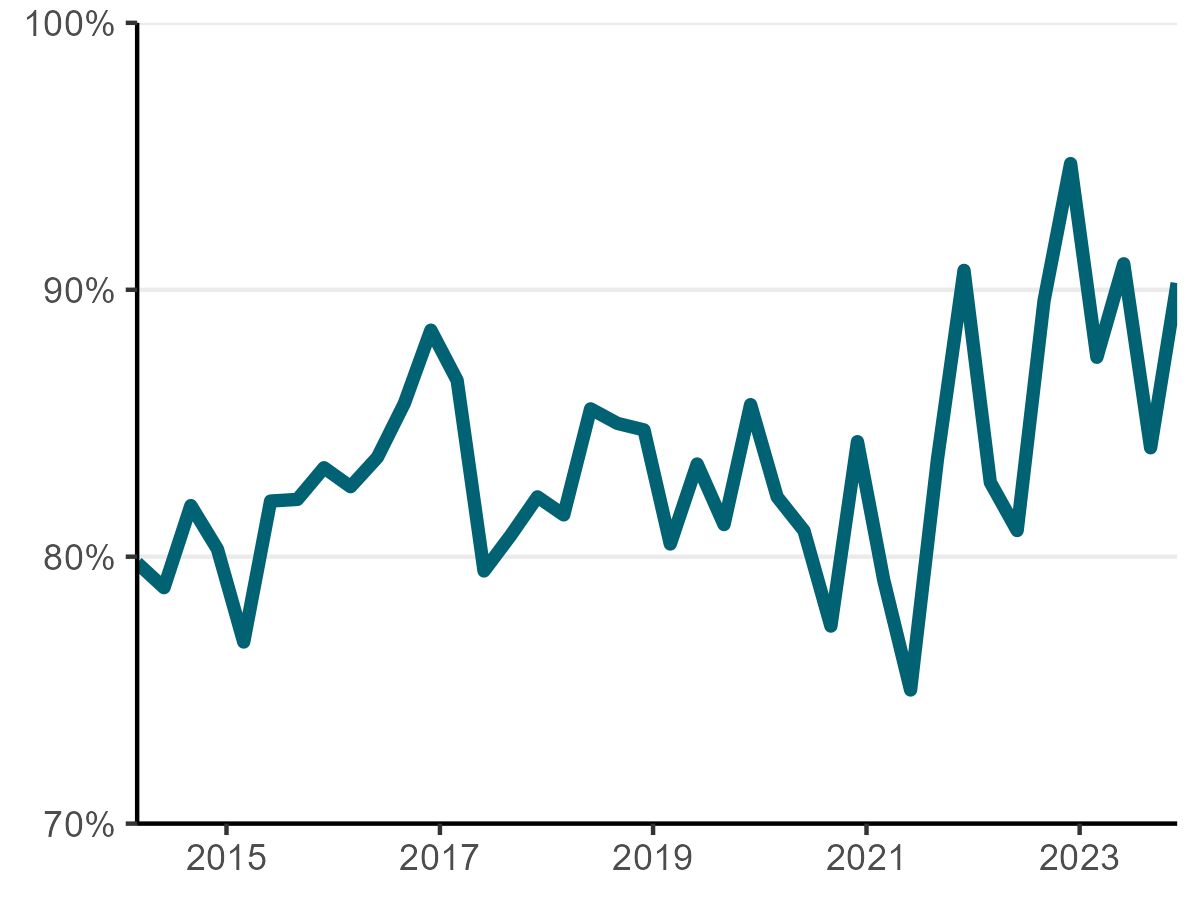
Text description – Electricity from renewable sources
CO2-e emissions from electricity generation
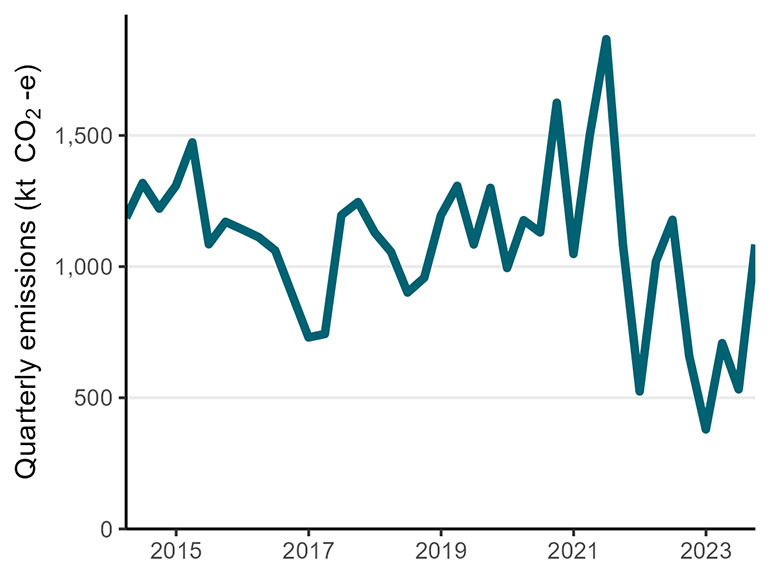
Text description – CO2-e-e emissions from electricity generation
Jet fuel consumption
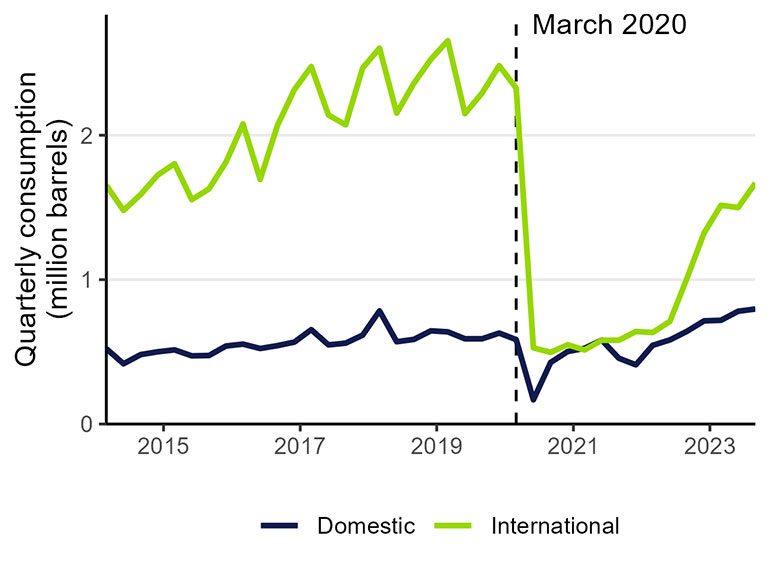
Text description – Jet fuel consumption