
June 2026 summary
On this page I tēnei whārangi
This is the web version of the New Zealand Energy Quarterly March 2026 summary.
Download the PDF and word versions:
High renewable electricity generation sustained for third consecutive quarter
The June 2026 quarter was characterised by strong hydro generation, record renewable electricity output, a milestone for solar generation, and higher fuel prices linked to disruption in global oil markets.
Electricity generation increased 1.9% (207 GWh) from the June 2025 quarter to 11,163 GWh, with renewables accounting for 92% of total generation. This is the third quarter in a row that the share of electricity generation from renewable sources has exceeded 90% and is also the highest share of electricity generation from renewables in a June quarter on record.
Renewable generation rose 11.4% (1,052 GWh) on the June 2025 quarter. Favourable hydro conditions, including above-average hydro inflows and storage levels, saw hydro generation increase 14.7% (804 GWh) to 6,283 GWh following strong rainfall events. Geothermal generation reached a record 2,621 GWh (up 5.5%) as new generation capacity came online, while solar generation increased 56.2% (87 GWh) to a record 242 GWh for a June quarter. For the first time on record, New Zealand generated more electricity from solar than coal over the previous 12-months. Wind generation remained near record levels at 964 GWh. As a result, generation from non-renewable sources fell, with gas-fired generation down 37.2% and coal-fired generation down 74.3%.
Electricity consumption increased 3.0% (301 GWh) to 10,211 GWh. Increased irrigation demand due to warm, dry weather conditions in key irrigation regions saw agricultural use increase 9.9%. Industrial consumption increased 6.3%, partly reflecting relatively low electricity use by New Zealand Aluminium Smelters in the first half of 2025 when it was still increasing its usage following its demand response agreement being called on in winter 2024.
Net gas production continued to decline, down 19.5% (5.02 PJ) to 20.71 PJ, while total gas use decreased 20.4% (5.12 PJ) to 19.94 PJ. Gas use in the industrial sector was also affected by Methanex's planned outage at its Motunui facility during May and June to free up gas for the electricity market.
Fuel imports increased 5.6% (4.61 PJ) to 87.49 PJ. The quarter included the first import associated with New Zealand's strategic diesel reserve, contributing to higher diesel import volumes. The strategic diesel reserve is a 93 million-litre national fuel buffer stored in 2 refurbished tanks at Marsden Point.
Coal imports fell 94% (10.80 PJ) to 0.67 PJ, to the lowest level since the December 2011 quarter, reflecting the strength of the coal stockpile at the Huntly Power Station and reduced demand for coal-fired generation. Coal consumption fell 13% (0.36 PJ) to a record low 2.30 PJ, driven by lower industrial use and a 95% reduction in coal use for electricity generation. Coal consumption in the food processing sector decreased 19% following continued fuel switching to biomass.
Energy prices increased across most fuels during the quarter. Global oil market disruptions linked to the conflict in the Middle East increased the cost of imported fuel and contributed to higher domestic pump prices. This flowed through to the prices faced by New Zealand consumers, with quarterly average regular petrol prices up 22% and retail diesel prices up 69%. Residential and industrial natural gas prices increased, with higher network charges to support ongoing infrastructure investment contributing to this.
Quarterly summary charts
Proportion of electricity from renewable sources
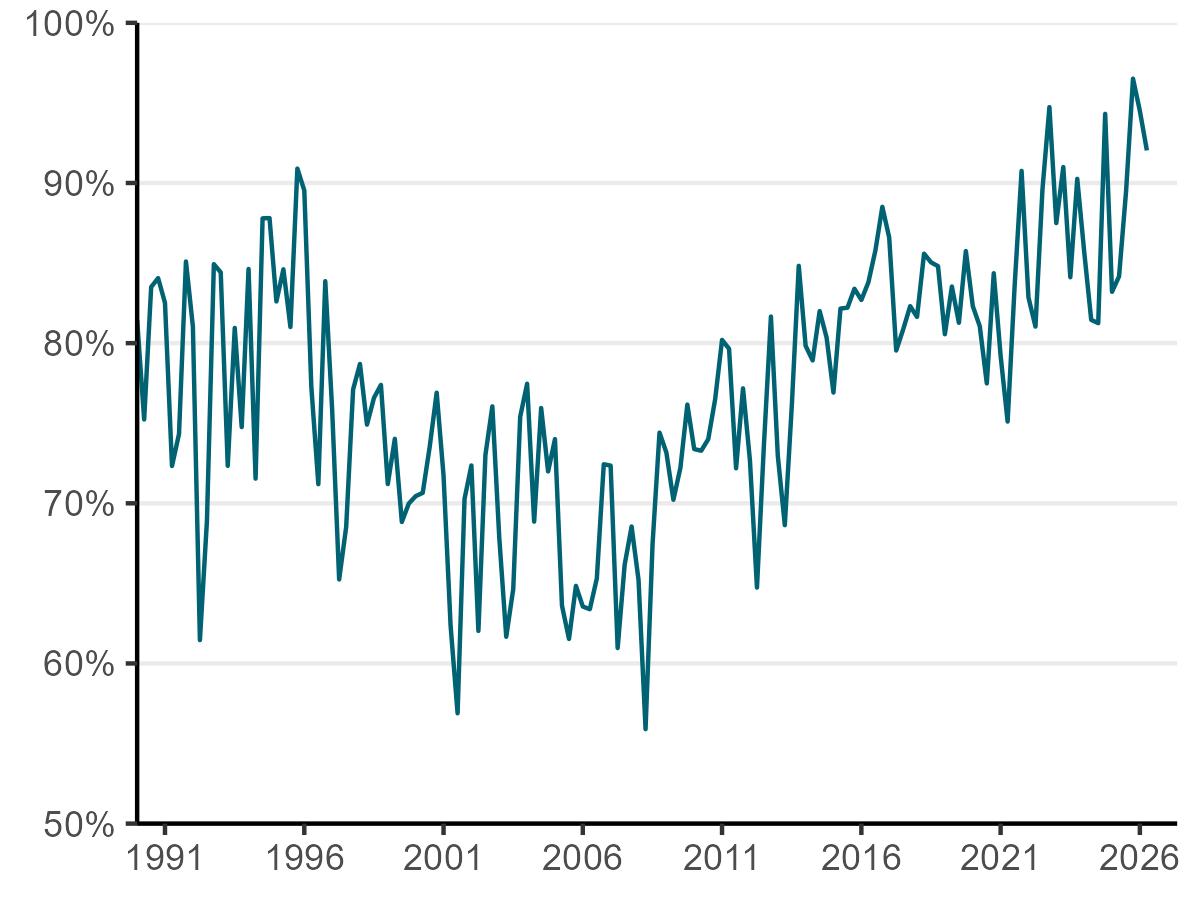
Text description of chart - Proportion of electricity from renewable - June 2026
Electricity from solar, wind, coal, and gas
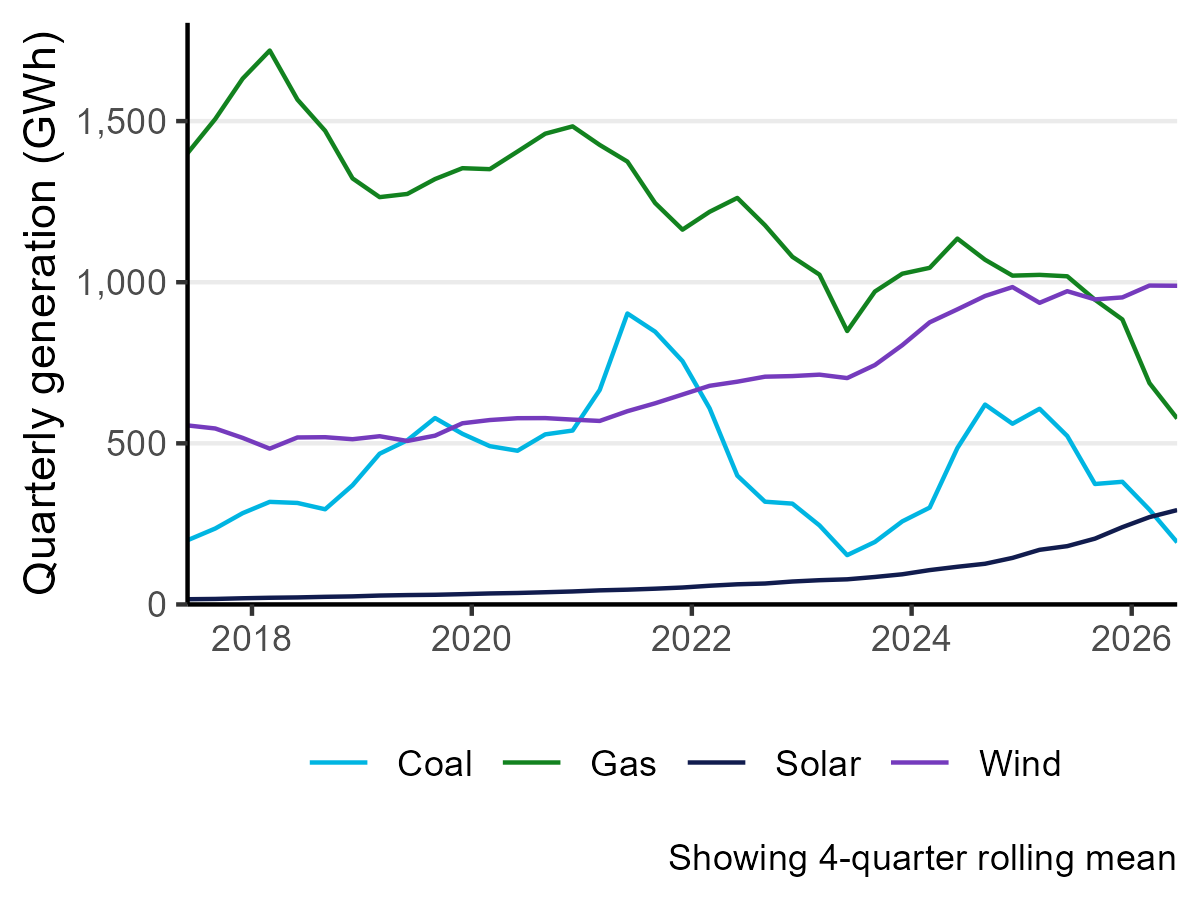
Text description of chart - Electricity from solar, wind, coal, and gas - June 2026
Electricity consumption by sector
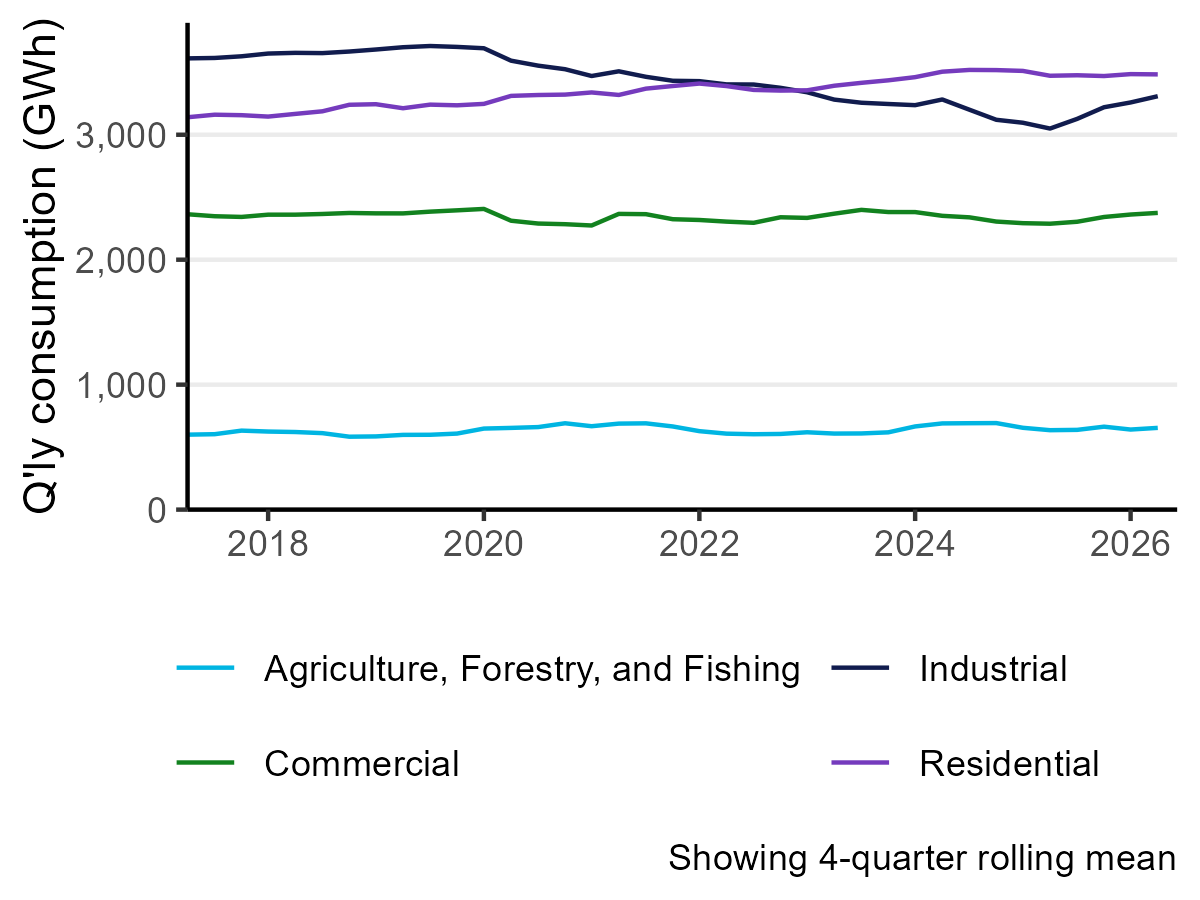
Text description of chart - Electricity consumption by sector - June 2026
Greenhouse gas emissions from electricity generation
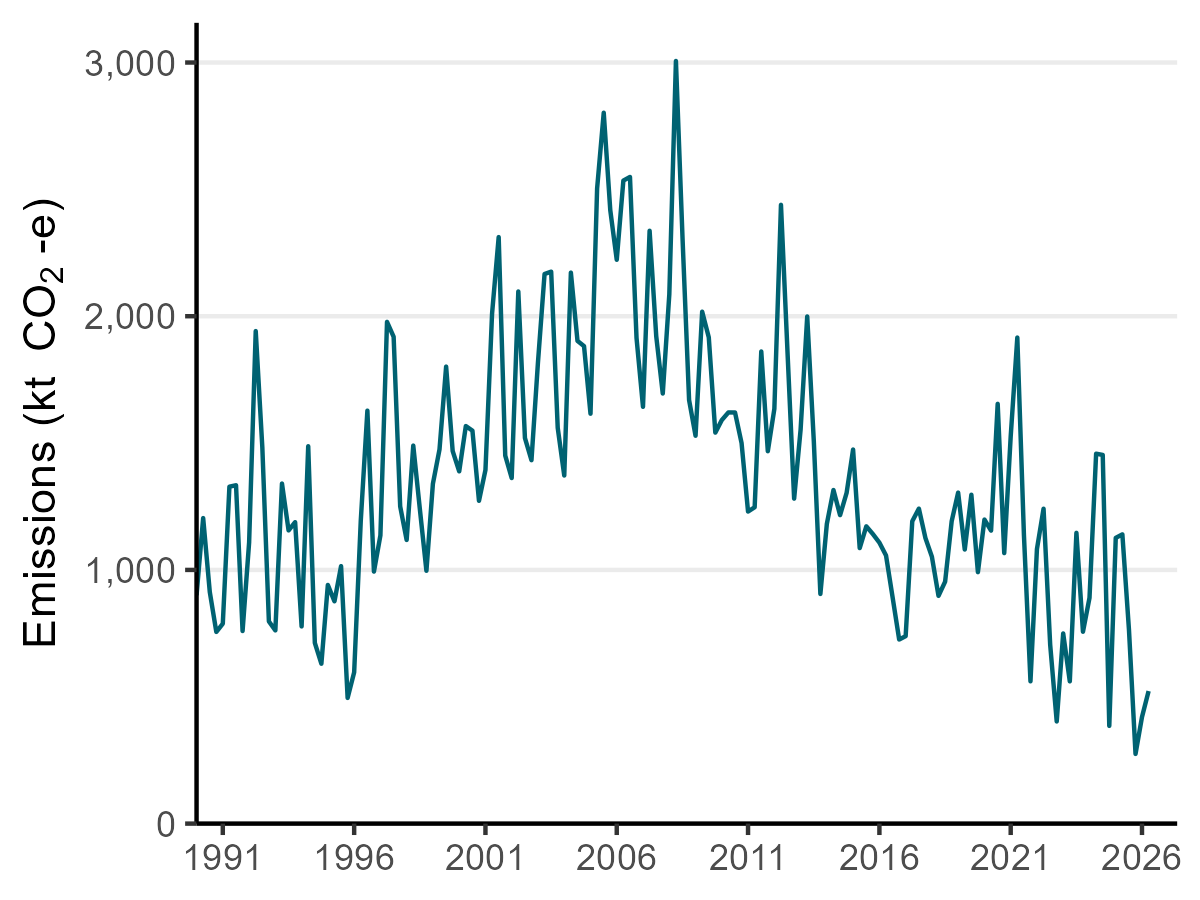
Text description of chart - Greenhouse gas emissions from electricity generation - June 2026
Natural gas production
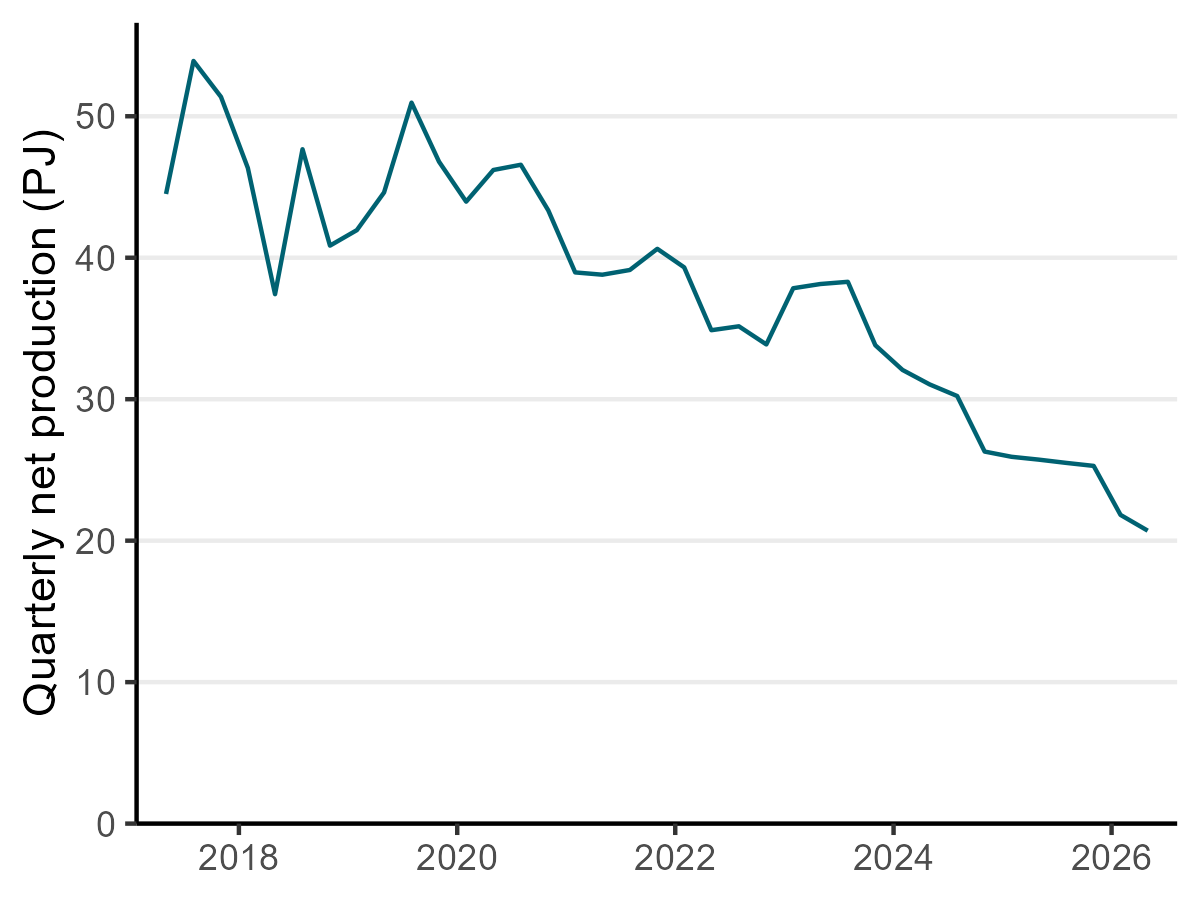
Text description of chart - Natural gas production - June 2026
Petrol and diesel prices
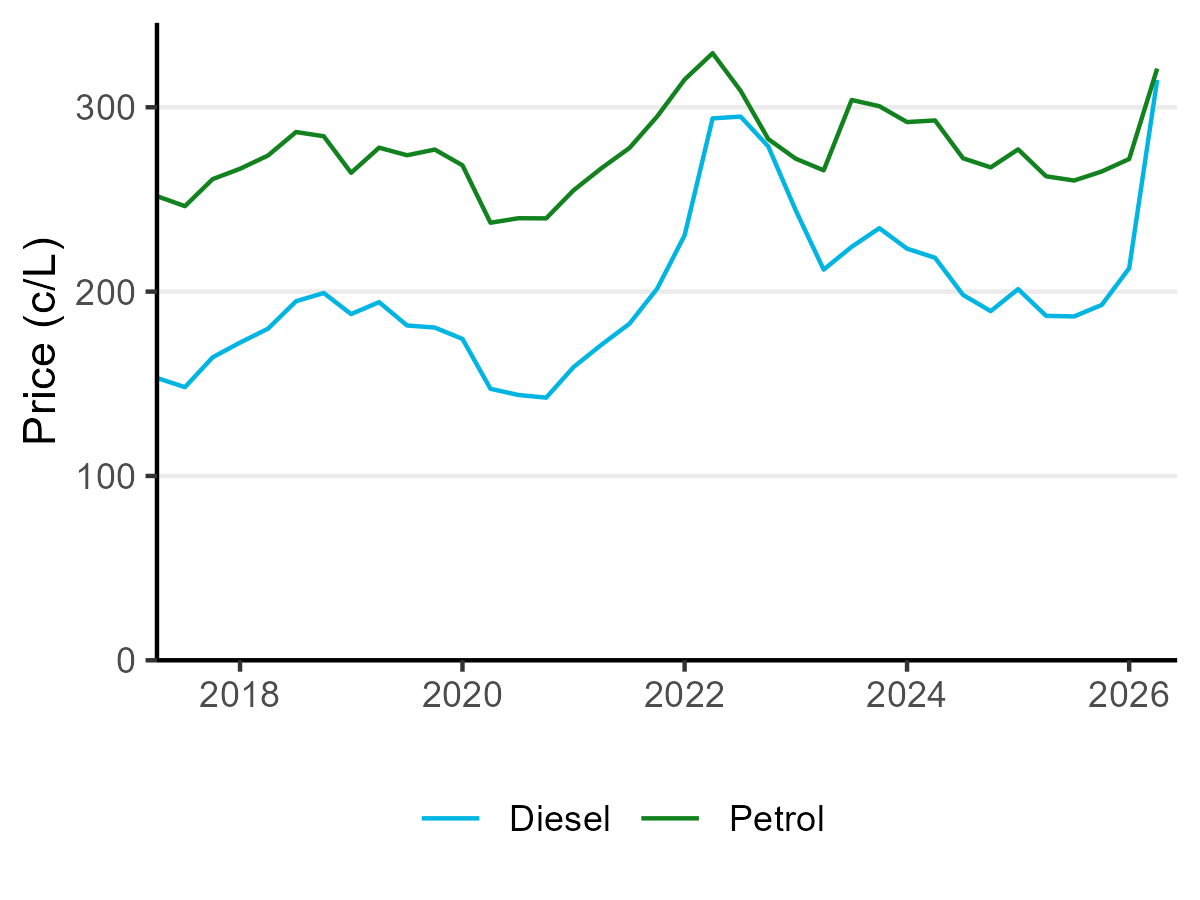
Text description of chart - Petrol and diesel prices - June 2026