
Business investment
Business investment is an important driver of productivity, capital deepening, and long-term economic growth. MBIE's experimental business investment estimates, developed using Stats NZ data, provide insights into investment trends across different asset types and help track changes in business investment over time.
On this page I tēnei whārangi
Note
This update is based on Stats NZ data available at the time of preparation. Subsequent revisions to GDP and expenditure data released by Stats NZ may result in small differences between figures reported here and those published elsewhere. These revisions will be incorporated in the next update, covering the year ended March 2026, which is scheduled for publication in December 2026.
Capital deepening and economic performance
The government is focused on supporting capital deepening through higher business investment to improve our economic performance and productivity.
New Zealand’s low capital intensity is constraining productivity and economic performance. Capital intensity measures the amount of capital available per worker. Compared to other advanced economies, New Zealand workers have relatively low levels of tangible (for example, machinery and technologies) and intangible (for example, intellectual property, research and development) capital assets to work with.
New Zealand’s capital intensity is 52% below the OECD average. This gap has been widening since 1995 when New Zealand was 26% below the average. New Zealand now ranks 33rd of the 38 OECD members on capital intensity and sits well below most advanced economies.
Capital Intensity in New Zealand and selected OECD member countries, 1995 to 2023
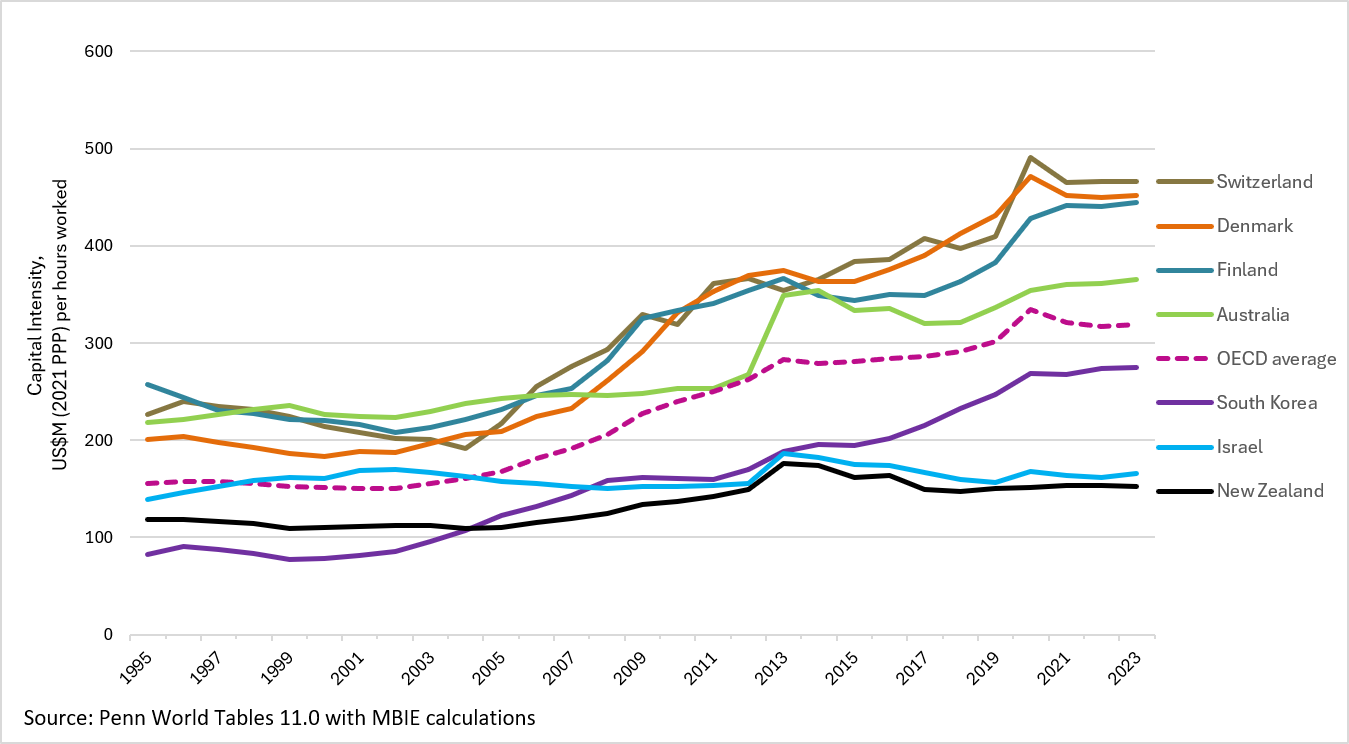
Text description for graph
 Economy-wide capital intensity in New Zealand and selected OECD member countries, 1995 to 2023 [CSV 1KB]
Increasing capital intensity through higher business investment and capital deepening (growth in capital per worker) is an important driver of productivity growth. For this reason, the OECD New Zealand Economic Survey (2026) and IMF New Zealand Country Report (2025) recommend actions that support greater capital deepening.
OECD Economic Surveys: New Zealand 2026(external link) — OECD
New Zealand: 2025 Article IV Consultation-Press Release; Staff Report; and Statement by the Executive Director for New Zealand(external link) — International Monetary Fund
Until now, New Zealand did not have readily accessible business investment data at an aggregate or detailed asset level to track the impact on lifting business investment. In contrast, other countries like Australia and the United Kingdom publish quarterly releases of business investment data.
Using a custom dataset provided by Stats NZ, MBIE has developed estimates of annual business investment by broad asset type for publication as an experimental series. Business investment for this report is defined as private investment excluding dwellings and accounts for around 55% of total investment (gross fixed capital formation).
Key findings on investment
Business investment decreased despite some positive sector trends: Business investment (private investment excluding dwellings) decreased by 2.5% in the March 2025 year. Positive increases in plant, machinery, equipment (1.9%) and land improvement (3.6%) investment were more than offset by weakness in non-residential building and transport equipment investment.
Whole-of-economy investment decreased at an even greater rate: New Zealand’s “total” investment (Gross Fixed Capital Formation (GFCF) which includes residential investment and government investment) fell by 5.0% in the March 2025 year.
Multi-year performance: The level of business investment in the March 2025 year was 15.7% higher than the post-COVID low in 2021 while “total” investment GFCF was 6.0% higher.
Asset-level trends in business investment
Asset-level contributions to business investment show growth in plant, machinery and equipment, but weakness in non-residential buildings and transport equipment.
Contribution to New Zealand business investment by asset, chained volume measure, year-on-year change, 2016 to 2025
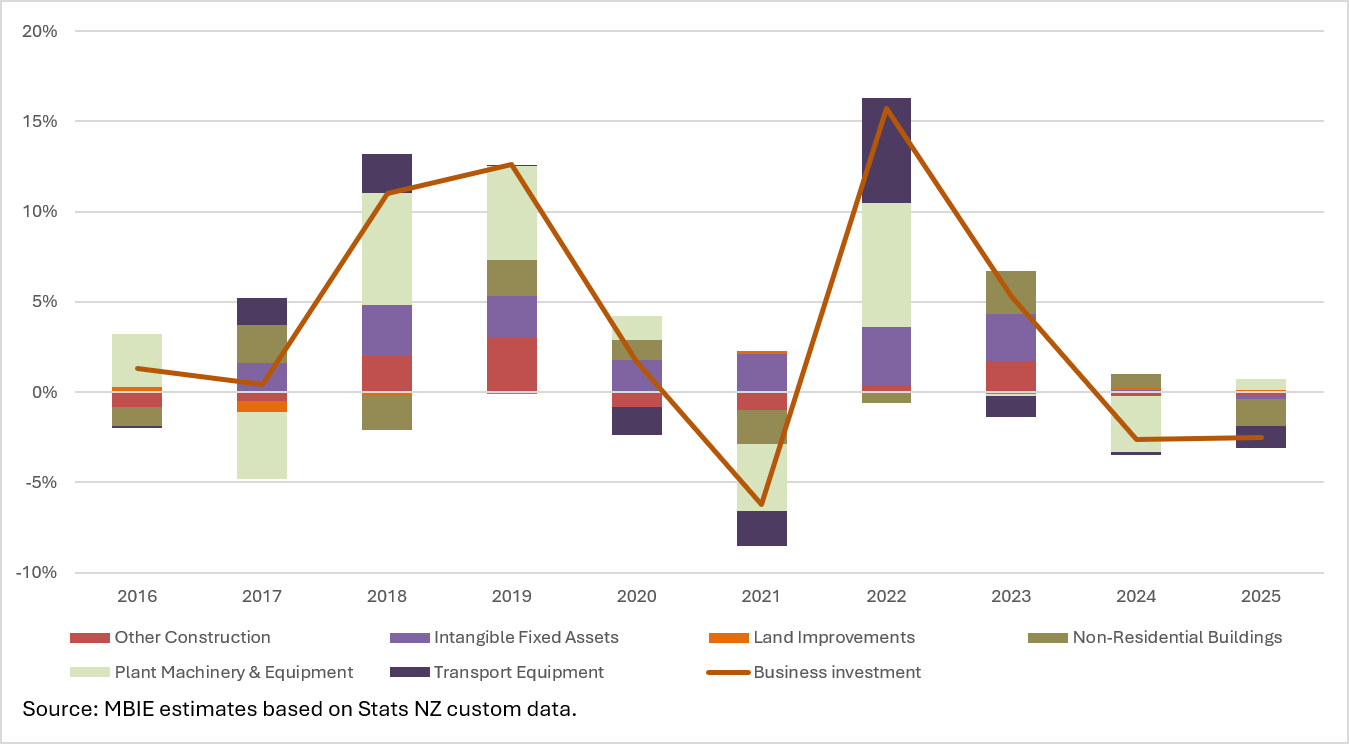
Text description for graph
In the March 2025 year, the asset picture was mixed:
- Plant machinery and equipment increased by 1.9% compared with 2024, contributing an estimated 0.6 percentage points to business investment growth.
- Land improvements rose 3.6%, but as a small share of business investment, they made a much smaller overall contribution of 0.1 percentage points to growth.
These gains in business investment growth were offset by declines in other asset classes:
- Non-residential buildings (including offices, factories, and other business premises) represented the largest drag on business investment, reducing growth by 1.5 percentage points after two years of increases.
- Transport equipment fell 9.9%, subtracting approximately 1.2 percentage points from growth.
- Intangible fixed assets and other construction each reduced growth by 0.2 percentage points.
Recent softening has been smaller for business investment than for whole-of-economy investment.
Business investment decreased by 2.5% in the March 2025 year, following a fall of 2.6% in 2024. New Zealand’s total investment GFCF fell by 5.0% in the March 2025 year, following a 1.1% decrease in 2024.
Despite recent softness, business investment in the March 2025 year was 15.7% higher than its 2021 post-COVID level, compared to a 6.0% increase in total investment. This suggests business investment has been relatively more resilient, while the sharper decline in total investment reflects greater weakness in other components, such as government investment, and in particular residential dwelling investment.
New Zealand total investment and business investment, chained volume measure, 1988-2025
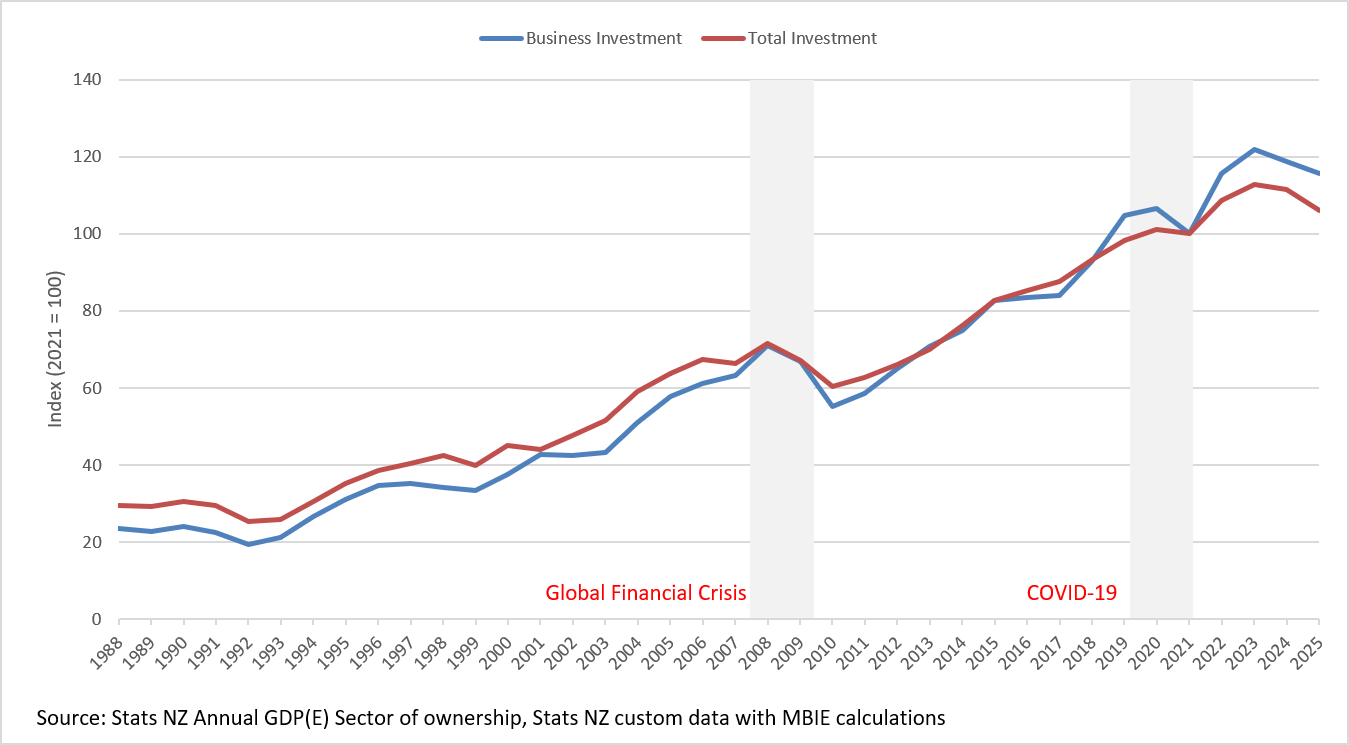
Text description for graph
How business investment is measured
All investment figures are based on values in New Zealand dollars (NZD) expressed as chained volume measures (CVM), in constant 2009/10 prices.
Business investment is a non-standard sector category defined by the United Kingdom’s Office for National Statistics as private investment excluding dwellings. This approach to business investment is adopted for this report using a custom dataset provided by Stats NZ as data on GFCF by asset and sector are not currently published at this level of detail. This series is expected to be subject to revision.