March 2025 summary
On this page I tēnei whārangi
This is the web version of the New Zealand Energy Quarterly March 2025 Summary.
Download the PDF and word versions:
New Zealand Energy Quarterly March 2025 summary [PDF, 677 KB]
New Zealand Energy Quarterly March 2025 summary [DOCX, 4.2 MB]
Geo and solar generation help pick up slack as hydro and wind drop this quarter
The March 2025 quarter saw below average hydro inflows, with Transpower indicating inflows in January and February were the lowest on record for these months. At 4,960 GWh, hydro generation was down 15.1% on March quarter 2024. This was lowest quarterly hydro generation since the June 2012 quarter, and the lowest March quarter generation since 1987. There was a similar downturn in wind generation, falling 21.1 % from March quarter 2024 to 726 GWh. Coal and gas fired generation increased 54.4% and 1% respectively to compensate.
Despite poor hydro and wind, renewable share of generation was 83.2% this quarter, compared to the 64.7% share in June 2012. Geothermal generation picked up some of the slack, with 2,376 GWh of generation this March quarter. This was a 20.4% increase on March 2024, driven largely by new geothermal capacity coming online last year. Solar generation also continued its climb, with 244 GWh of generation this quarter, a 60.7% increase on March 2024. A new solar farm, Te Herenga o Te Rā, contributed to this increase, the first solar farm directly connected to the national grid.
Total electricity consumption for the quarter was 9,250 GWh, a 3.1 % decrease from March quarter 2024. Electricity consumption from Agriculture, Forestry and Fishing fell 15.4 %, Commercial fell 2.0%, Industrial fell 2.3%, and Residential stayed steady with a 0.8 % decline.
Residential electricity costs, for the year ending March 2025, increased slightly by 1.5% (.52 c/kwh) on the previous year, when adjusted for inflation. Natural gas costs, however, saw rises across all sectors this March quarter compared to the previous March quarter. After adjusting for inflation, Residential was up 18.5%, Commercial up 20.5%, Industrial up 14.9%, and Wholesale up 12.8%. Petrol and diesel prices, however, decreased 5.1% and 9.8% respectively compared to March 2024. This can be attributed to crude oil prices falling and the removal of the Auckland Regional Fuel tax in June.
Fuel imports and domestic consumption both decreased by 1% on March 2024. Jet fuel use (for domestic and international transport) was down 3%, mainly due to a drop in international transport (down 4%). Net gas production was down 19%, with negative stock change indicating withdrawals from Ahuroa gas storage to meet demand. With Methanex still ramping up production there was modest growth in chemical sector use from December 2024 quarter. Compared to the March quarter 2024, overall gas non-energy use was still down 33%, and energy end use down 12%, driven almost entirely by a drop in chemical sector energy end use.
With the Stockton railway open, coal exports were up 97% on the previous quarter and 23% on March 2024. Following Genesis’ stockpile increase, imports were down 71% on the previous quarter. Overall non-electricity coal consumption continued its long-term decline, down 28% on March 2024, again mainly due to less coal use by the Dairy Products sector.
Read more information on energy use in New Zealand
Summary charts
Generation from hydro and geothermal
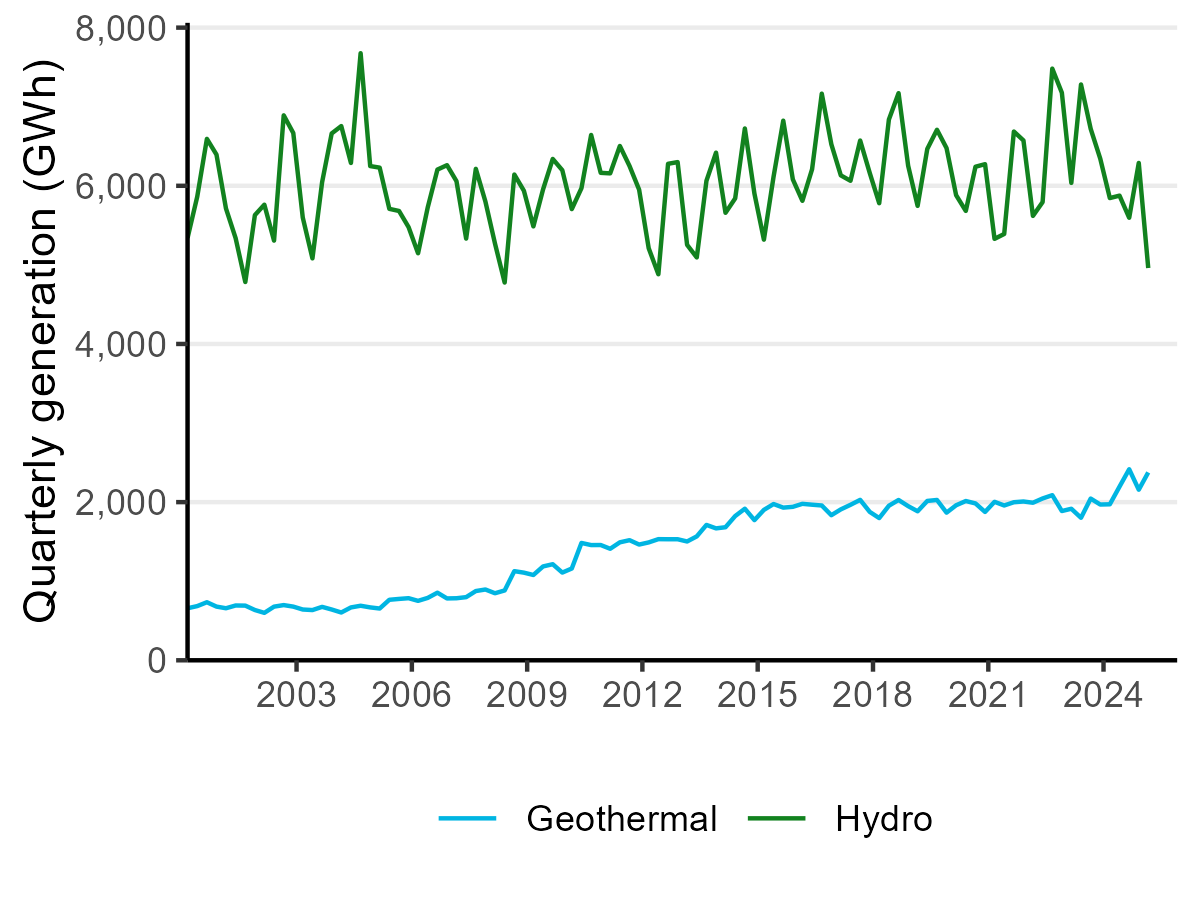
Text description - Generation from hydro and geothermal
Generation from solar, and wind
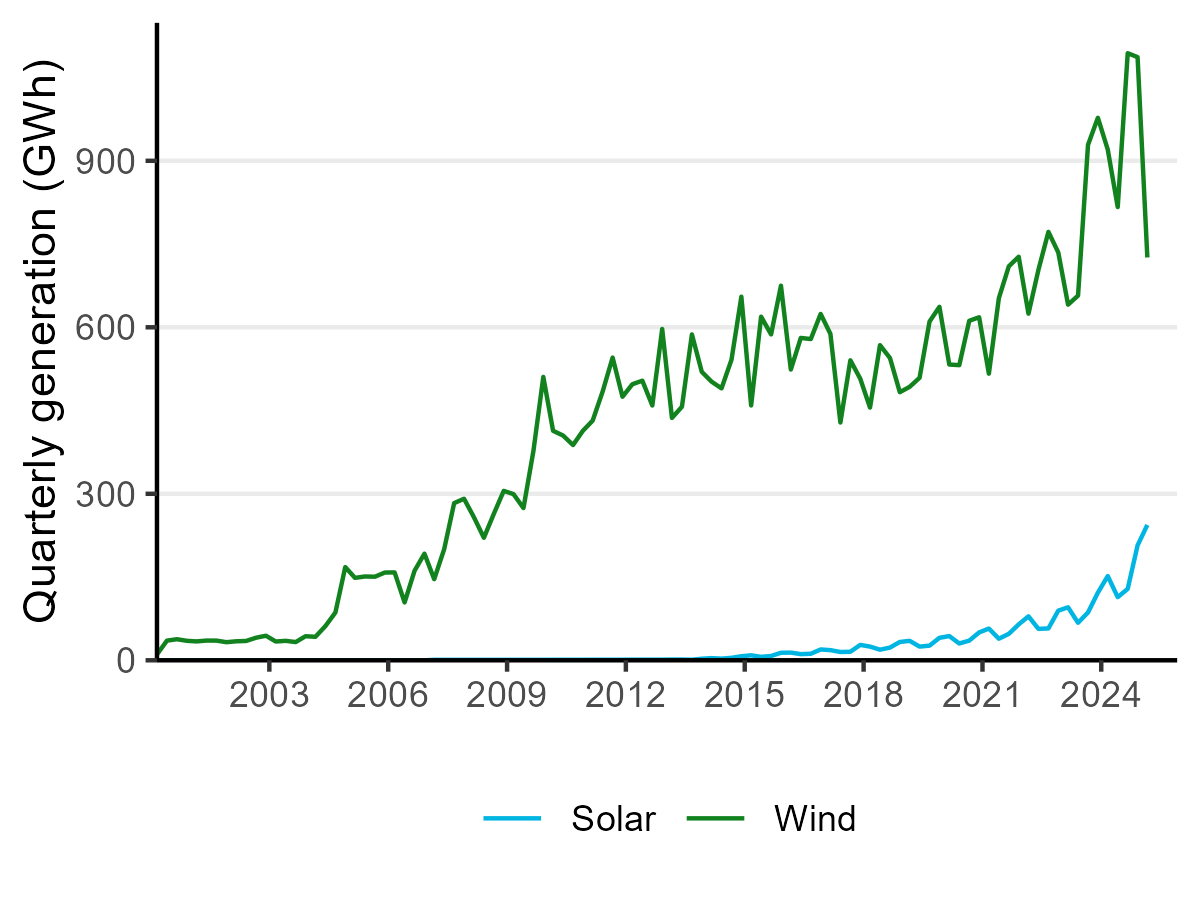
Text description - Generation from solar, and wind
Generation from coal and gas
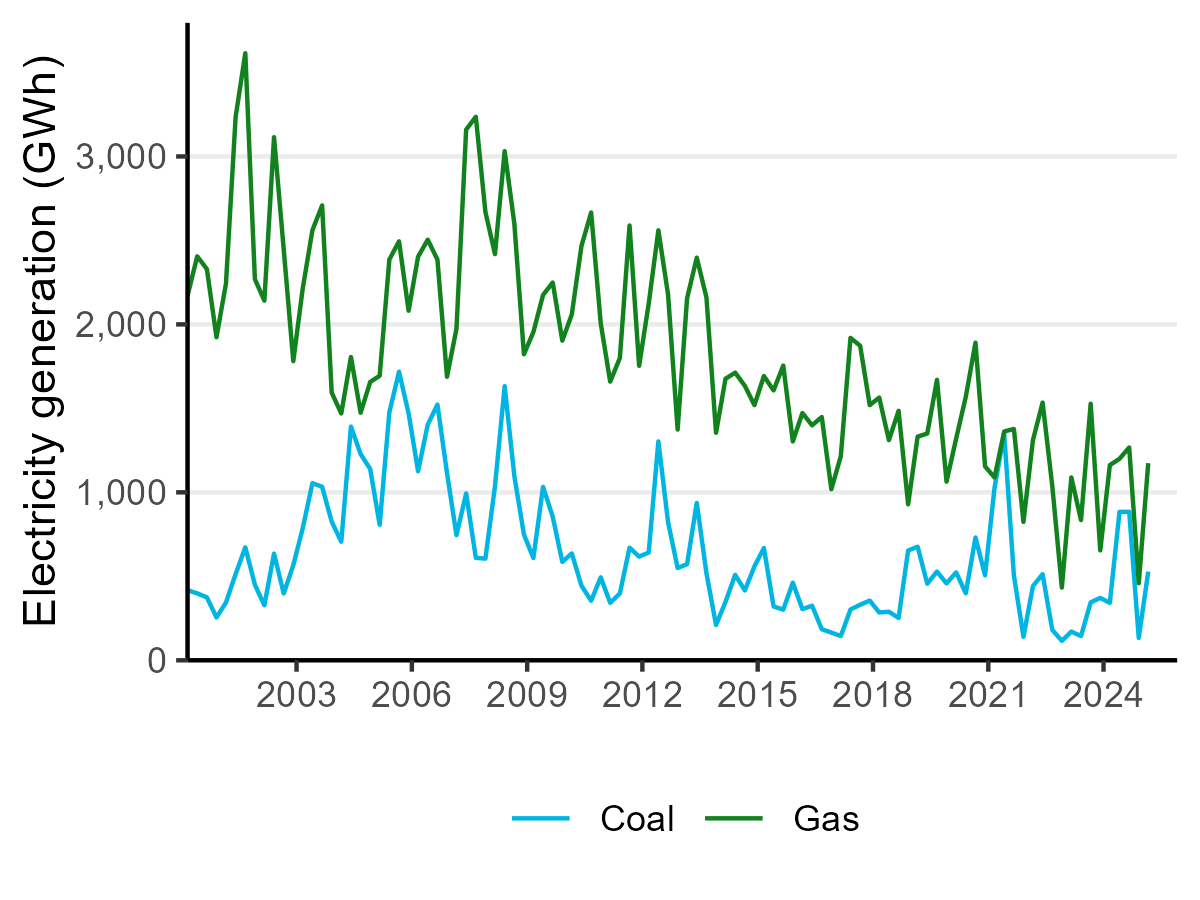
Text description - Generation from coal and gas
Non-electricity consumption of gas and coal

Text description - Non-electricity consumption of gas and coal
Natural gas prices

Text description - Natural gas prices
Coal exports and imports
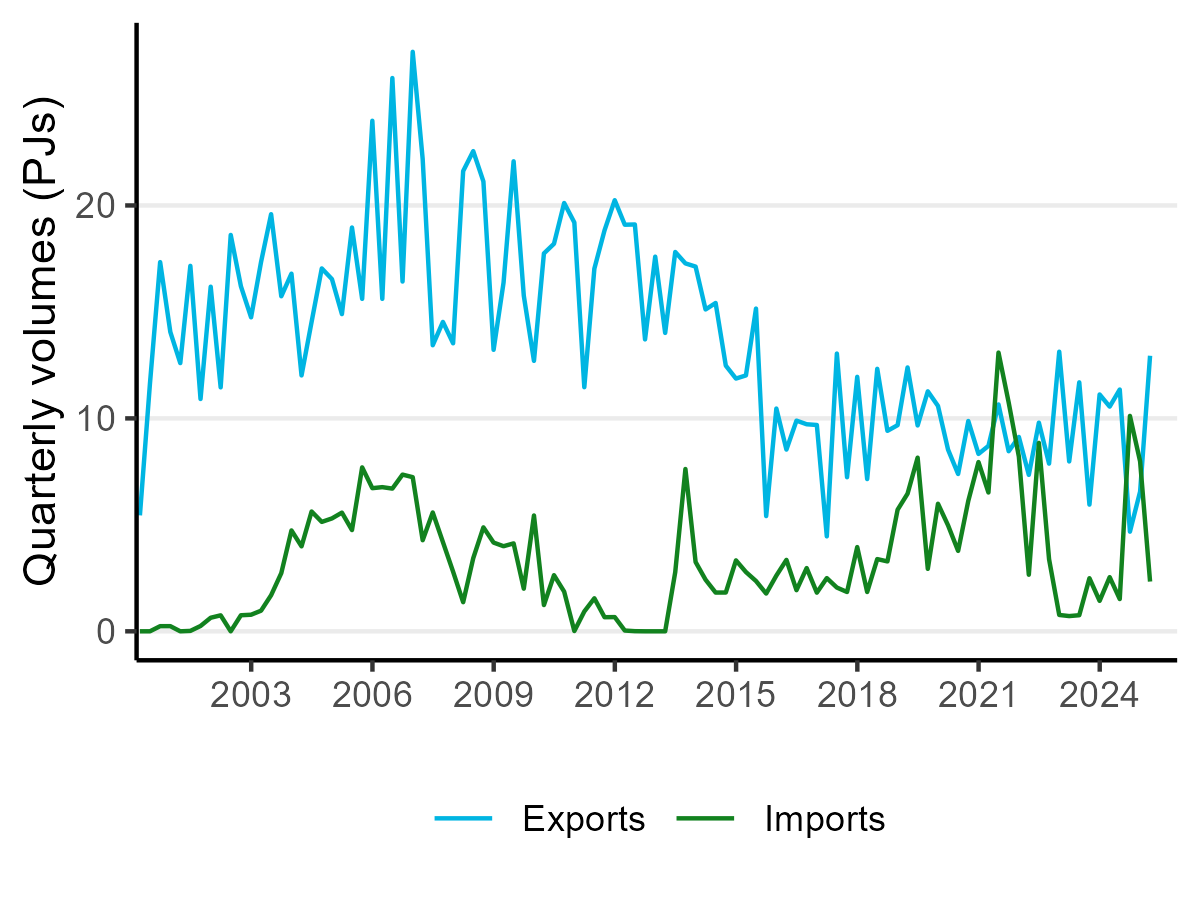
Text description - Coal exports and imports