December 2025 summary
On this page I tēnei whārangi
This is the web version of the New Zealand Energy Quarterly December 2025 summary.
Download the PDF and word versions:
New Zealand Energy Quarterly December summary [PDF, 682 KB]
New Zealand Energy Quarterly December summary [DOCX, 5.5 MB]
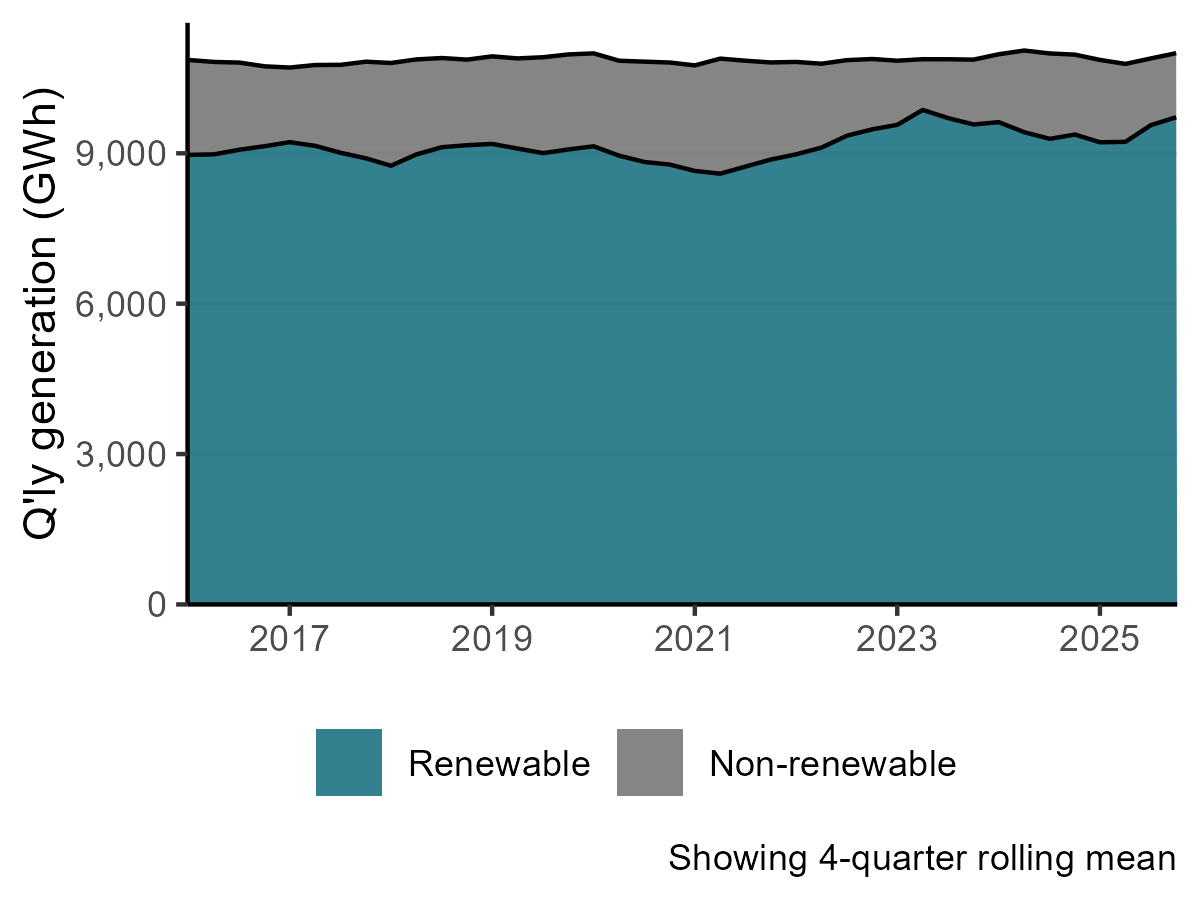
Record high share of electricity generation from renewables
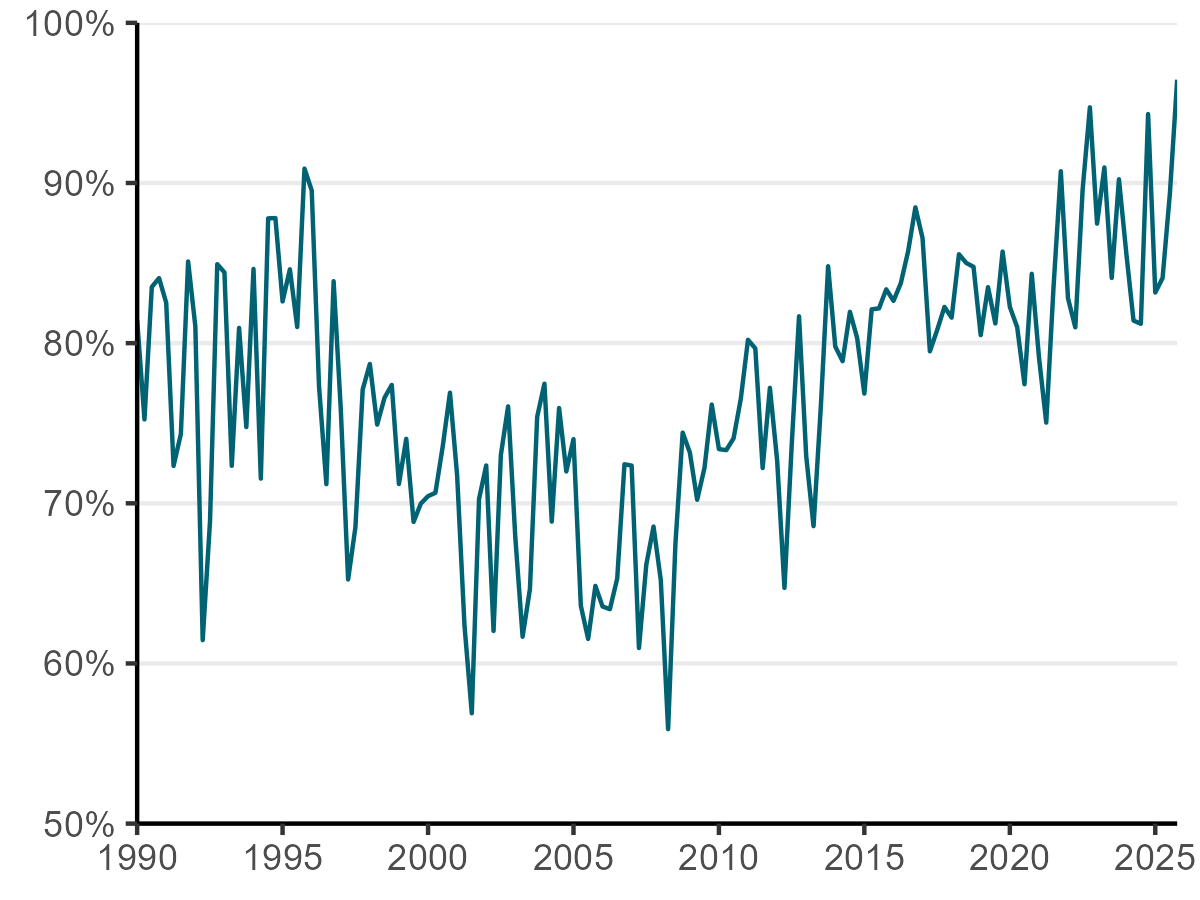
The December 2025 quarter delivered a record high share of renewable electricity generation at 96.4%, up 2.1 percentage points on the December 2024 quarter.
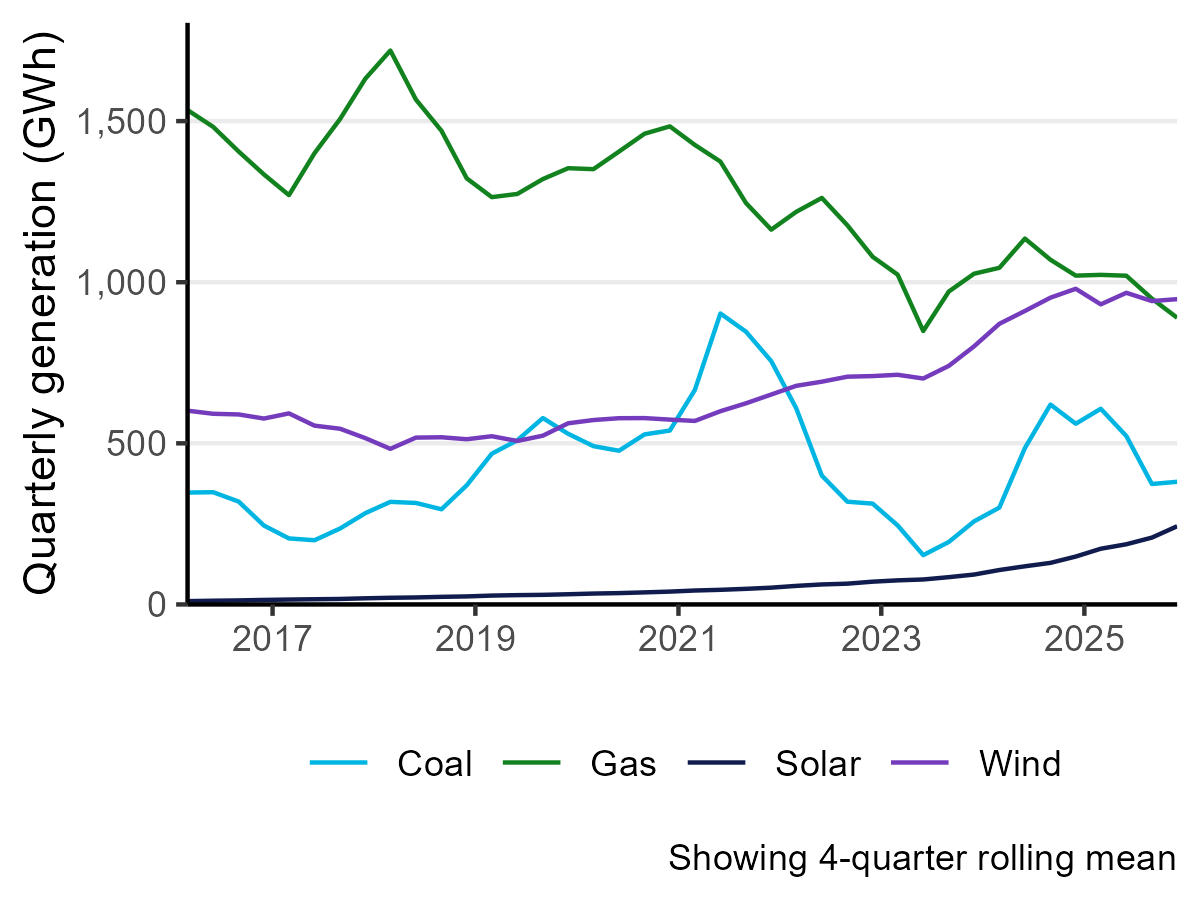
Driving this was strong hydro output and increases in solar capacity over the past year. Hydro generation increased by 498 GWh (up 8.0%) on the previous December quarter to 6,758 GWh due to favourable hydro conditions from strong inflows. Solar generation also increased by 141 GWh (up 70.4%) to 341 GWh, delivered by new utility-scale solar capacity commissioned over the past year contributing to this.
This increase in hydro and solar renewable generation reduced the need for electricity generation from non-renewable sources. Huntly Unit 5 was offline for the full December 2025 quarter to undertake planned maintenance and to free up gas for other users in the market. Overall, electricity from natural gas decreased by 238 GWh (down 52.0%) on the December 2024 quarter to 219 GWh, its lowest quarterly level since the March 1980 quarter.
Despite a 20.6% increase in electricity generation from coal, due to higher output from cogeneration plants (which is the process of producing electricity and useful heat together at the same time, typically at sites that generate energy for their own operations), the overall level of electricity generation from non-renewable sources was down 35.6% on the previous December quarter.
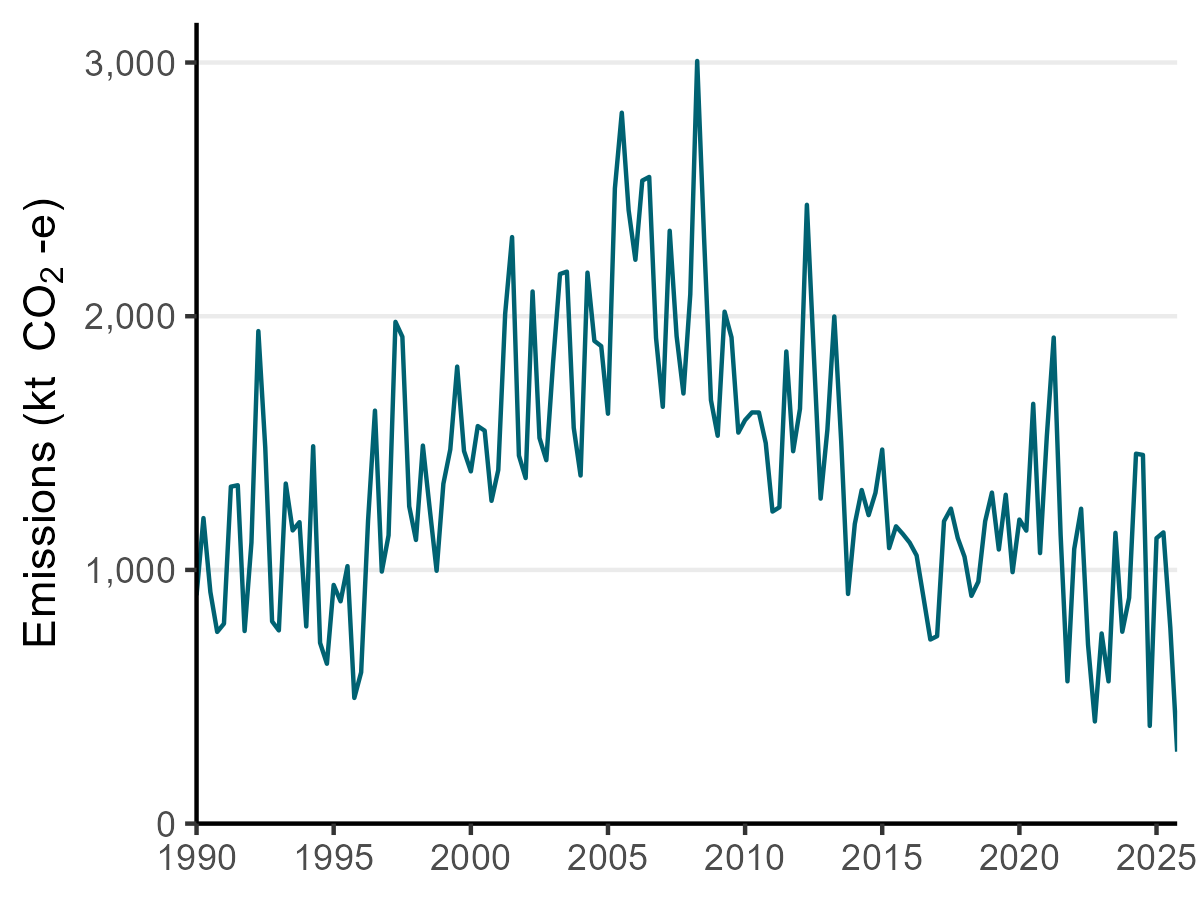
With record high electricity generation from renewables, quarterly emissions from electricity generation fell to their lowest level on record to 284 kilotonnes of carbon dioxide equivalent (kt CO2-e).
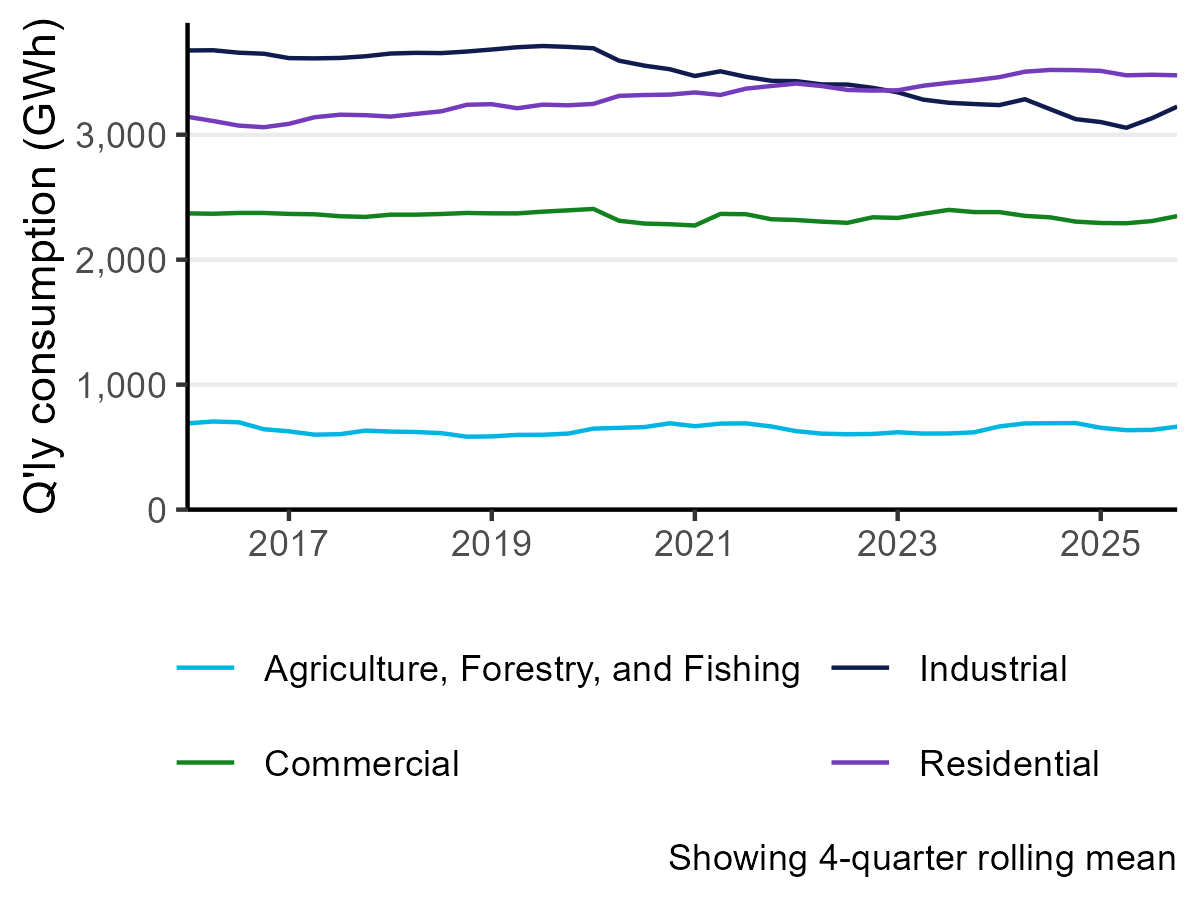
National electricity consumption increased by 616 GWh (up 6.5%) on the previous December quarter to 10,045 GWh. Use in the agricultural sector increased 14.2% over this period due to increased irrigation load, while use in the industrial sector increased by 12.2%. Industrial electricity demand in the December 2024 quarter was relatively low as New Zealand Aluminium Smelters following its demand response agreement being called on in winter 2024.
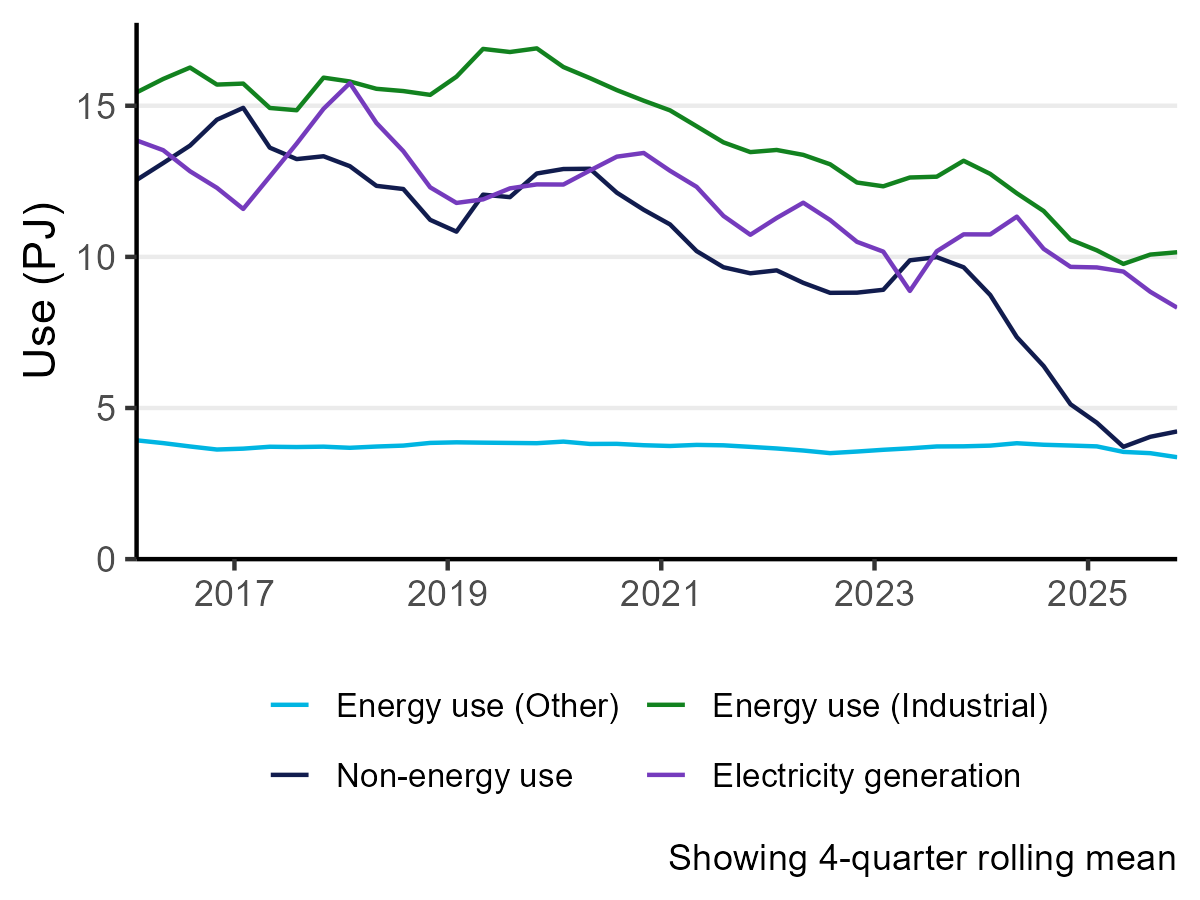
Industrial gas consumption increased by 0.31 PJ (up 2.8%) on the December 2024 quarter to 11.23 PJ, with most of this increase coming from higher use in the chemicals subsector. This subsector includes gas use by Methanex, who increased their activity on previous December quarter. Methanex had idled their production facilities in 2024 (from mid-August to the end of October) to free up gas for electricity generation leading to relatively low gas use in the chemicals subsector in the December 2024 quarter.
Overall, natural gas consumption fell 1.7% on the previous December quarter as decreases in commercial (down 22%) and residential (down 9%) use offset the increase in industrial use.
Summary charts
Renewable versus non-renewable electricity
Text description of chart - Renewable versus non-renewable electricity
Proportion of electricity from renewable sources
Text description of chart - Proportion of electricity from renewable
Electricity from solar, wind, coal, and gas
Text description of chart - Electricity from solar, wind, coal, and gas
Greenhouse gas emissions from electricity generation
Text description of chart - Greenhouse gas emissions from electricity generation
Electricity consumption by sector
Text description of chart - Electricity consumption by sector
Gas demand by sector
Text description of chart - Gas demand by sector