Delivering services to people and business
People across MBIE deliver and support a number of services that touch on the daily lives of New Zealanders. From supporting safe and warm homes through tenancy services, connecting New Zealand to the world through our immigration system, and helping businesses to succeed, our diverse and widespread services help Grow Aotearoa New Zealand for All.
On this page
I tēnei whārangi
Our people by function
Text description of Our people by function graph
Our people by function
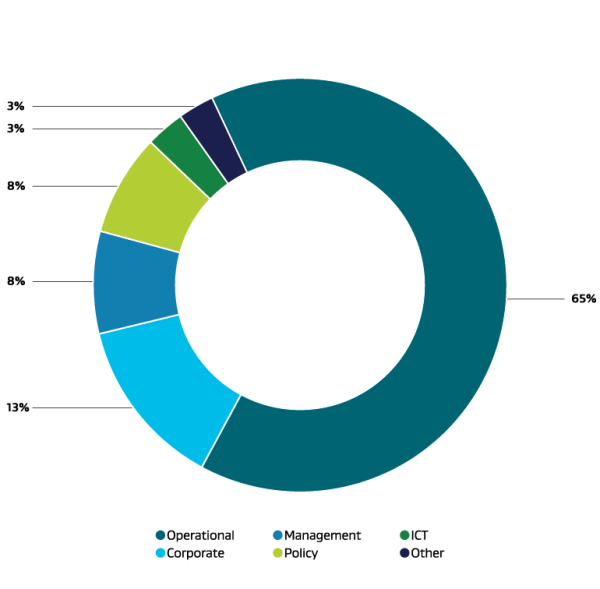
A donut graph depicting the proportion of our people working in various functions, including service delivery.
- 65% Operational
- 13% Corporate
- 8% Management
- 8% policy
- 3% ICT
- 3% Other
Service centre
Services we provide:
In addition to information online and via email, many people call us seeking information, including:
- how to grow and digitise their business
- immigration processes
- lodging complaints because their rights as tenants, consumers, workers, etc, have not been upheld.
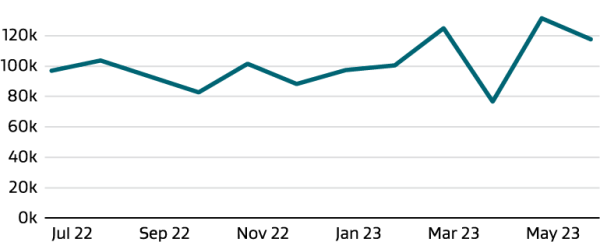
We have people based across the country managing over 50 different help lines. This year, we processed over 1.18 million averaging over 98,000 calls per month.
Calls to service centre lines
Text description of Calls to service centre lines graph
Calls to service centre lines
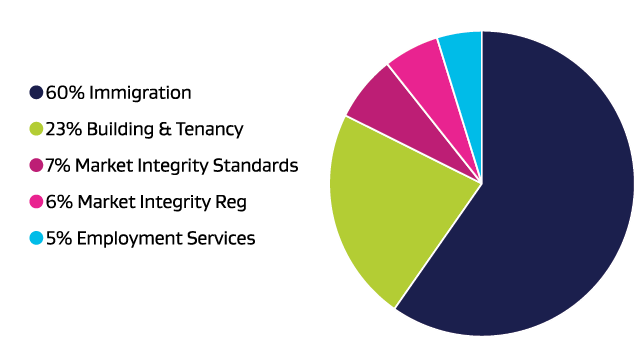
Pie chart depicting the types of calls to service centre lines in 2022-23.
- 60% Immigration
- 23% Building and Tenancy
- 7% Market Integrity Standards
- 6% Market Integrity Reg
- 5% Employment Services
Volume of calls through service centres
Text description of Volume of calls through service centres graph
Line graph depicting the volume of calls through our service centre in 2022-23.
1.18 million calls processed - averaging around 98,175 calls per month.
| Month |
Volume of calls |
| July 2022 |
94,535 |
| August 2022 |
100,317 |
| September 2022 |
91,303 |
| October 2022 |
82,372 |
| November 2022 |
98,424 |
| December 2022 |
87,081 |
| January 2023 |
94,853 |
| February 2023 |
97,487 |
| March 2023 |
118,397 |
| April 2023 |
77,164 |
| May 2023 |
123,997 |
| June 2023 |
112,170 |
Immigration
Services we provide:
- Connecting people and enabling visitors to enter New Zealand
- Attracting international talent and investment
- Protecting our border
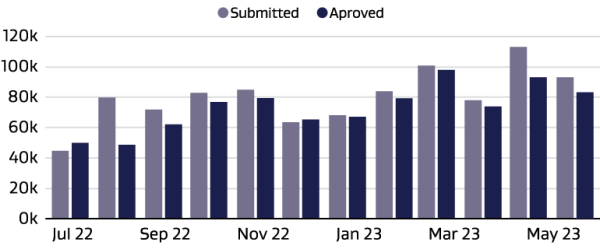
We approved 875,000 visa applications and allowed 1,065,000 people entry to the country, connecting New Zealand to the world.
Visa applications submitted and approved
Text description of Visa applications submitted and approved graph
Bar graph comparing number of visa applications submitted and approved in 2022-23.
| Reporting month |
Submitted applications |
Approved applications |
| July 2022 |
44,539 |
49,857 |
| August 2022 |
79,671 |
48,584 |
| September 2022 |
71,695 |
62,025 |
| October 2022 |
82,744 |
76,772 |
| November 2022 |
84,735 |
79,231 |
| December 2022 |
63,426 |
65,196 |
| January 2023 |
67,994 |
66,977 |
| February 2023 |
83,765 |
79,188 |
| March 2023 |
100,652 |
97,855 |
| April 2023 |
77,877 |
73,800 |
| May 2023 |
112,937 |
92,973 |
| June 2023 |
92,952 |
83,076 |
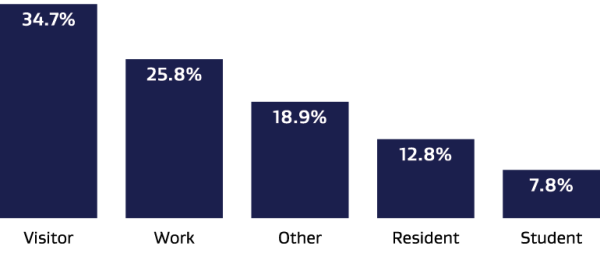
Visa approvals by category
Text description of Visa approvals by category graph
Bar graph depicting visa approvals by category in 2022-23.
| Category |
Approvals 2022/23 |
| Visitor |
35% |
| Work |
26% |
| Other |
19% |
| Resident |
13% |
| Student |
8% |
Building and tenancy
Services we provide:
- Bond receipt and refunds
- Tenancy and weathertight mediation
- Investigating breaches of Residential Tenancies Act and Building Act
- Building Code determinations
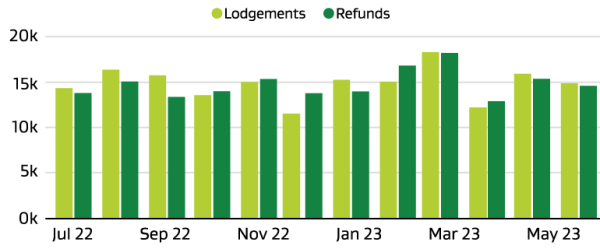
We lodged and held bonds for 178,000+ NZ households and investigated and resolved 3,000+ tenancy cases, ensuring safe and warm houses.
Bond refunds and lodgements
Text description of Bond refunds and lodgements graph
Bar graph comparing bond refunds and bond lodgements in 2022-23.
We lodged and held bonds for 178,000+ NZ households and investigated and resolved 3,000+ tenancy cases, ensuring safe and warm houses.
| Month |
Total lodgements |
Total refunds |
| June 2023 |
14,873 |
14,598 |
| May 2023 |
15,933 |
15,386 |
| April 2023 |
12,215 |
12,898 |
| March 2023 |
18,331 |
18,253 |
| February 2023 |
15,057 |
16,837 |
| January 2023 |
15,262 |
13,978 |
| December 2022 |
11,517 |
13,792 |
| November 2022 |
15,028 |
15,350 |
| October 2022 |
13,557 |
13,997 |
| September 2022 |
15,755 |
13,383 |
| August 2022 |
16,380 |
15,077 |
| July 2022 |
14,336 |
13,800 |
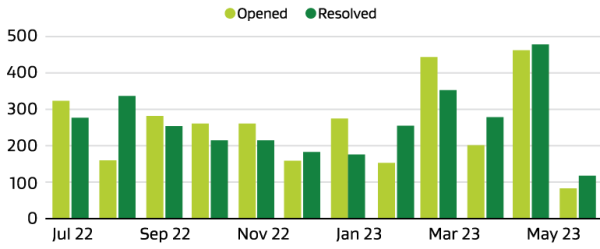
Tenancy compliance and investigation cases
Text description of Tenancy compliance and investigation cases graph
Bar graph comparing tenancy compliances and investigation cases that are opened and resolved in 2022-23.
We investigated and resolved 3,000+ tenancy cases, ensuring safe and warm houses.
| Month |
Opened |
Resolved |
| July 2022 |
324 |
277 |
| August 2022 |
160 |
337 |
| September 2022 |
282 |
254 |
| October 2022 |
261 |
215 |
| November 2022 |
261 |
215 |
| December 2022 |
159 |
183 |
| Janurary 2023 |
275 |
176 |
| February 2023 |
153 |
255 |
| March 2023 |
444 |
353 |
| April 2023 |
202 |
279 |
| May 2023 |
463 |
479 |
| Jun 2023 |
83 |
118 |
Market integrity
Services we provide:
- Business registration
- Licensing practitioners, including Building, Electrical, Immigration, Auctioneers, Motor Vehicle Traders
- Radio spectrum, telecommunications infrastructure
- Trading standards
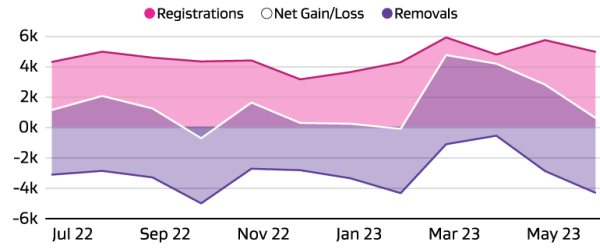
We registered 55,000 companies and relicensed 24,000 Building Practitioners and over 11,000 Electrical Workers this year to support a dynamic business environment and enable a fair market for consumers.
Companies forming and ceasing
Text description of Companies forming and ceasing graph
Graph depicting number of companies forming and ceasing in 2022-23.
| Month |
Registrations |
Removals |
Net gain/loss |
| July |
4,308 |
-3,025 |
1,101 |
| August |
4,988 |
-2,952 |
2,036 |
| September |
4,591 |
-3,387 |
1,204 |
| October |
4,338 |
-5,115 |
777 |
| November |
4,405 |
-2,806 |
1,599 |
| December |
3,147 |
-2,906 |
241 |
| January |
3,631 |
-3,446 |
185 |
| February |
4,286 |
-4,435 |
149 |
| March |
5,936 |
-1,175 |
4,761 |
| April |
4,797 |
-609 |
4,188 |
| May |
5,759 |
-2,967 |
2,792 |
| June |
4,984 |
-4,409 |
575 |
Relicensing of Building Practitioners and Electrical Workers
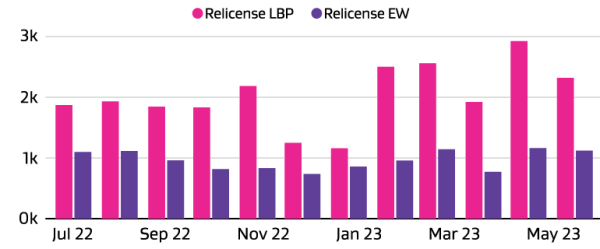
Text description for Relicensing of Building Practitioners and Electrical Workers graph
Bar graph comparing relicensing of Building Practitioners and Electrical Workers in 2022-23.
We relicensed 24,000 Building Practitioners and over 11,000 Electrical Workers this year.
| Month |
Relicense numbers Building Practitioners |
Relicense numbers Electrical Workers |
| July 2022 |
1860 |
1093 |
| August 2022 |
1921 |
1106 |
| September 2022 |
1836 |
955 |
| October 2022 |
1822 |
811 |
| November 2022 |
2173 |
827 |
| December 2022 |
1240 |
731 |
| January 2023 |
1153 |
853 |
| February 2023 |
2490 |
950 |
| March 2023 |
2548 |
1135 |
| April 2023 |
1910 |
765 |
| May 2023 |
2910 |
1156 |
| June 2023 |
2306 |
1115 |
| Total |
24,169 |
11,497 |
Employment
Services we provide:
- Employment rights and standards
- Annual leave, maternity leave rights
- Employment relations and dispute resolution
- Prevent migrant exploitation
We led 4,100+ employment mediations and 3,100+ labour complaint interventions, ensuring good jobs and safe workplaces.
Mediation events delivered
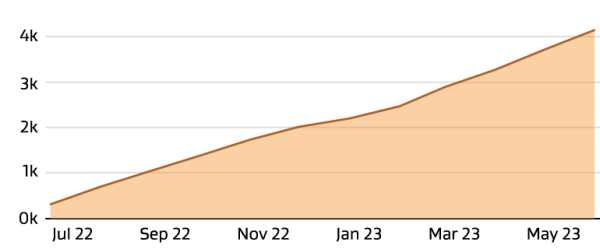
Text description of Mediation events delivered graph
Line graph depicting the number of employment mediation events delivered in 2022-23.
| Month |
Number of mediations delivered |
| July 2022 |
313 |
| August 2022 |
701 |
| September 2022 |
1,047 |
| October 2022 |
1,379 |
| November 2022 |
1,729 |
| December 2022 |
2,010 |
| January 2023 |
2,192 |
| February 2023 |
2,460 |
| March 2023 |
2,882 |
| April 2023 |
3,261 |
| May 2023 |
3,697 |
| June 2023 |
4,128 |
Labour inspectorate interventions completed
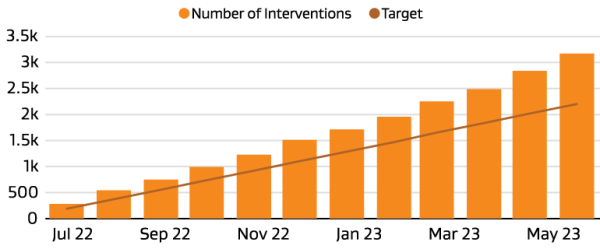
Text description of Labour inspectorate interventions completed graph
Line graph depicting number of labour inspectorate interventions completed in 2022-23.
| Month |
Number of interventions |
Target |
| July 2022 |
276 |
183 |
| August 2022 |
538 |
366 |
| September 2022 |
745 |
550 |
| October 2022 |
986 |
733 |
| November 2022 |
1,224 |
916 |
| December 2022 |
1,509 |
1,100 |
| January 2023 |
1,711 |
1,283 |
| February 2023 |
1,952 |
1,466 |
| March 2023 |
2,248 |
1,650 |
| April 2023 |
2,487 |
1,833 |
| May 2023 |
2,838 |
2,016 |
| June 2023 |
3,172 |
2,200 |
Business and consumer
Services we provide:
- Information and tools to business and consumers
- Digital products and learning
- Small business support
- Protecting intellectual property
We supported 60,000+ businesses through the Digital Boost programme, and lifting their digital capability and supporting businesses to succeed. We registered over 330,000+ trade marks to protect intellectual property.
Digital Boost registrations (cumulative)
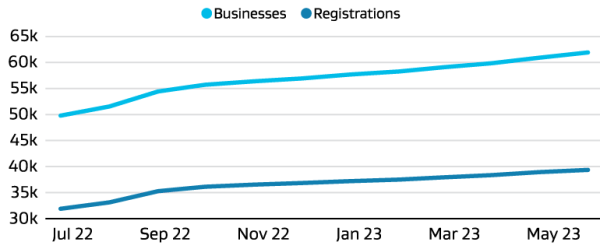
Text description for Digital Boost registrations graph
Line graph depicting number of cumulative Digital Boost registrations. Shows a gradual increase of registrations from July 2022 to June 2023.
| Month |
Registrations (cumulative) |
Businesses (cumulative) |
| July 2022 |
49,575 |
31,418 |
| August 2022 |
51,360 |
32,665 |
| September 2022 |
54,292 |
34,851 |
| October 2022 |
55,599 |
35,716 |
| November 2022 |
56,269 |
36,122 |
| December 2022 |
56,817 |
36,438 |
| January 2023 |
57,590 |
36,803 |
| February 2023 |
58,183 |
37,106 |
| March 2023 |
58,999 |
37,538 |
| April 2023 |
59,792 |
37,978 |
| May 2023 |
60,860 |
38,561 |
| June 2023 |
61,889 |
38,991 |
| Grand total |
681,225 |
434,187 |
New trademark applications
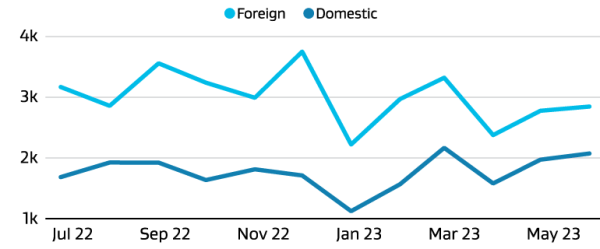
Text description of New trademark applications graph
Line graph comparing the number of new foreign and domestic trademark applications in 2022-23.
| Month |
Foreign trade mark class |
NZ trade mark class |
| July |
3,162 |
1,668 |
| August |
2,850 |
1,910 |
| September |
3,555 |
1,908 |
| October |
3,234 |
1,619 |
| November |
2,984 |
1,797 |
| December |
3,749 |
1,695 |
| January |
2,209 |
1,103 |
| February |
2,962 |
1,549 |
| March |
3,316 |
2,153 |
| April |
2,365 |
1,563 |
| May |
2,768 |
1,957 |
| June |
2,838 |
2,059 |


