2012–2018 international tourism forecasts
International Tourism Forecasts for the 2012–2018 period.
On this page
Forecasts
The forecasts suggest that the long-term outlook is positive.
New Zealand’s tourism sector outlook: Forecasts for 2012-2018 [PDF, 938 KB]
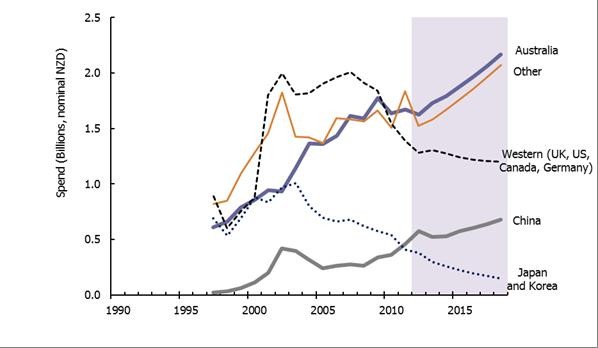
Figure 1: Actual and forecast tourism expenditure in New Zealand
New Zealand’s tourism sector outlook was produced for us by the New Zealand Institute of Economic Research (NZIER).
Pivot table
The 2012–2018 forecast pivot table allows flexible access to the data, with the ability to choose and compare market countries and variables of interest such as arrivals and spend.
New Zealand’s tourism sector outlook: Forecasts for 2012-2018, pivot table [XLSX, 109 KB]
Online database
NZIER has provided access to an online data-visualisation tool for exploring the tourism forecasts.
NZIER website — Tourism forecasts 2012-2018(external link)
Commentary
The forecasts predict solid growth but a structural shift in tourism. They predict that:
- Tourism is set to recover from its current slowdown, due to the continuing strength of Australia and a growing Chinese market.
- International visitor spending will grow 9% by December 2018, recovering from a sharp slowdown brought on by the global financial crisis. Visitor numbers are expected to rise by 28% in the same period.
- The average spend per day will remain steady, but the length of stay will trend downwards due to shorter trips from Australian and Asian visitors.
Tourism forecast methodology
We commissioned NZIER to prepare forecasts using a best-practice tourism forecasting model, combining macro-economic and socio-demographic data and expert judgment.
The resulting econometric model is providing forecasts for New Zealand’s 8 key markets — Australia, China, UK, US, Japan, Germany, Canada, and Korea — plus ‘others’ for the calendar years 2012–2018.
For each country, ‘others’, and for all markets combined, the model generates annual forecasts for:
- total visitor arrivals
- total visitor nights
- total visitor expenditure
- average length of stay per visitor
- average spend per day per visitor
- visitor mix by purpose of visit — namely, holiday, visit friends and family, business (including convention/conference), and other (including education).
2 scenarios were developed to test the effect of unexpected events on the forecasts, and 80% confidence intervals were calculated for visitor arrivals as a means of showing the risks to the baseline forecasts.
Technical report
A technical report detailing the development of the 27 models used to generate the forecasts is available.
Tourism forecasts 2012-2018 — Technical Report November 2012 [PDF, 395 KB]
Data
An appendix to the technical report contains a list of the input data for each country model. The data is accessible through pivot tables in an Excel workbook (see above).