Wāhaka tuawhā: He rarauka kōrero, tātari me kā whakakiteka | Chapter 4: Regional workforce data, analysis and insights
On this page
Kā pūnaha kahuru matua | Key labour market metrics
While looking to learn and develop, the Otago RSLG has continued our core work of monitoring and analysing regional labour market metrics.
What we can see through these metrics is that Otago is rebounding from Covid-19. While signs point to a turning tide, historically low unemployment levels over the past year have seen labour and skill shortages continue across all Otago’s sectors and sub-regions. While this remains a critical issue, economic predictions for many of our most important sectors have improved as New Zealand reconnects with the world. The opportunities ahead are encouraging.
Key insights include:
- For the March 2023 quarter, unemployment in Otago remains at 3.4%[1], equal to the national rate.
- The seasonally adjusted labour force participation rate for women in Otago increased to 67.7% – the highest rate since the series began in 1986.[2]
- Regional underutilisation is at 9.3% (March 2023 quarter), compared to 9.0% nationally.[3] Income (mean annual earnings)[4] in Otago continues to sit slightly below national averages.
- Otago’s population is growing.[5] During the Covid-19 pandemic, we saw strong internal migration to the region (inland Otago in particular), and international migrant numbers are now rebounding post-pandemic.
The RSLG is looking forward to working with mana whenua, actors in the Māori labour market and utilising other data sources available to us so that we can gain a better understanding of Māori participation across the regional labour market in the coming year.
Te matapae mahi mō kā nonoi kaiuaua ki ōtākou | Otago’s forecasted workforce demand pressures
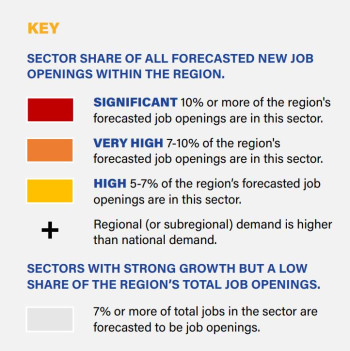
The table below is a broad indicator of how workforce demand is forecasted to be distributed across Otago’s industries in the future. It takes a forecasted approach, looking at years 2025 to 2028, and takes into account anticipated job openings created through growth, and through people leaving the workforce (e.g. retirement).
It is important to acknowledge the diversity across Otago’s sub-regions. Sub-regional industry structures vary, especially when there is an urban and rural distinction. Therefore, it is important to consider sub-regional workforce demand needs alongside the Otago Region as a whole.
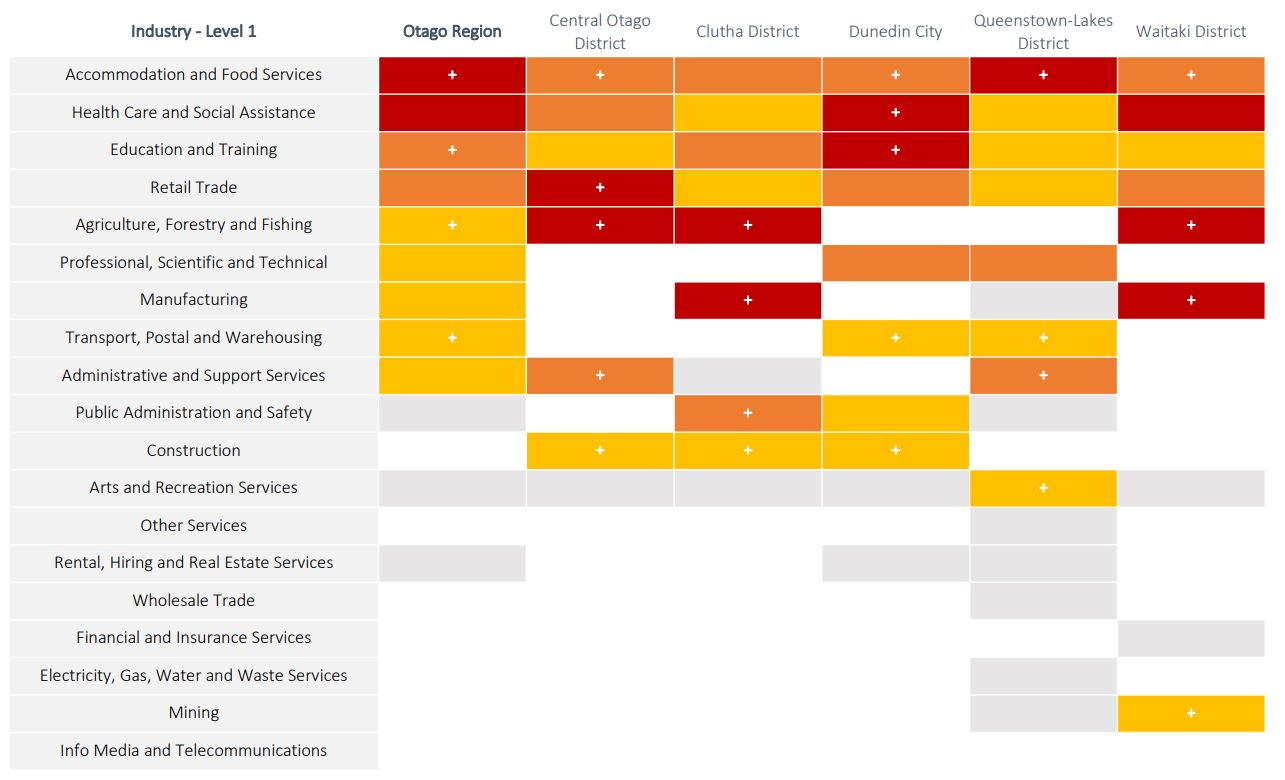
Text description
Sector snapshots
The RSLG is committed to providing an up-to-date, regionally-led assessment of Otago’s key sectors. In this Regional Workforce Plan (RWP) Update, we revisit the Construction, Accommodation & Food Services, Healthcare & Social Assistance and Food & Fibre sectors that were analysed in the 2022 RWP.
The data that has been used in this section is from Infometrics’ Sector Data tool. This tool uses a variety of sources such as the Household Labour Force Survey (HLFS), Linked Employer Employee Data (LEED) and Census data from Statistics New Zealand.
Waahi noho me kā ratoka kai | Accommodation and Food Services
- There are 12,241 jobs in Accommodation & Food Services in Otago, a slight decline from 12,358. This represented a 9.3% share of all employment in the region.
- There was $2.8 billion spent by visitors to Otago in the last year. While this was still significantly down from the $4.0 billion spent by visitors in the March 2020 year before the pandemic, it is up from the $2.7 billion spent in 2021.
- Of a total of 12,241 jobs, around half (48%) of all employment in the accommodation and food services sector across Otago is in inland Otago. The sector accounts for 13.9% of all employment in inland Otago.
- The 2018 Census showed that people working in the Accommodation & Food Services sector were more likely not to have a qualification than the rest of the workforce in Otago.
- There is a predominance of part-time work in accommodation and food services compared to the broader Otago labour market. From an earnings perspective, the lower number of hours worked, coupled with lower hourly pay rates, means that the average annual earnings of someone in the sector is well below the rest of the Otago labour market.
- The Accommodation & Food Services sector has a much higher share (61.3%) of younger workers aged 15 to 34 than the Otago labour market as a whole. There has also been a lift, from a small base, in the proportion of older workers aged 65+.
Ahuwhenua, kāhere me te hī ika | Agriculture, Forestry and Fishing
- The Agriculture, Forestry & Fishing sector has seen a decline in worker numbers in the past year, with 9,988 jobs (down from 10,347) and 4,147 (down from 4,909) jobs for further processing of primary goods.
- The agricultural sector has a high degree of seasonality.
- Almost half (48.2%) of all employment in the Agriculture, Forestry & Fishing sector across Otago continues to be in coastal Otago. A further 36.4% of employment in the sector is in inland Otago, with the remainder within the boundaries of Dunedin city.
- Agriculture, Forestry & Fishing workers tend to work relatively long hours, with 40.1% of the sector workforce 50-49 hours and 60+ hours compared with 16.5% of workers in the Otago economy as a whole.
- People in the Agriculture, Forestry & Fishing sector are twice as likely to be self-employed as people working across the Otago labour market as a whole.
- The sector’s workforce is rapidly aging, and a lack of available replacement workforce has contributed to this decline. 10.9% of the sector were 65+ in 2013, with this rising to 12.6% in 2018.
Hakataka | Construction
- With 16,038 jobs in the sector, Construction continues to be a large source of employment across the region. It experienced significant growth in 2022, reflected in the 6% employment growth rate for the sector, compared to 2.2% for the Otago region as a whole. This suggests a rebound to pre-pandemic growth.
- According to Infometrics forecasting, employment in Construction in Otago is forecast to peak in 2023, then plateau toward 2027.
- Employment in the sector and the major projects pipeline continues to be split between inland Otago and Dunedin – Dunedin projects such as the hospital build and various university projects are mainly public sector funded, while inland projects are largely commercial.
- Otago currently trains an insufficient number of workers locally each year to meet our labour demand.
- At 27.5%, the self-employment rate in Construction is far higher than across the Otago labour market as a whole (16.9%).
- Construction in Otago continues to be characterised by having a much higher share of workers from their mid-20s through to the 40 years age bracket than the broader Otago labour market.
Hauora me kā ratoka āwhina i te oraka| Healthcare and Social Assistance
- There were 14,237 jobs in Healthcare & Social Assistance in Otago in 2022, which represented a 10.8% share of all employment in the region. By comparison, the sector accounted for a 10.4% share of employment nationally. The sector experienced 3.6% growth in 2022.
- From an earnings perspective, the lower number of hours worked means that the median earnings of a worker in the sector ($51,100) is slightly below the rest of the Otago labour market ($52,590).
- Of a total of 14,237 jobs in the sector in 2022, a very large majority were in Dunedin (almost three quarters - 73.3.%).
- The region trains enough level 4 – 7 workers each year to meet labour demand, but there are insufficient people trained locally at levels level 1 – 3.
- There is a predominance of part-time work in Health Care & Social Assistance compared to the broader Otago labour market.
- The Healthcare & Social Assistance sector has a higher share (38.1%) of older workers aged 50-60 than the rest of Otago labour market (27.6%), although it is getting younger.
Footnotes
[1] Household Labour Force Survey, Statistics New Zealand, March 2023 quarter
[2] Ibid
[3] Ibid
[4] Linked Employer Employee Data (LEED), Statistics New Zealand, March 2022 quarter
[5] Estimated Resident Population, Statistics New Zealand, December 2022