September 2023 summary
On this page
This is the web version of the New Zealand Energy Quarterly September 2023 Summary.
Download the PDF and word versions:
New Zealand Energy Quarterly September 2023 summary [PDF, 402 KB]
New Zealand Energy Quarterly September 2023 summary [DOCX, 1.1 MB]
Record wind generation for September quarter
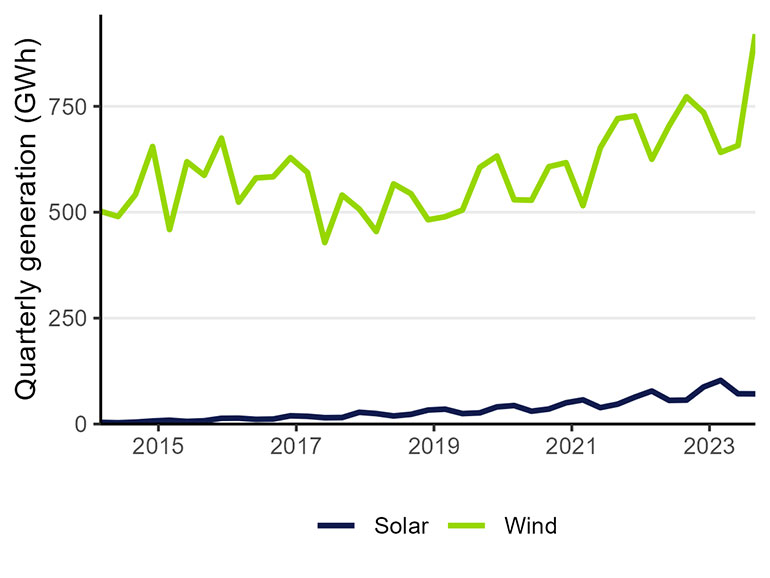
Electricity generation from wind reached 920 GWh in the quarter ending September 2023, an increase of 19.1% on the same quarter last year.
Mercury’s Turitea wind farm reached full capacity at the end of June 2023. Increased capacity and strong winds helped generation from wind reach eight per cent of New Zealand’s total electricity generation for the quarter.
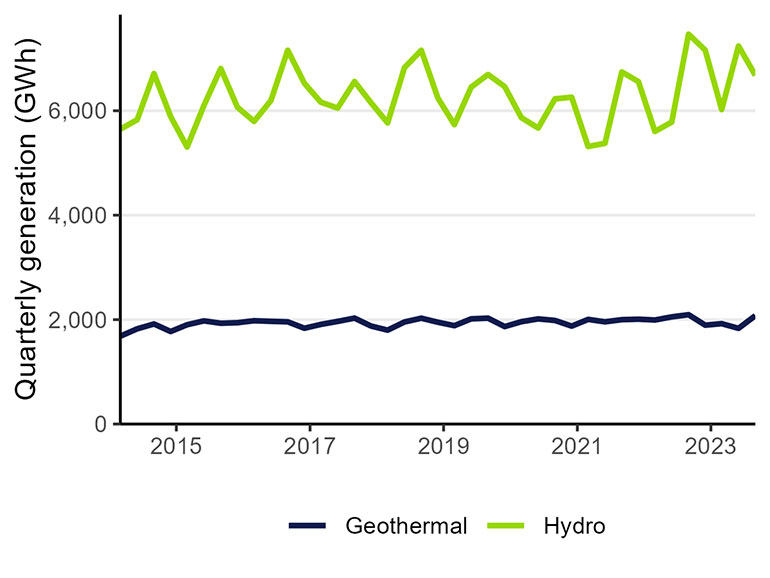
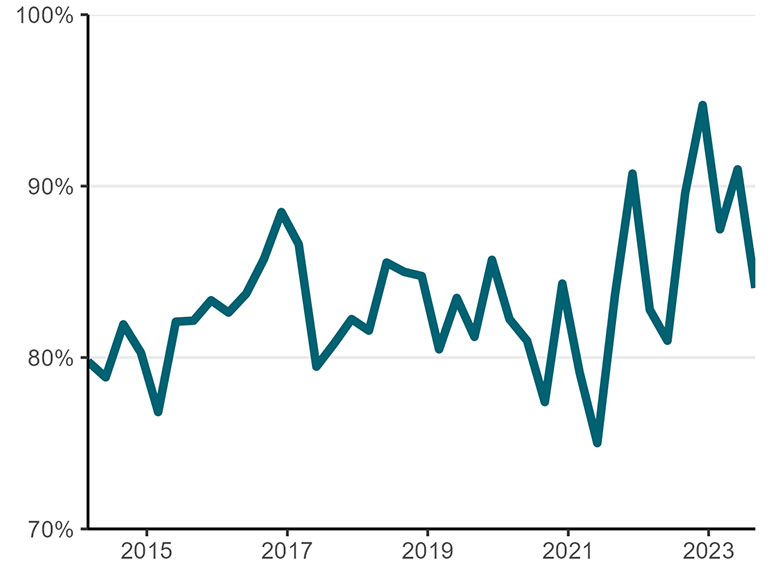
Overall, the share of electricity generation by renewable sources for the quarter was 84.1%, a drop of 5.5 percentage points on the same period last year. Hydro generation decreased 10.6% due to lower rainfall and planned outages at hydroelectric plants.
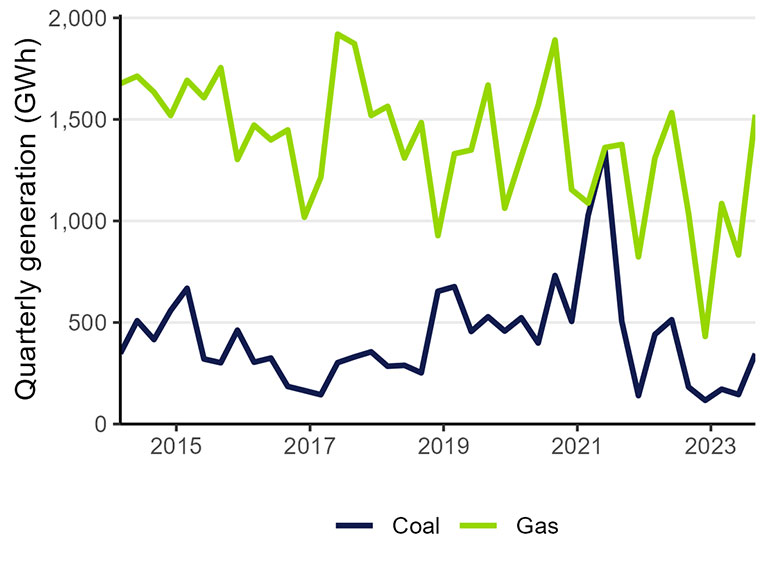
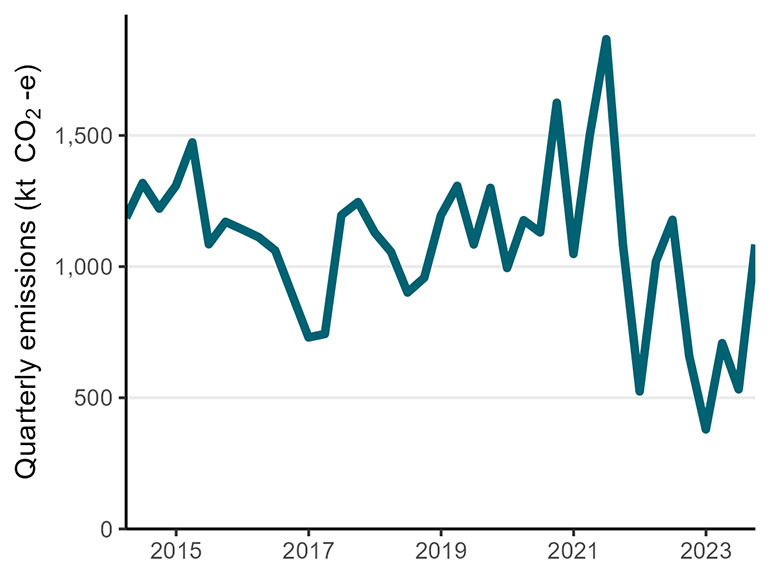
To meet demand, electricity generation from coal increased by 90% and from gas by 47% when compared to the previous September quarter. This contributed to a 64.4% increase in greenhouse gas emissions from electricity generation.
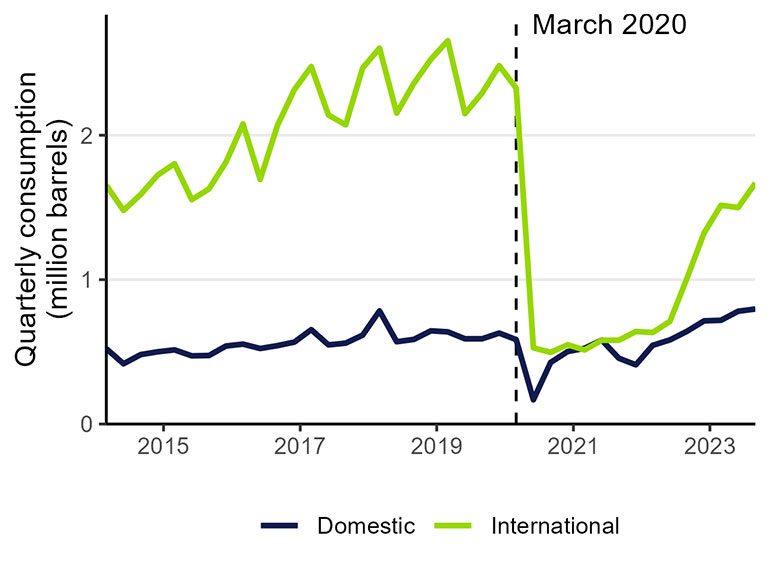
Jet fuel use continued to increase this quarter as domestic and international tourism rebounds from the COVID-19 pandemic downturn.
MBIE has made improvements to quarterly reporting of energy-related emissions. Emissions from electricity generation separated by gas type (CO2, CH4 and N2O) to allow a distinction to be made between short-lived and long-lived greenhouse gases.
Electricity generation from hydroelectric and geothermal sources
Text description of graph
Electricity generation from solar and wind sources
Text description of graph
Electricity generation from coal and gas
Text description of graph
Electricity from renewable sources
Text description of graph
CO2-e emissions from electricity generation
Text description of graph
Jet fuel consumption
Text description of graph