
Overview
Renewable generation reached its highest share in electricity generation since 1981, while total energy consumption fell to its lowest level since 2011 mainly due to lower industrial demand. Energy intensity hit a record low due to reduced use in the industrial and agricultural sectors.
On this page I tēnei whārangi
Renewable energy supply increases to another record high
Total primary energy supply is the total amount of energy available for use in New Zealand, accounting for domestic production and trade. New Zealand’s total primary energy supply[1] for 2025 was 827 PJ, a decrease of 1.6% (13.1 PJ).
Production decreased slightly, down 0.9% (5.20 PJ). Contributing to this decrease was lower natural gas production, which fell 14.4% (17.2 PJ), as fields approach the end of their operational life. The production of solid biofuels for energy use also decreased, down 5.2% (2.60 PJ) to the lowest level since 1994.
In contrast, coal production increased by 4.2% (2.64 PJ). This was driven mainly by higher bituminous coal production following the reopening of the Tawhai Tunnel, which had been closed during 2024 and had limited production in that period.
Production from renewable energy sources also increased in 2025. Geothermal energy production rose by 5.0% (11.4 PJ), while solar energy production increased by 56% (1.37 PJ), reflecting continued growth in generation capacity. Hydro energy production was also up 2.1% (1.77 PJ) with more favourable hydro conditions than 2024[2].
Overall, a record high 47.7% of New Zealand’s total primary energy supply in 2025 came from renewable energy sources, reflecting the continued increase in supply of renewables for electricity generation and declines in production of non-renewable energy sources (Figure A.1).
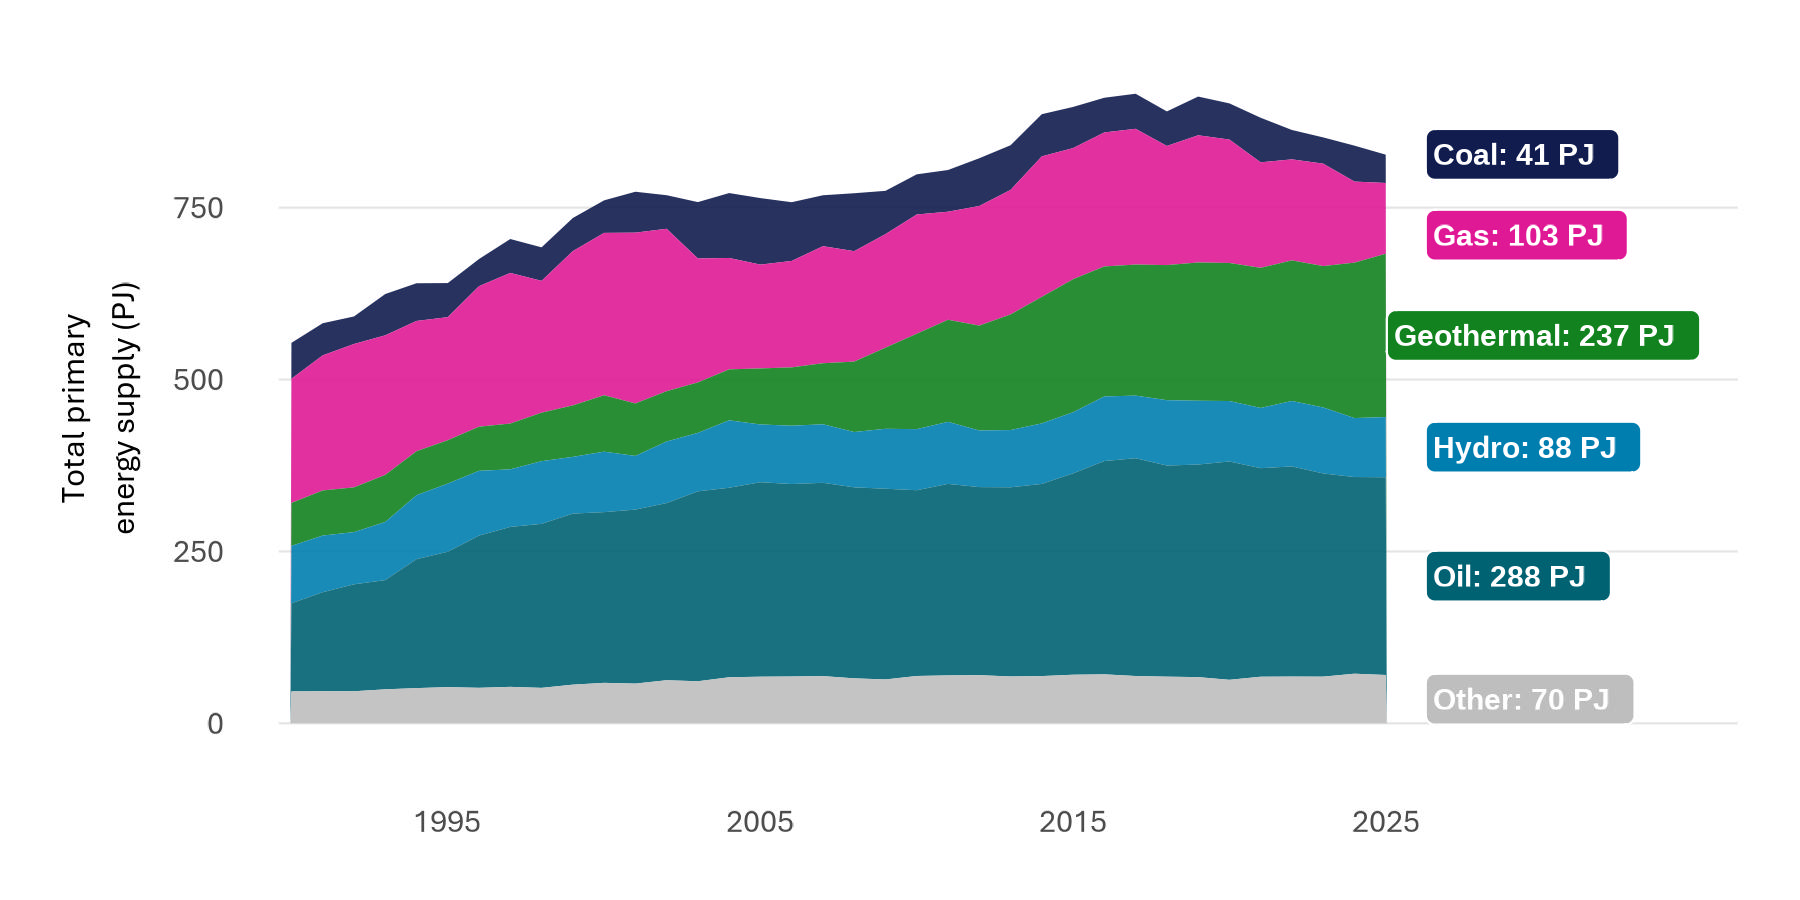
Figure A.1: Total primary energy supply by fuel type, by year.
View chart data for figure A.1
Energy imports increase
National energy imports increased by 2.2% (7.99 PJ). This was primarily driven by coal imports, which rose 29% (6.44 PJ). Genesis Energy increased their imports of sub-bituminous coal in anticipation of a potential increased need for non-renewable generation to help meet electricity demand in winter 2025. This saw the coal stockpile at Huntly Power Station reach a 13 year high of 1.16 million tonnes[3]. LPG imports also increased, up 15% (0.47 PJ) as New Zealand continues to rely more on imports amid declining domestic production due to fields reaching their end of life.
Energy self-sufficiency measures the ability for a country to meet its own energy supply needs through domestic production. A value of 100% indicates that a country produces all the energy it needs, whereas values above or below 100% indicate it is a net exporter or importer of energy. In 2025, national self-sufficiency increased slightly from 72.1% to 72.6%. Coal self-sufficiency rose from 121.3% to 160.4%, reflecting higher domestic production after the Tawhai Tunnel reopened in early 2025. Its closure during 2024 had reduced coal production and exports by disrupting a key transport route. This measure does not distinguish between energy produced for export and energy available for domestic use.
In contrast, LPG self-sufficiency decreased from 69.1% to 62.8% as domestic production falls and reliance on imports increases (Figure A.2).
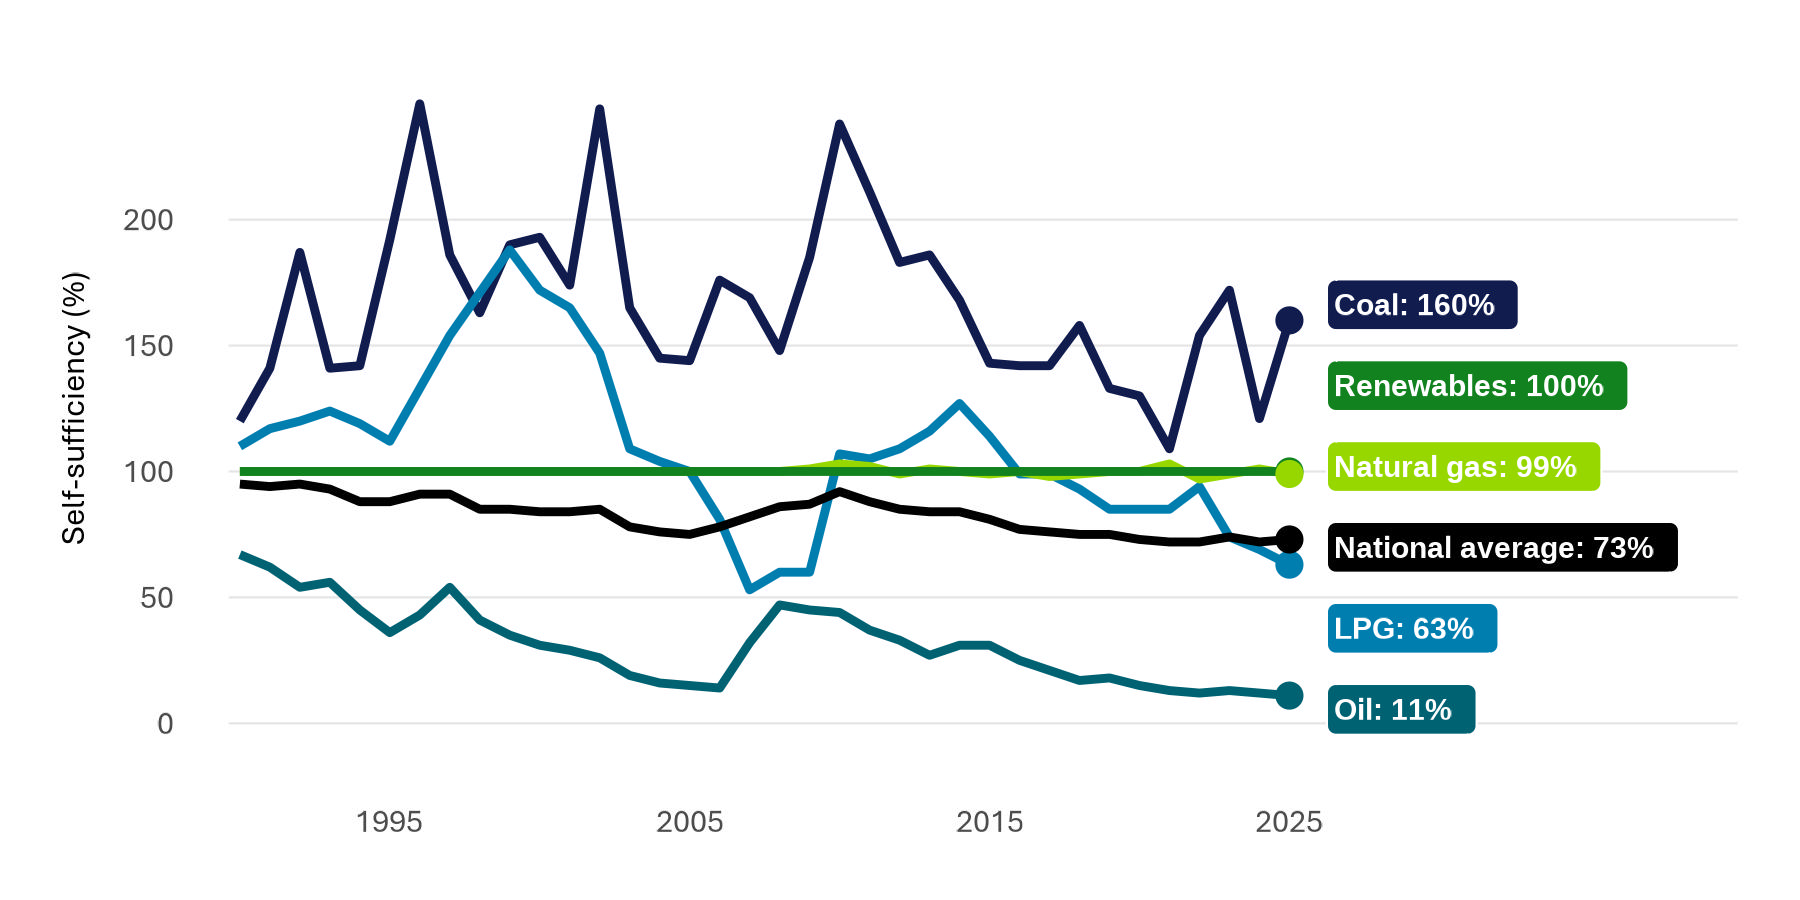
Figure A.2: Self-sufficiency by national average and energy types by year.
View chart data for figure A.2
Record high share of energy consumption from renewables
Total energy consumption decreased slightly by 1.2% (6.25 PJ) to 523 PJ in 2025, its lowest level since 2011. This decline was largely driven by lower industrial demand, which fell 2.5% (3.81 PJ). Within the industrial sector, the largest declines occurred in the chemical products subsector, down 14% (2.11 PJ), and the non-metallic products subsector, was down 23% (1.32 PJ). Reduced demand for non-renewable energy sources increased the share in total energy consumption coming from renewable sources to 31.8%, an all-time high (Figure A.3).
The increase in renewable energy consumption was driven by a decrease in non-renewable demand. The food processing sector, which includes dairy and meat product processing, saw lower coal consumption. Fonterra continues their switch to renewable energy sources in their manufacturing processes, decreasing overall sub-bituminous coal consumption by 17% (1.71 PJ) to 8.21 PJ, its lowest level on record. Further, bituminous coal consumption fell by 44% (1.30 PJ) to 1.65 PJ, also a record low.
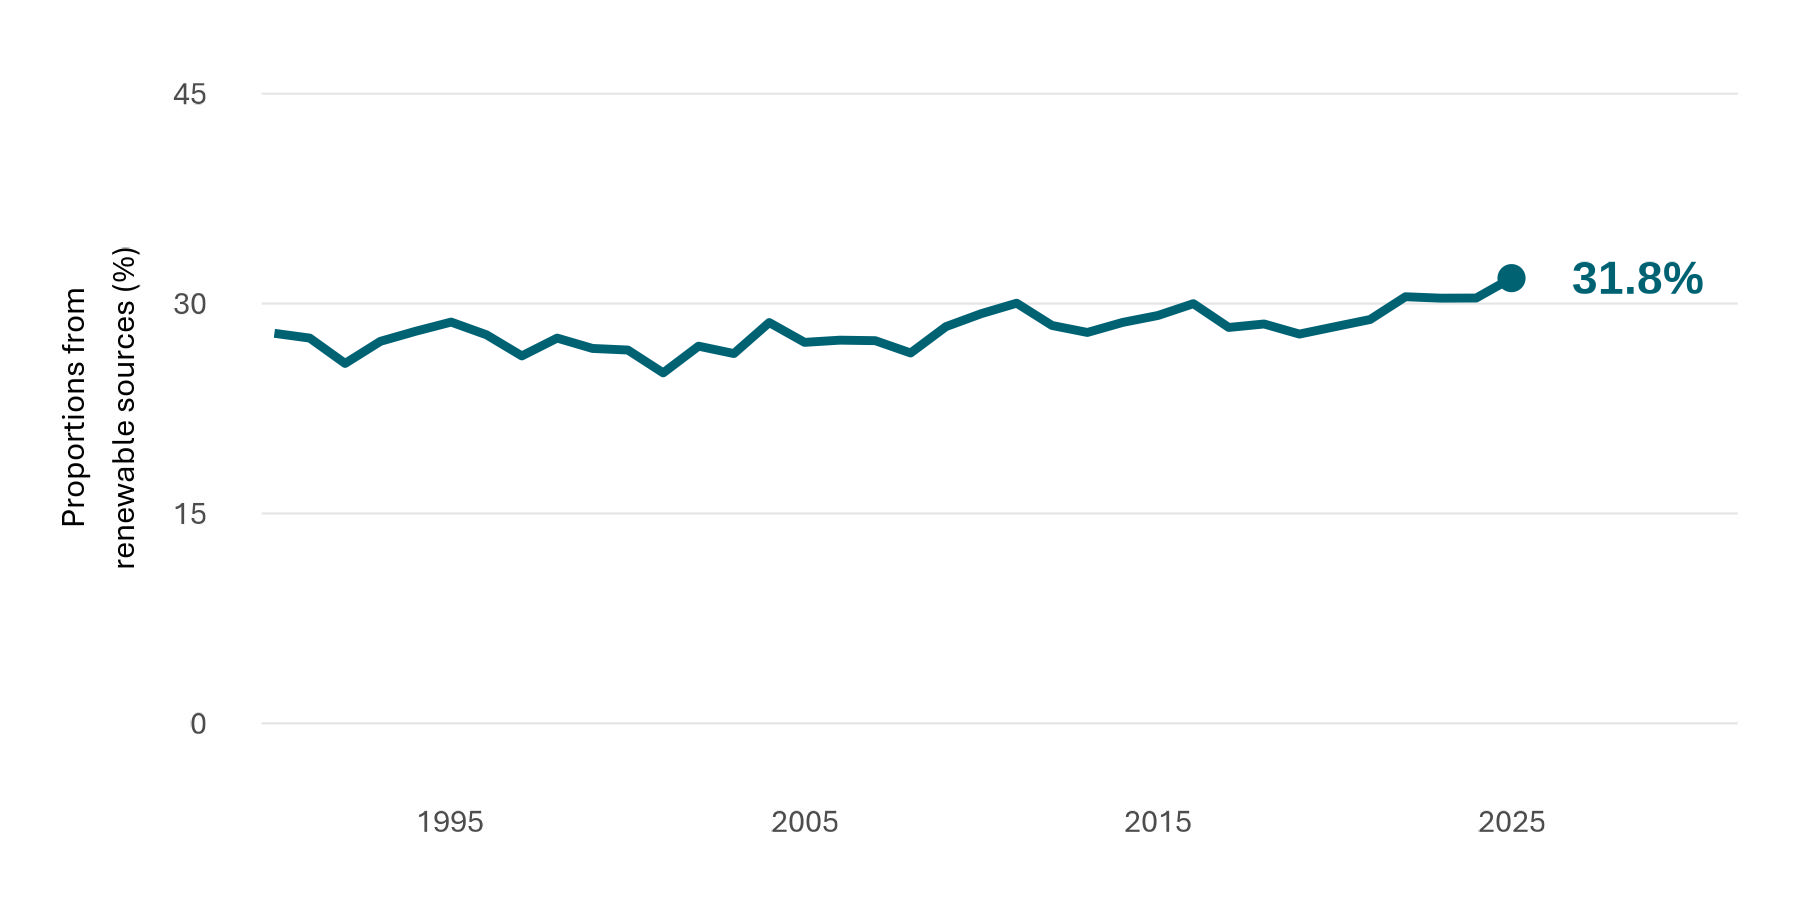
Figure A.3. Proportion of total energy consumption from renewable sources by year.
View chart data for figure A.3
Energy intensity gives an indication of the relationship between energy use and economic growth by telling us the amount of energy required to produce each dollar of gross domestic product (GDP).
National average intensity has improved slightly, from 1.88 MJ/NZ$ in 2024 to 1.86 MJ/NZ$ in 2025. The majority of sectors improved, with the chemicals and metals sector seeing the largest decrease from 9.02 MJ/NZ$ to 8.55 MJ/NZ$. Further, the agriculture, forestry, and fishing sectors decreased from 2.07 MJ/NZ$ to 2.00 MJ/NZ$, while the commercial and industrial (including chemicals and metals) sectors saw minimal changes (Figure A.4).
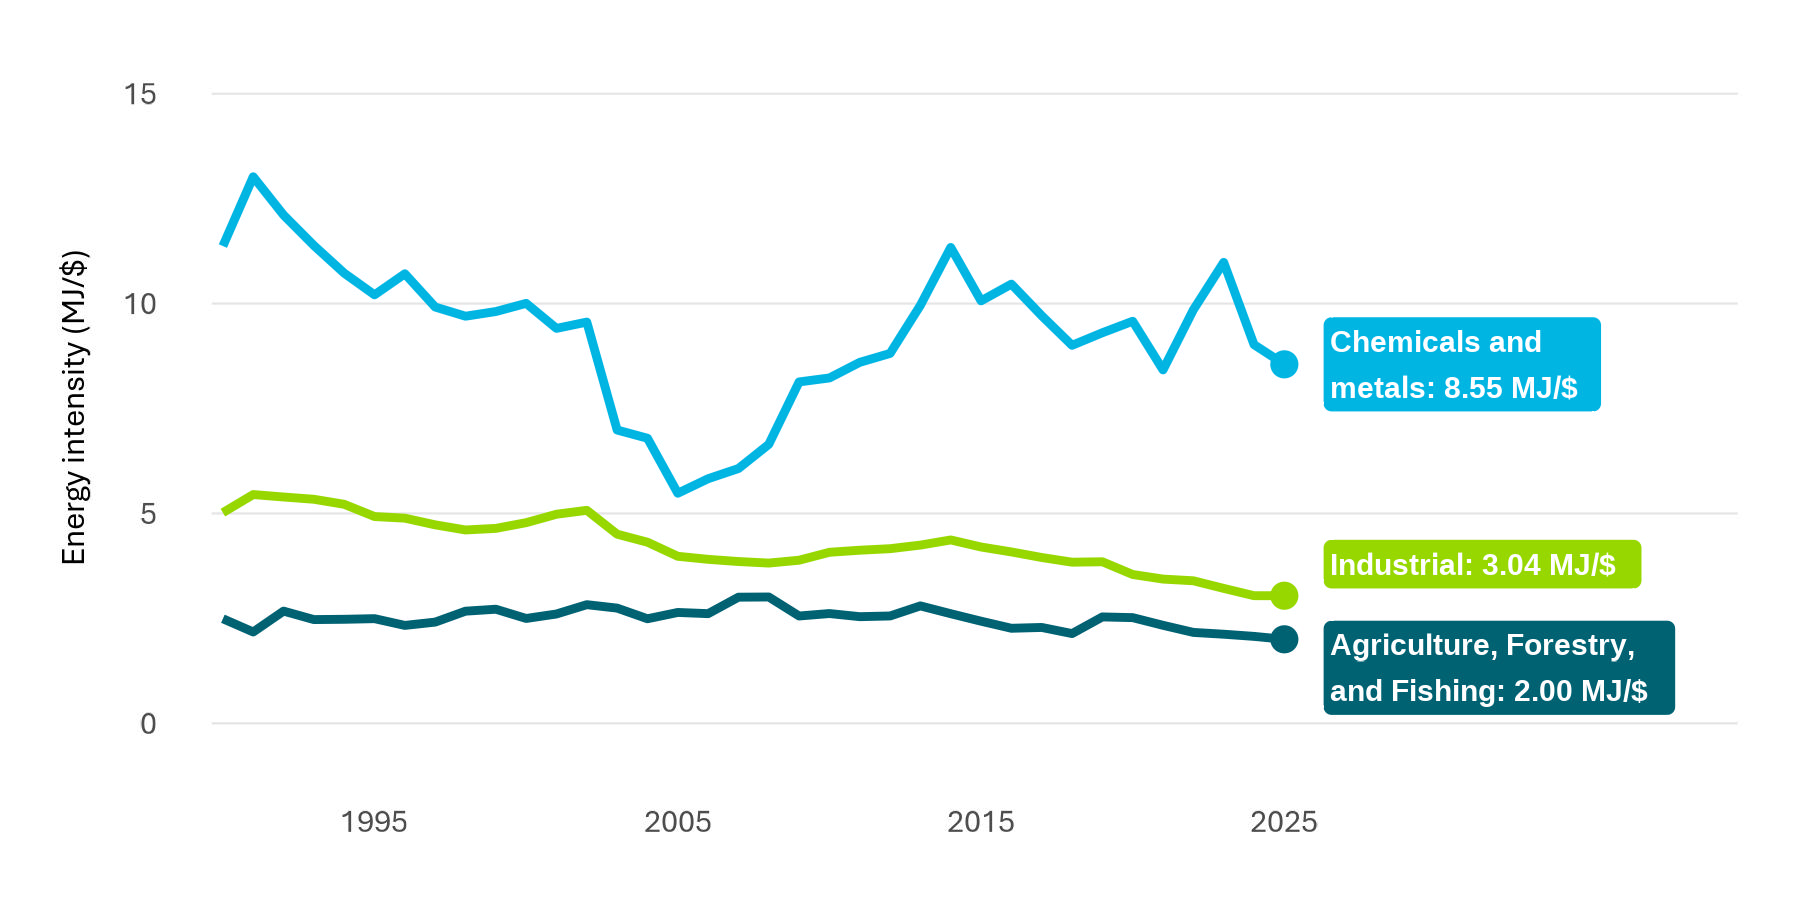
Figure A.4: Energy intensity by energy type and year.
View chart data for figure A.4
Footnotes
[1] Total primary energy supply refers to total domestic production plus imports, minus any exports or energy used in international transport. It also considers any changes in energy stock levels.
[2] Strong inflows push hydro storage above nominal full(external link) — Electricity Authority
[3] Interim report 2026(external link) — Genesis Energy