
Electricity
Record levels of geothermal and solar generation, driven by growth in generation capacity and reduced reliance on thermal generation. As a result, 88.5% of electricity generated in 2025 came from renewable sources.
On this page I tēnei whārangi
Growing electric vehicle uptake contributed to increased demand for electricity in the transport sector in 2025. Industrial demand also increased, reflecting the end of New Zealand Aluminium Smelters’ demand response from winter 2024 alongside the ongoing impacts of electrification. In contrast, demand by the agriculture and residential sectors fell, with national consumption increasing slightly on 2024 levels.
Background
Most of New Zealand’s electricity generation comes from renewable sources:
- Hydroelectric generation has been a part of New Zealand’s energy system for over 100 years and continues to provide a large share of our electricity needs. At over 5,000 MW, hydro accounts for around half of national generation capacity, with most of it found in the South Island.
- Geothermal generation in New Zealand began over 55 years ago with the opening of the Wairakei Power Station in November 1958. Most of New Zealand’s installed capacity is in the Taupō Volcanic Zone. Geothermal plants run as baseload, meaning that they are unable to quickly increase or decrease their generation output.
- Wind generation has grown quickly as a source of electricity in New Zealand with the first wind farm commissioned in 1997. The largest wind farms are in the North Island.
- Solar is a relatively new source of electricity generation in New Zealand. Households and businesses have their own solar panels for on-site generation (‘distributed solar’) but there are also large-scale (or ‘utility-scale’) solar farms feeding into New Zealand’s national grid. The first solar farm connected to the national grid in 2025.
In most years, over 80% of electricity is generated from renewable sources. The remainder of electricity generation comes from the combustion of non-renewable sources such as coal, oil, and natural gas. These fuels account for around a fifth of New Zealand’s annual electricity generation.
Battery Energy Storage Systems (BESS) are a new and growing technology in New Zealand that can store electricity and discharge it back into the grid as required. BESS improves grid stability, security of supply and resilience of the power system.
Around a third of New Zealand’s electricity is used by households and around another third by industrial sectors. Most of our industrial electricity demand comes from the basic metals, food processing, and wood processing sectors. The aluminium smelter at Tiwai Point is the largest single user of electricity in the country. The commercial sector consumes around a quarter of New Zealand’s electricity demand. The remaining demand comes from the agriculture, forestry, and fishing sectors as well as transport.
Electricity generation from renewable sources reaches new high
In 2025, 44,140 gigawatt hours (GWh) of electricity were generated in New Zealand, an increase of 0.4% from 2024.
88.5% of electricity generated in 2025 came from renewable sources, an increase from 85.5% in 2024 (Figure B.1). This is the highest share of electricity generated from renewable sources since 1981. This increase in generation from renewable sources was driven by new capacity such as geothermal and solar (Figure B.2).
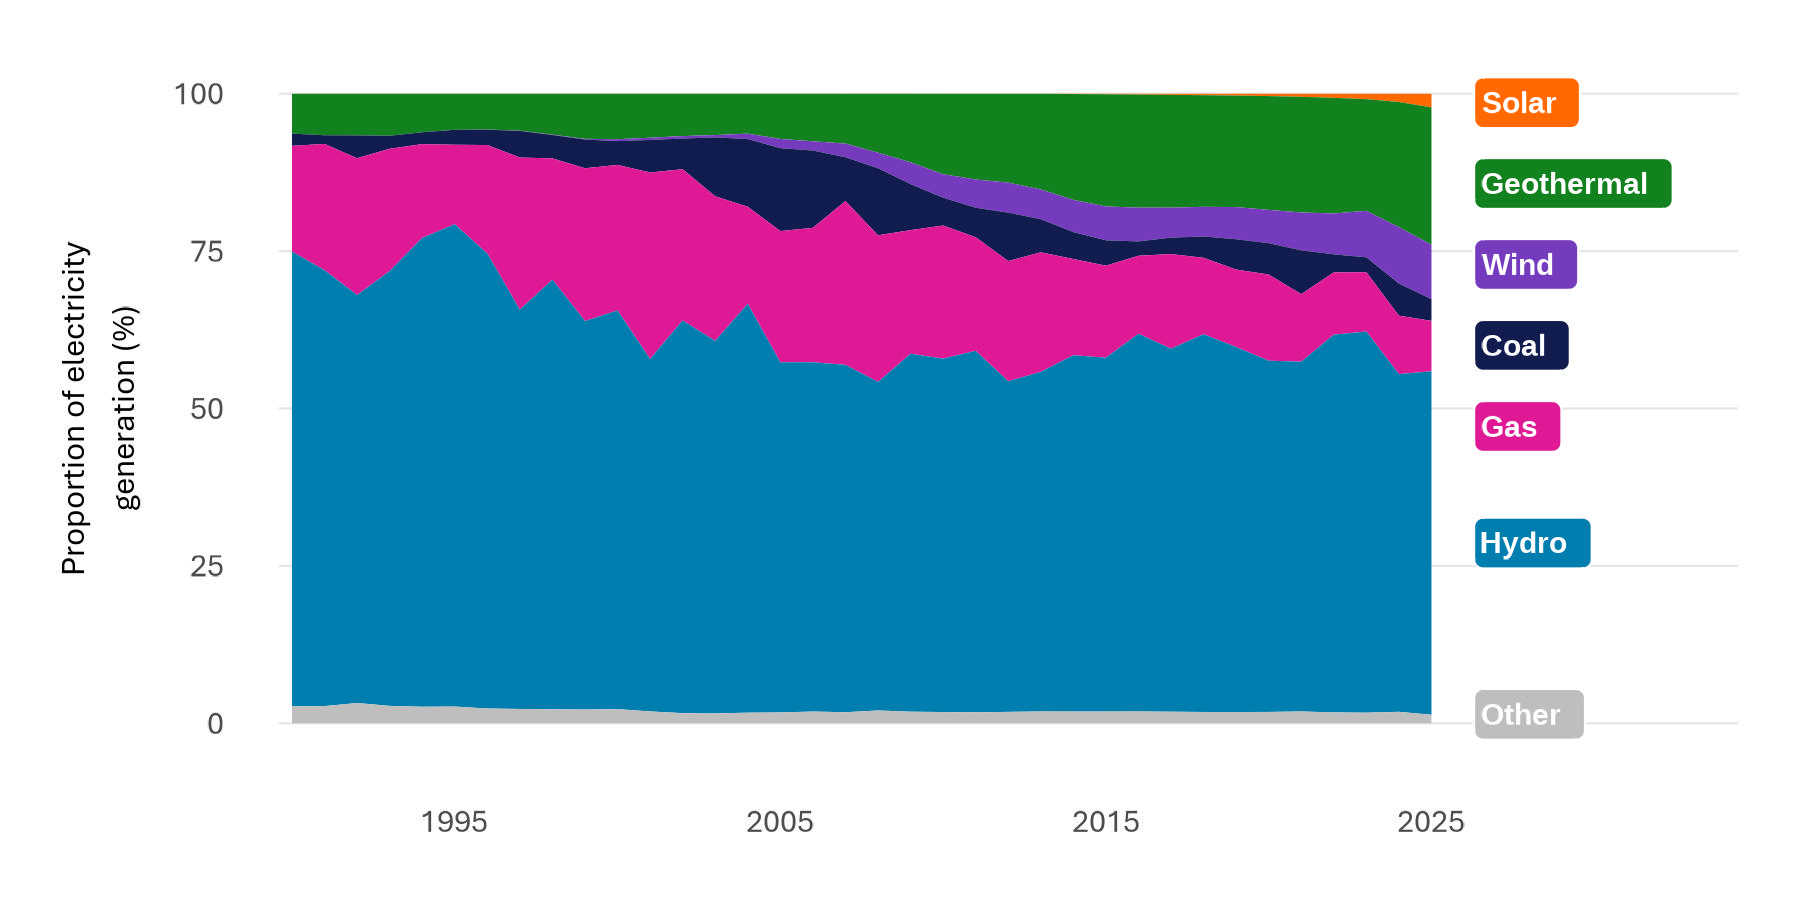
Figure B.1: The proportion of total electricity generation from each fuel type, by year.
View chart data for figure B.1
Geothermal generation increased 10% on 2024, reaching a record 9,631 GWh in 2025. The commissioning of the geothermal plants Tauhara (May 2024), Te Huka 3 (October 2024) and TOPP2 (December 2025), contributed to the record level of geothermal generation.
Solar generation increased 66% on 2024 levels, with annual generation from solar reaching a record 959 GWh in 2025. This was driven by an increase in generating capacity, with solar generation capacity increasing 52% on 2024 levels to a total of 830 MW. In January 2025, Lodestone’s Te Herenga o Te Rā near Waiotahe, with a capacity of 33 MW, became the first solar farm in New Zealand to be directly connected to the national grid. Several other utility-scale plants came online and contributed to the increase in solar generation, such as Lauriston (November 2024), Te Puna Mauri ō Omaru (December 2024), Pukenui (October 2025), Taiohi (October 2025) and Pāmu Rā ki Whitianga (November 2025). Solar capacity and generation are expected to continue an increasing trend over the next few years, with many grid-connected solar plants currently under construction or in planning. The Electricity Authority’s generation investment pipeline shows New Zealand’s solar capacity is expected to grow by 930 MW in the next three years from committed projects4.
Despite declining 3.3% on 2024 levels, wind generation remained strong at 3,811 GWh. This was the second-highest annual wind generation figure on record, behind 2024’s record of 3,940 GWh.
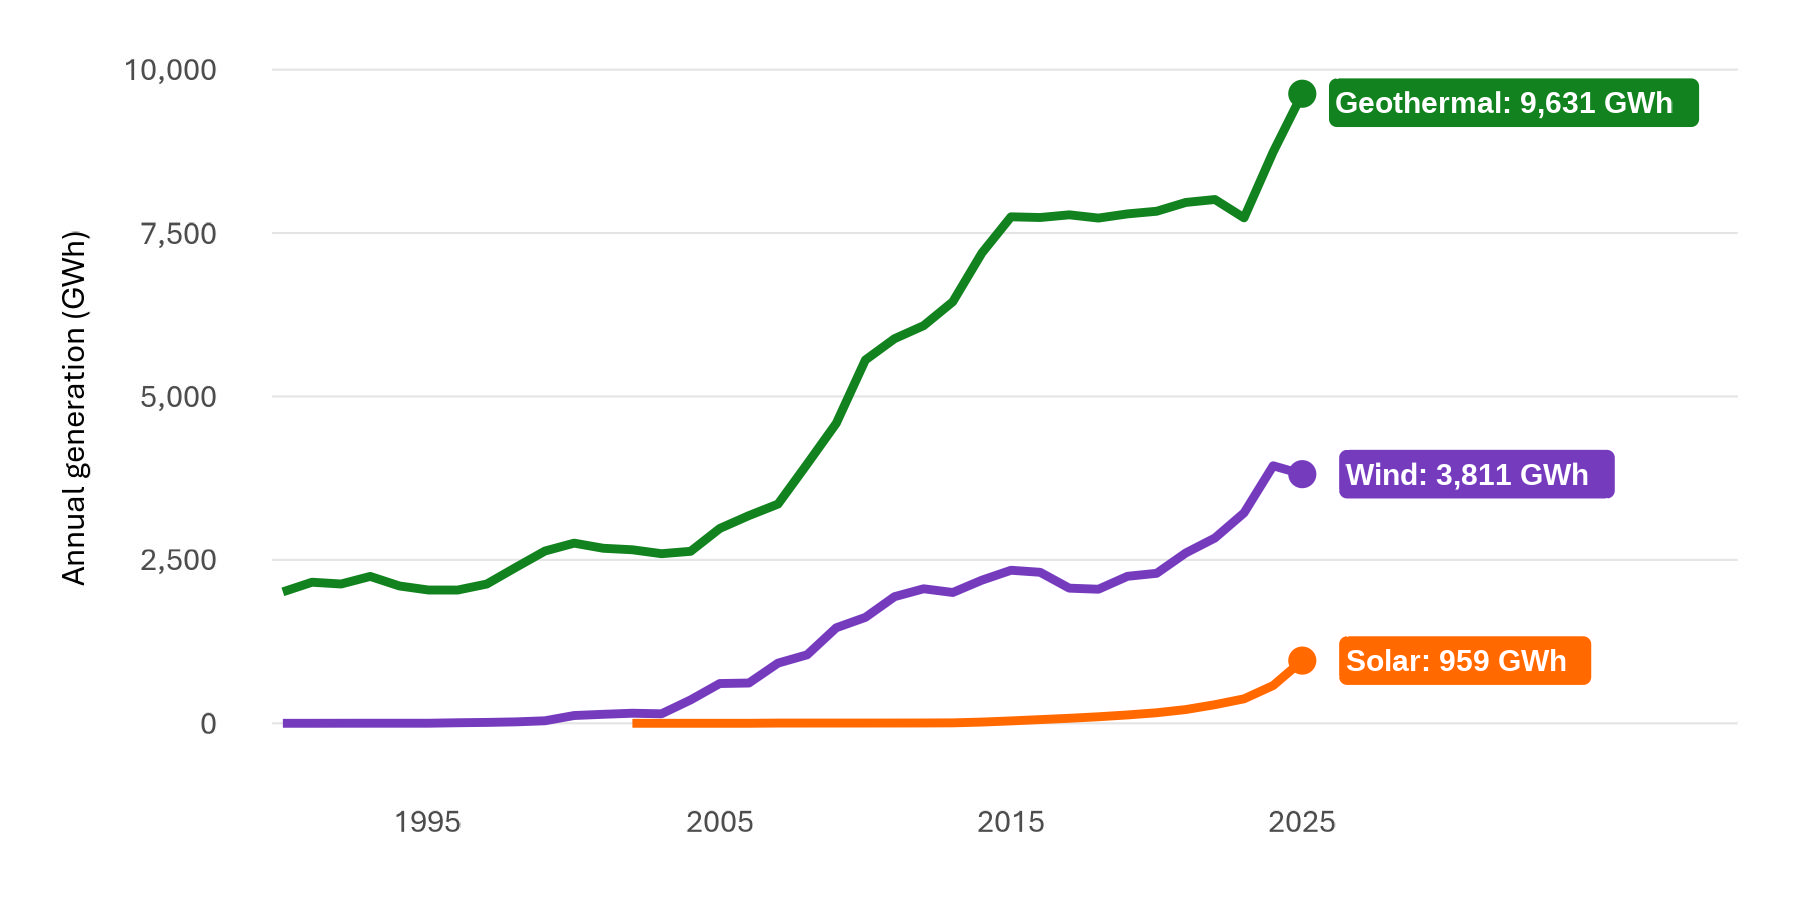
Figure B.2: Electricity generation from geothermal, wind, and solar sources, by year.
View chart data for figure B.2
Record low inflows for early 2025 quarters
Total hydro generation in 2025 increased 2.1% to 24,079 GWh from 2024. Hydro generation was relatively low in 2024 due to unfavourable hydrological conditions, notably during the winter months.
Hydro generation in the first half of 2025 was lower than the same period in 2024, reflecting low inflows. Transpower reported record low inflows during January and February, resulting in the March 2025 quarter having the lowest quarterly hydro generation since the June 2012 quarter and the lowest March quarter hydro generation since 1987. To compensate for reduced hydro generation, coal generation increased by 54% compared to the March 2024 quarter.
Conditions improved later in the year. Hydro generation in the September 2025 quarter was 23% higher than the September 2024 quarter. The December 2025 quarter also experienced strong inflows, with hydro generation in the quarter up 8.0% on the December 2024 quarter (Figure B.3).
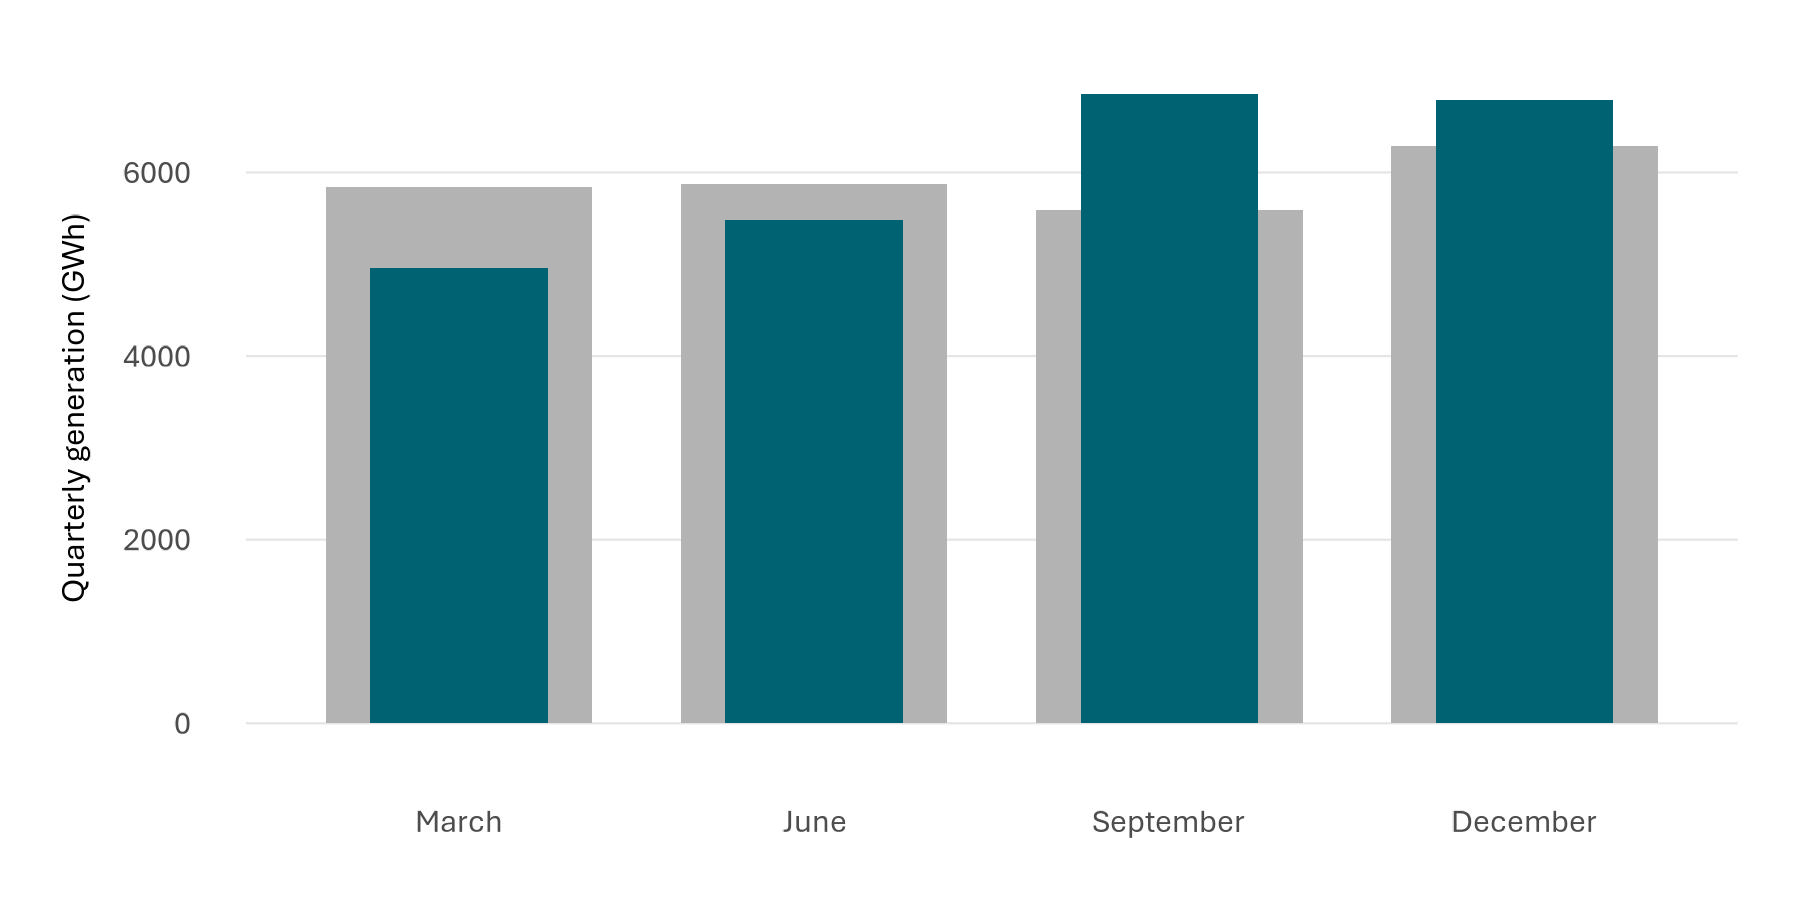
Figure B.3: Quarterly hydro generation in 2025 (teal bars), compared to quarterly hydro generation in 2024 (grey bars).
View chart data for figure B.3
Gas generation at record low since 1981
With high renewable generation in 2025, the need for generation from non-renewable sources reduced. The 2024 calendar year had seen increases in coal, oil and gas generation in response to low hydro inflows. In 2025, coal generation decreased by 32% to 1,523 GWh, oil generation dropped 76% to 6 GWh and gas generation dropped 13% to 3,538 GWh.
At 3,538 GWh, 2025 saw the lowest amount of gas generation in New Zealand since 1981. Contributing to the decreases in gas generation were less available gas supply and reduced operation of gas-powered generation plants. Genesis Energy’s Huntly Unit 5 had a three-month outage from October to December 2025, for scheduled maintenance. This allowed gas to be reallocated to other gas users in the market5. Contact Energy’s Taranaki Combined Cycle (TCC) gas generation plant was initially scheduled for closure at the end of 2024 due to declining gas supply. However, TCC was made available until the end of 2025 to support security of supply through the winter6.
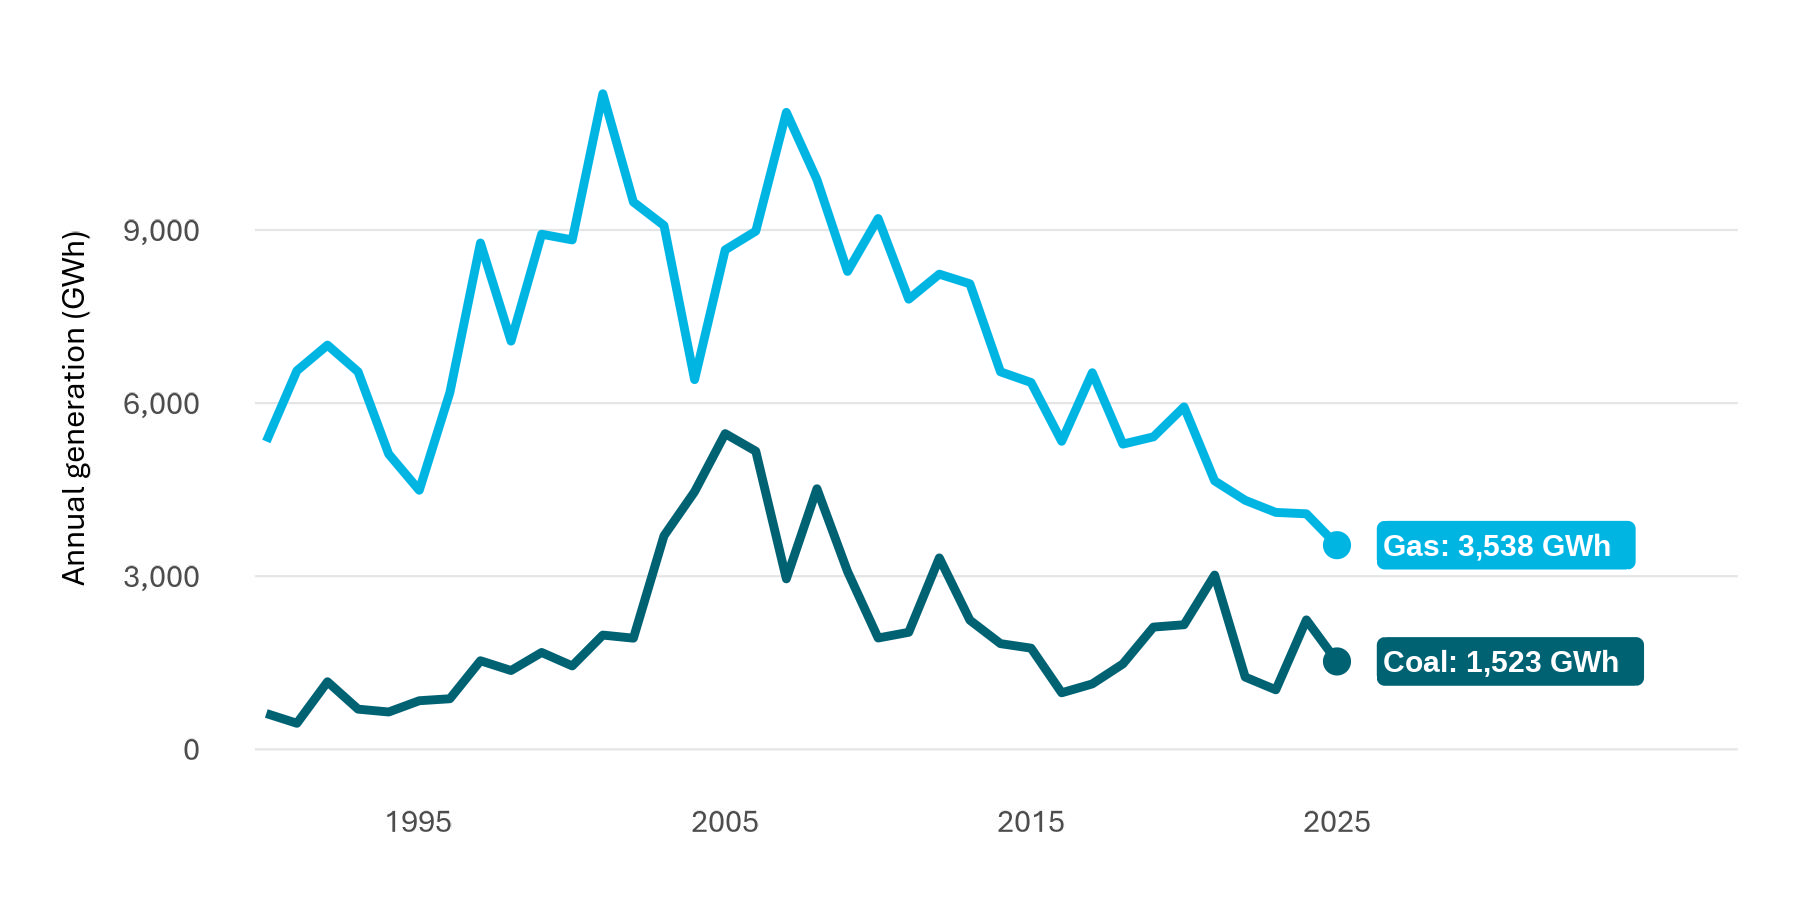
Figure B.4: Electricity generation from gas and coal sources, by year.
View chart data for figure B.4
Electricity consumption increases slightly
Electricity consumption in New Zealand reached 40,583 GWh in 2025, an increase of 1.3% compared with 2024. Growth in electricity demand was primarily driven by higher consumption in the industrial, commercial, and transport sectors, which increased by 3.2, 1.6, and 18% respectively. Growth in the transport demand was particularly strong, reflecting the continue uptake of electric vehicles (EV’s).
In contrast, consumption in the agriculture, forestry, and fishing, and residential sectors fell compared with 2024. Although residential electricity consumption reached a quarterly record high of 4,509 GWh in the September 2025 quarter, annual residential electricity consumption decreased by 1.4%.
Despite these declines, stronger demand from business and transport users more than offset the reductions, resulting in an overall increase in national electricity consumption.
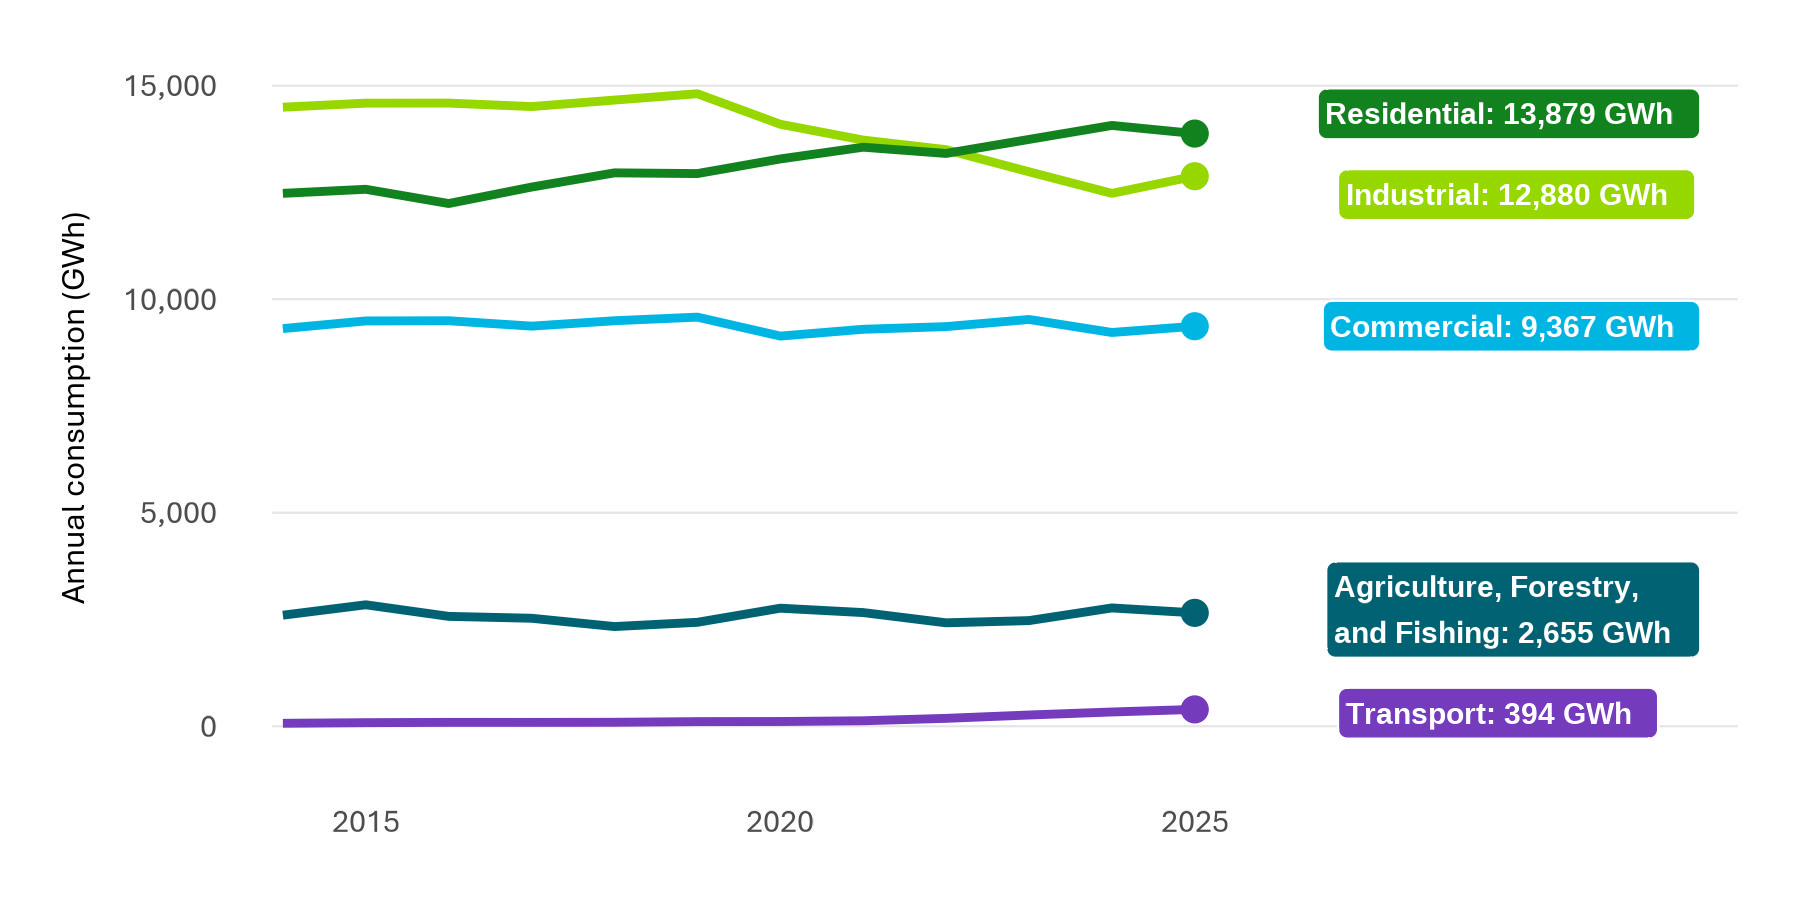
Figure B.5: Electricity consumption by sector, by year.
View chart data for figure B.5
Electricity consumption in the transport sector increased from 334 GWh in 2024 to 394 GWh in 2025, continuing the sector’s long-term upward trend (Figure B.6). Contributing to this growth is increasing electric vehicle (EV) adoption, which is shifting energy demand in transport from fossil fuels to electricity. Ministry of Transport fleet statistics show that at the end of 2025, there were 92,628 battery electric vehicles in New Zealand’s motor vehicle fleet, up from 83,902 at the end of 20247. Battery electric vehicles accounted for 1.9% of the total fleet at the end of 2025, compared with 1.7% a year earlier.
In April 2025, the Government announced the EV Charging Infrastructure Loans programme, aimed at expanding the availability of public charging infrastructure across the country.
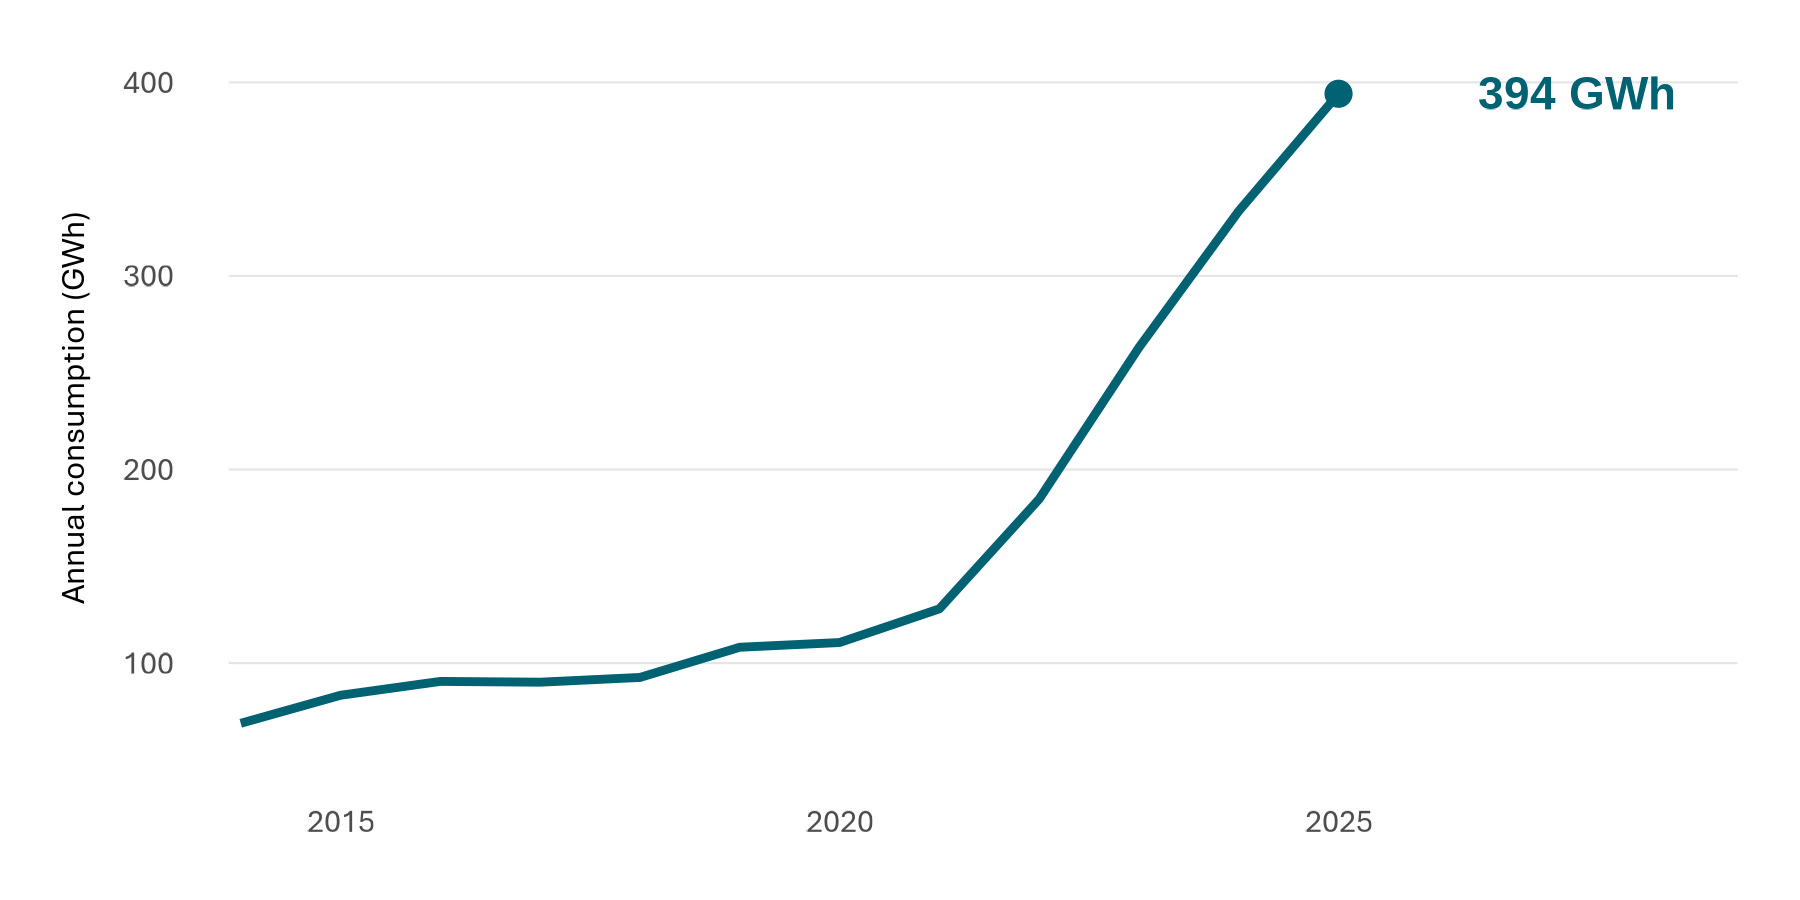
Figure B.6: Electricity consumption in the transport sector, by year.
View chart data for figure B.6
Industrial demand increases due to changes in activity and ongoing impacts of electrification
The industrial sector remained New Zealand’s largest consumer of electricity in 2025, using 12,880 GWh, an increase of 3.2% compared with 2024 (Figure B.7). The increase in total industrial demand in 2025 was driven by increases in the basic metals and food processing sectors, of 6.1% and 4.3% respectively. Consumption in the food processing sector has continued to steadily increase, reaching 3,248 GWh.
The basic metals sector is the largest contributor to industrial consumption, with the aluminium smelter at Tiwai Point the largest single user of electricity in New Zealand. In 2024, the demand response agreement between Meridian Energy and New Zealand Aluminium Smelters (NZAS) was activated in response to low hydro inflows and decreased gas supply. In the winter 2025, improvements in hydro storage levels and the outlook for supply in the market saw Meridian Energy and NZAS agree to ramp up electricity use at Tiwai Point from 16 June 2025, with the demand response arrangement ending on 11 August 20258.
Another contributor to the increased industrial consumption is the ongoing electrification of manufacturing processes by major industrial energy users in the food processing sector. In May 2025, Fonterra commissioned its first electrode boiler at its Edendale site. Fonterra also announced a $150 million investment in electrification projects across its North Island sites in January 2025. This includes two electrode boilers at Whareroa, a new electrode boiler at Edgecumbe, and two resistive electric boilers at Waitoa.
Despite an overall increase in industrial demand, consumption in the wood, pulp, paper and printing sector has remained low and relatively stable since 2023, with a 0.1% decrease compared with 2024. The closures of production and processing facilities in recent years have contributed to this. In February 2025, Oji Fibre Solutions confirmed Kinleith Mill will permanently cease paper production at the end of June 2025, moving to a paper import model for their packaging operations instead9. This follows the closure of their Penrose Mill in September 2024.
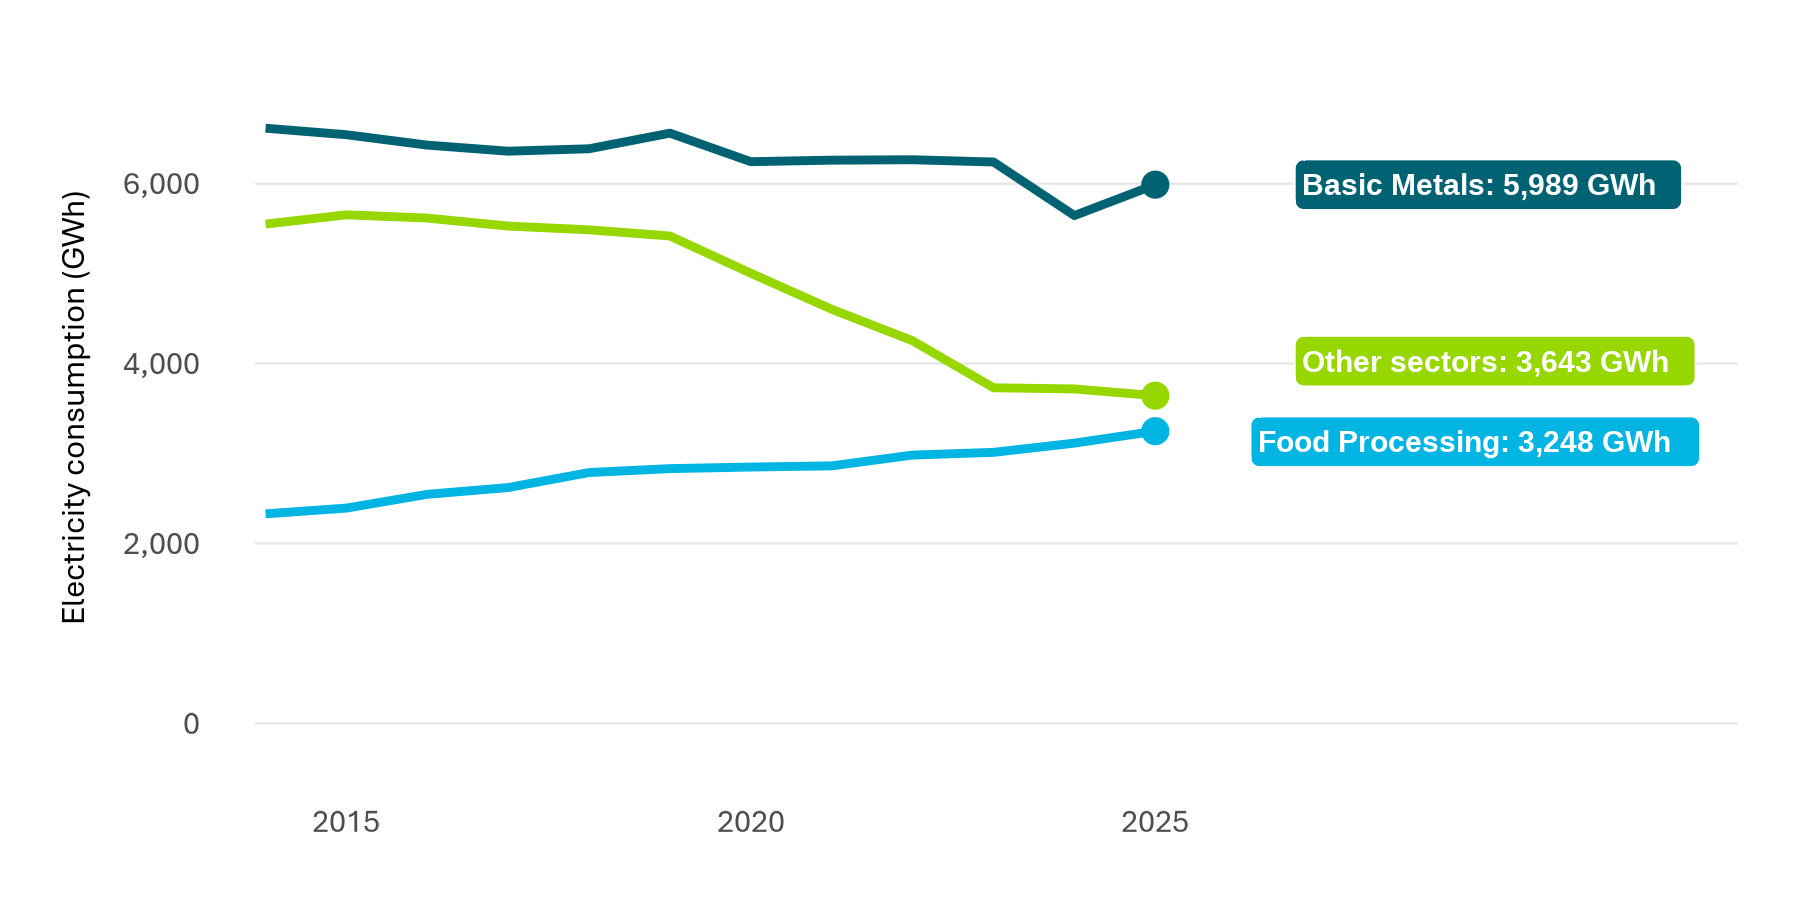
Figure B.7: Industrial electricity consumption by subsector, by year. “Other sectors” include wood, pulp, paper and printing, chemicals, mining and other minor sectors.
View chart data for figure B.7
Footnotes
[4] Generation investment pipeline(external link) — Electricity Authority
[5] Genesis extends Unit 5 outage to support gas consumers(external link) — Genesis Energy
[6] Integrated report(external link) — Contact Energy
[7] Fleet statistics(external link) — Ministry for Cities, Environment, Regions and Transport
[8] Meridian and NZAS agree to shorten current demand response(external link) — Meridian Energy
[9] OjiFS Confirms Kinleith Mill Decision(external link) — Oji Fibre Solutions