Overview
This report presents comprehensive information on, and analysis of, New Zealand’s energy supply and demand for the 2024 calendar year.
On this page I tēnei whārangi
Despite increases in energy demand in the residential and agriculture, forestry, and fishing sectors, national energy demand fell due to lower industrial energy demand.
Aviation fuel consumption, covering both international and domestic transport, continued to grow, nearing pre-pandemic levels as international travel activity recovered.
Energy supply from renewable sources reaches a record high
New Zealand relies on a combination of domestically produced and imported fuels to meet its energy needs.
New Zealand’s total primary energy supply[1] was 835 petajoules (PJ) in 2024, falling 1.3%, or 11.4 PJ, from 2023. Ongoing field depletion and lower supply saw natural gas production continue to decline in 2024, dropping 20.8% to 118 PJ in 2024. Coal production and exports both fell, down 3.7% and 9.8% respectively, with closures to rail lines due to slips and a partial tunnel collapse contributing to these declines.
In contrast, domestic renewable energy production increased in 2024, up 4% on 2023 levels. Growth in geothermal, solar, and wind energy for electricity generation saw total renewable energy supply reach 379 PJ, up 15.5 PJ. The combination of increased renewable energy supply and a decline in non-renewable energy production drove the share of renewables in total primary energy supply to a record high of 45.5%.
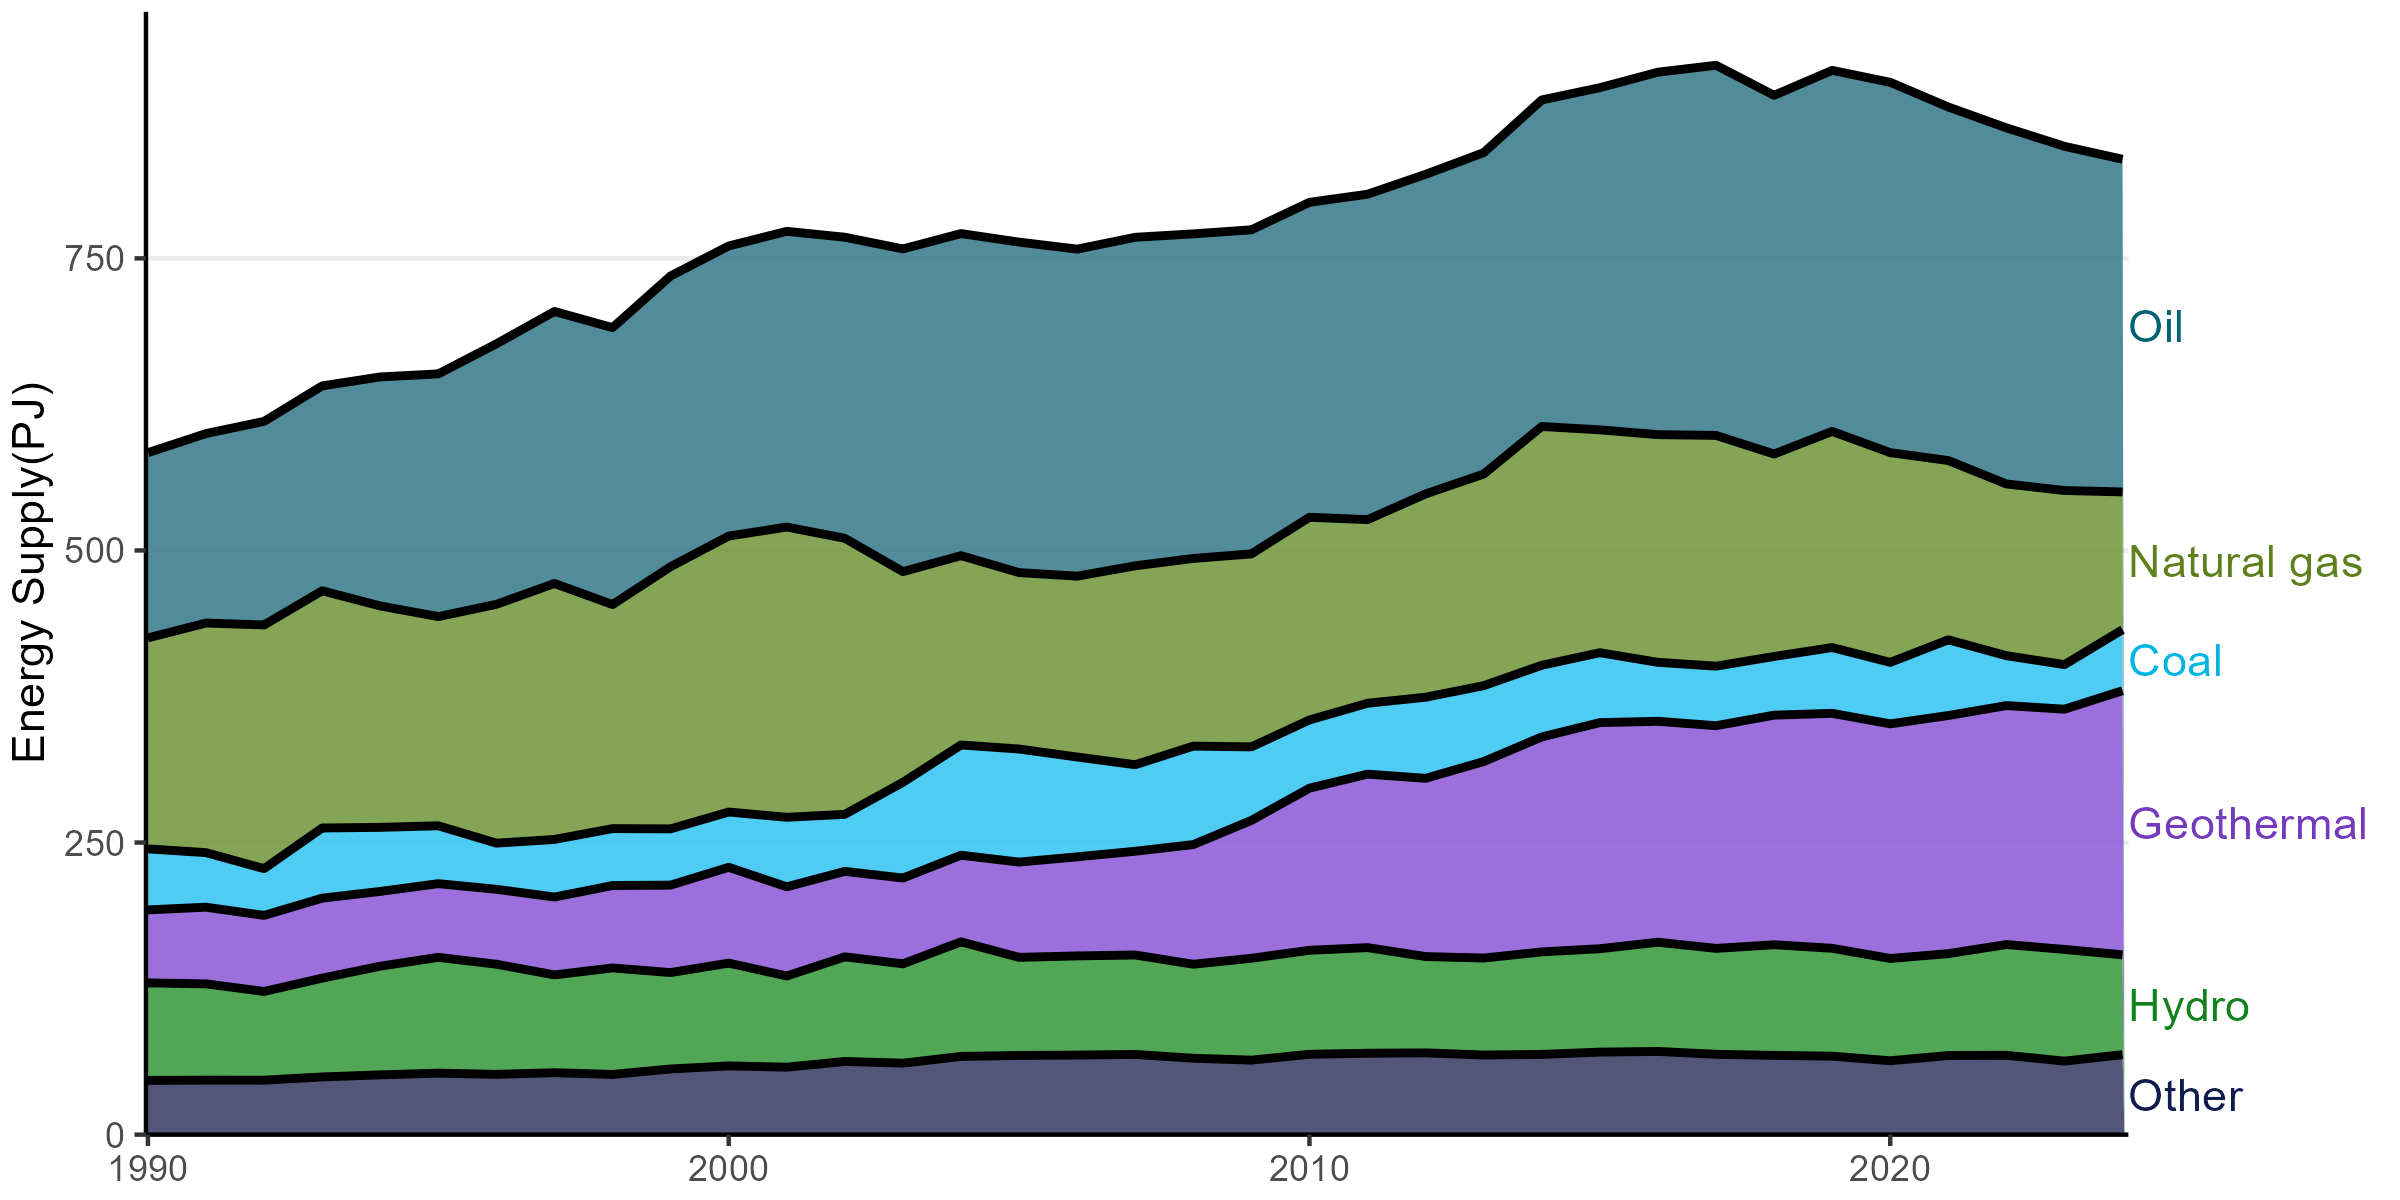
Figure 1. Total primary energy supply by fuel type, by year.
View chart data for figure 1
National electricity generation increased 0.9% to 43,879 gigawatt hours (GWh) in 2024. Low hydro inflows and lower gas supply led to an increased reliance on coal for electricity generation in 2024. Hydro generation dropped to 23,490 GWh its lowest level since 2013. A 556 megawatt (MW) increase in renewable generation capacity helped fill some of the gap in supply left by lower hydro generation. Wind capacity nearly doubled over the past five years, rising from 691 MW in 2020 to 1269 MW in 2024. Capacity gains in solar and geothermal generation also helped to support generation from renewables. As a result, even with low hydro generation - which typically accounts for over half of all generation - the overall renewable share of electricity generation only fell 2.6 percentage points to 85.5%, down from 88.1% in 2023 (Figure 2).
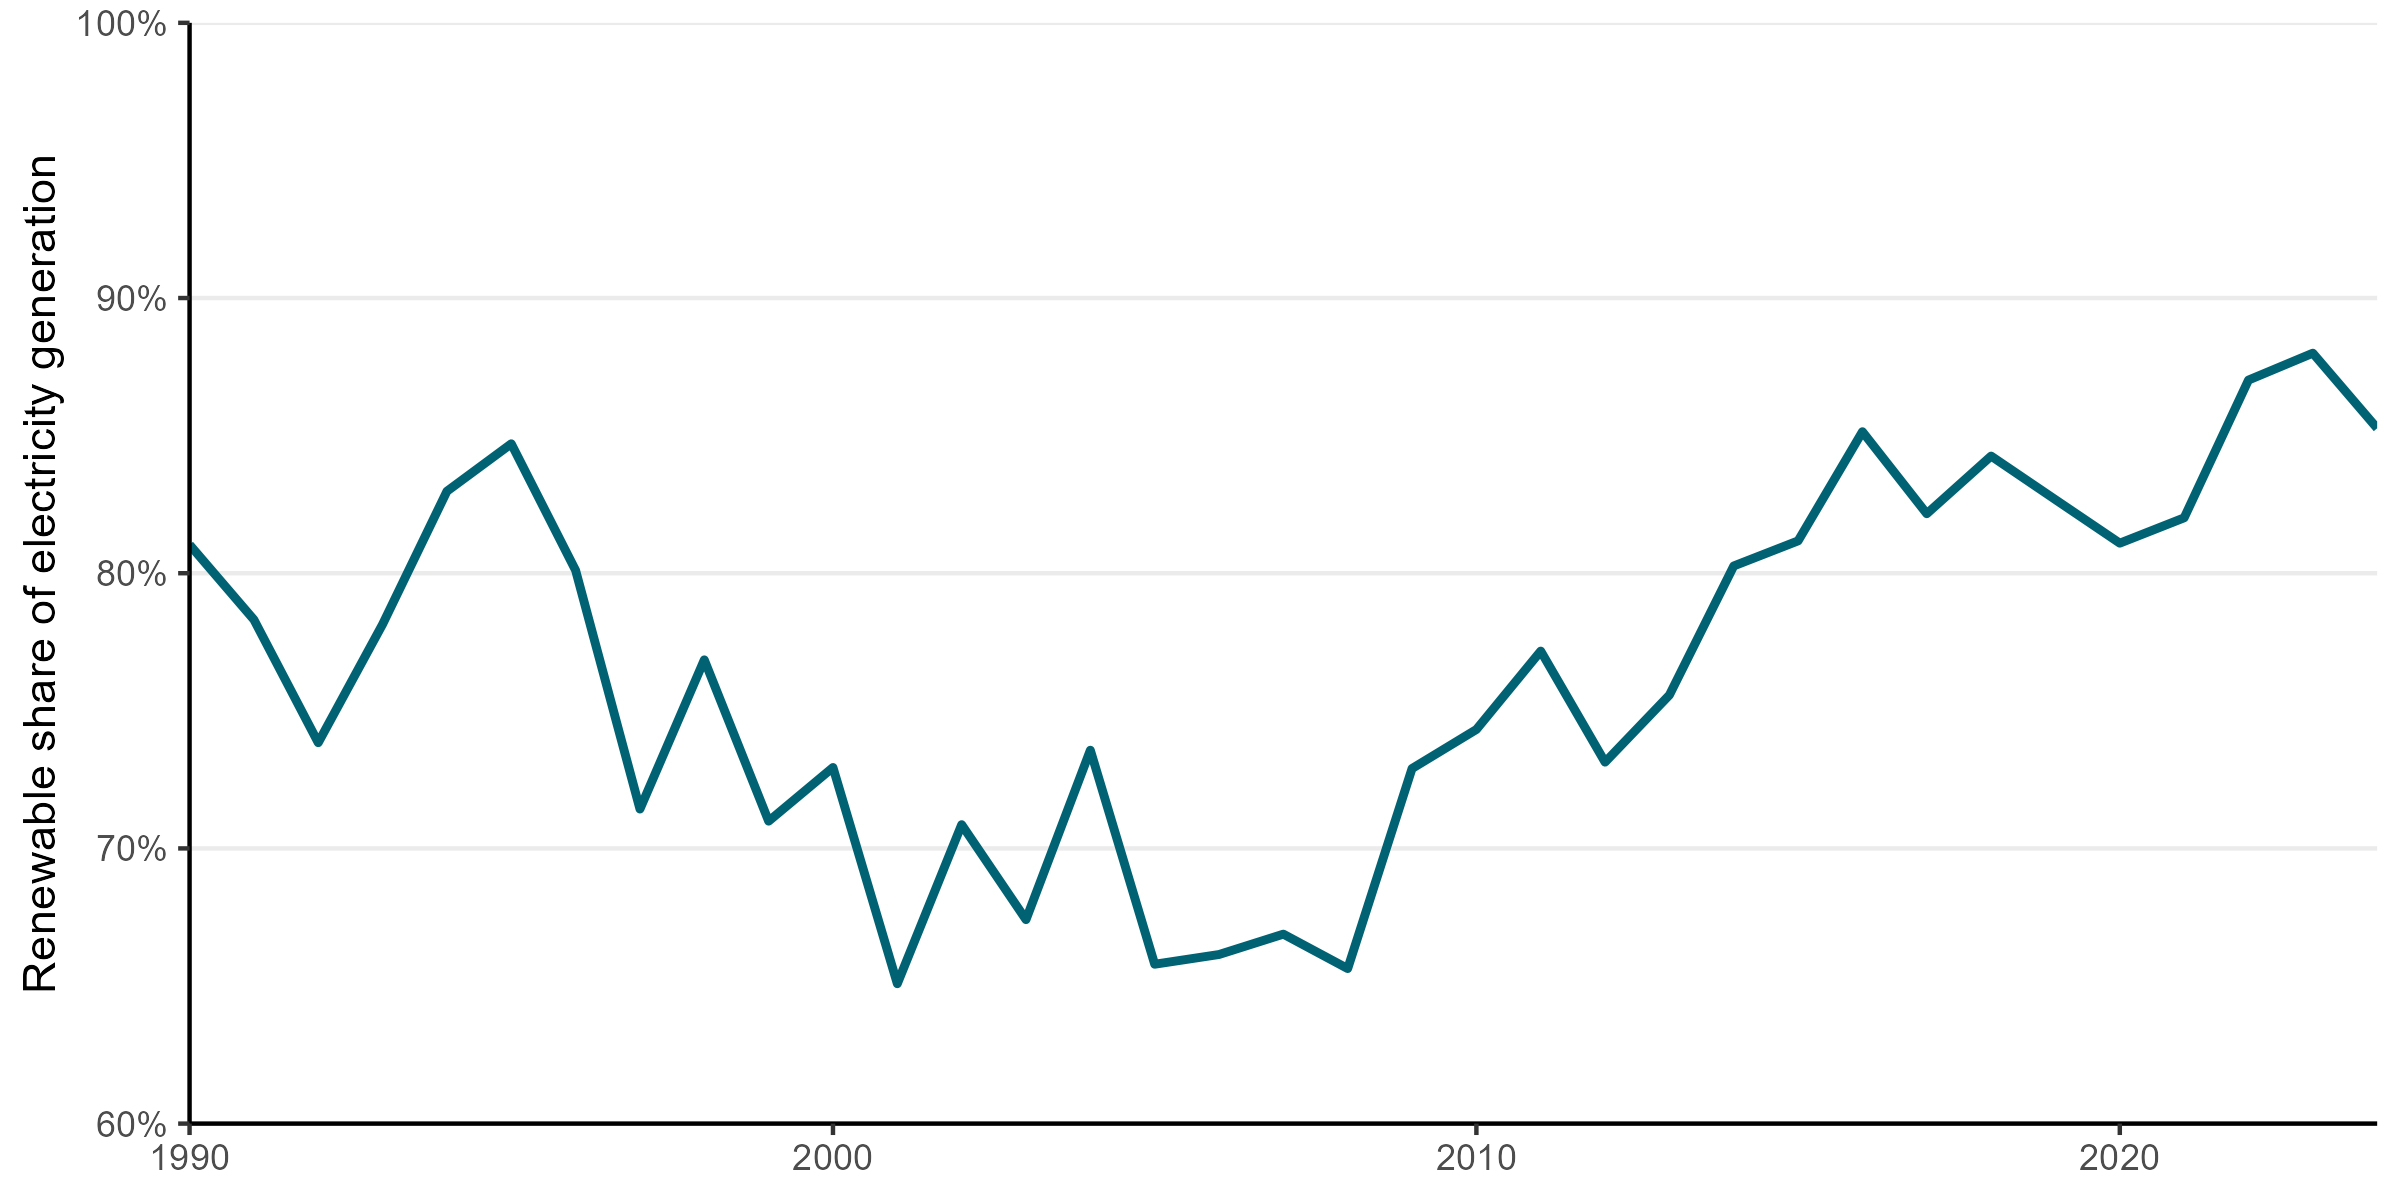
Figure 2. The proportion of New Zealand’s electricity that is generated from renewable sources, by year.
View chart data for figure 2
Energy self-sufficiency, the ability of a country to meet its own energy supply needs through domestic production, was 72.1% in 2024, down 1.5 points from 2023. Coal self-sufficiency dropped from 172% to 121%, reflecting an increase in coal imports. Coal imports increased 311% as Genesis Energy rebuilt its stockpile for the Huntly Power Station to support national electricity generation. Overall, energy imports accounted for 359 PJ of the country’s primary energy supply for the year.
30% of national energy consumption came from renewable sources
Energy consumption dropped 11.1 PJ (2.1%) to 525 PJ in 2024 (Figure 3). This was mainly due to a 12.2 PJ (7.5%) fall in industrial energy demand, particularly in the chemicals subsector. Commercial energy demand also fell, down 4.1% on 2023 levels. In contrast, energy use in the agriculture, forestry, and fishing sectors grew 7.1%, while residential energy demand grew 1.9%. Energy demand for transport remained stable with a slight decline of 0.1% in 2024.
Overall, the share of modern renewables in total final consumption also remained stable, increasing slightly from 29.7% to 29.8%.
Gas consumption for 2024 was 58.5.2 PJ, a decrease of 14.9% on 2023 and the lowest since 2011. Reduced gas supply led to price increases and lower industrial usage from early 2024, with Methanex (the largest gas user in New Zealand) idling production completely between August and October.
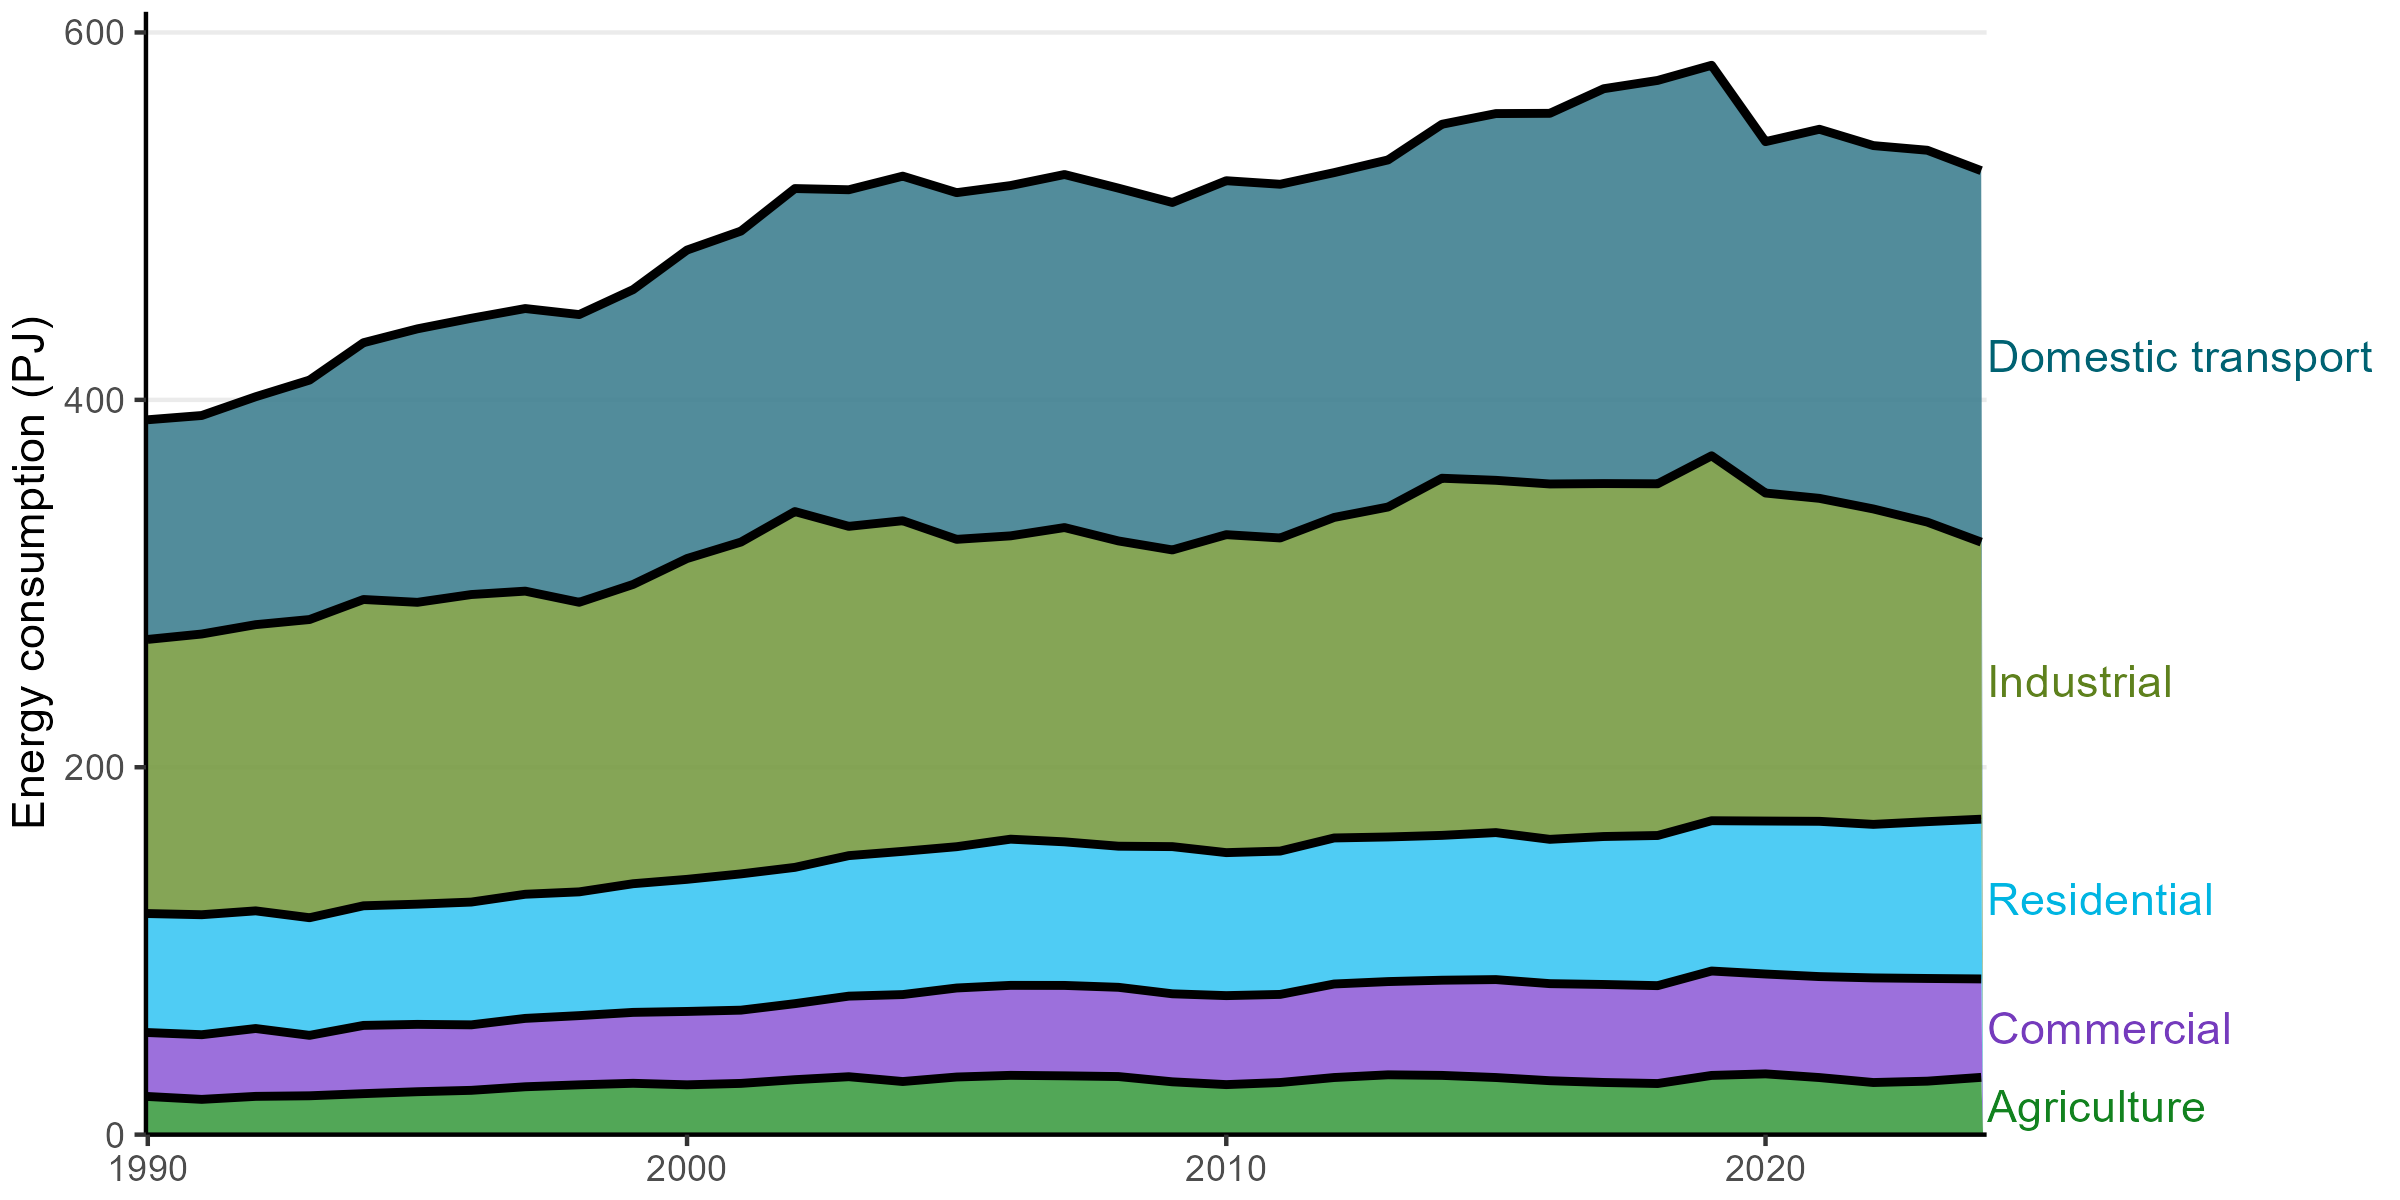
Figure 3. National energy consumption by sector and year.
View chart data for figure 3
Industrial electricity consumption fell to 12.5 gigawatt hours (GWh), the lowest level since 1992, largely due to the demand response agreement with New Zealand Aluminium Smelters being called on. While industrial demand declined, residential and agricultural electricity consumption increased, keeping national total electricity use relatively stable.
International transport fuel consumption continued to grow as travel activity continued to increase following the coronavirus (COVID-19) pandemic. Aviation fuel consumption, covering both international and domestic transport, reached 11.0 million barrels which is 90% of pre-pandemic levels. Consumption of other fuels remained stable overall, with increases in residential and agricultural use offsetting declines in the commercial sector.
Energy intensity gives an indication of the relationship between energy use and economic growth by telling us the amount of energy required to produce each dollar of gross domestic product (GDP). Energy intensity across most sectors was relatively unchanged from 2023 levels, with national average energy intensity improving slightly, declining from 1.90 megajoules per dollar (MJ/$) in 2023 to 1.87 MJ/$ 2024 (Figure 4). The chemicals and metals subsector saw the largest change, with its energy intensity falling from 11.3 to 9.5 MJ/$. Although the subsector’s GDP dropped from 2023 to 2024, its energy intensity fell due to a large decline in energy use.
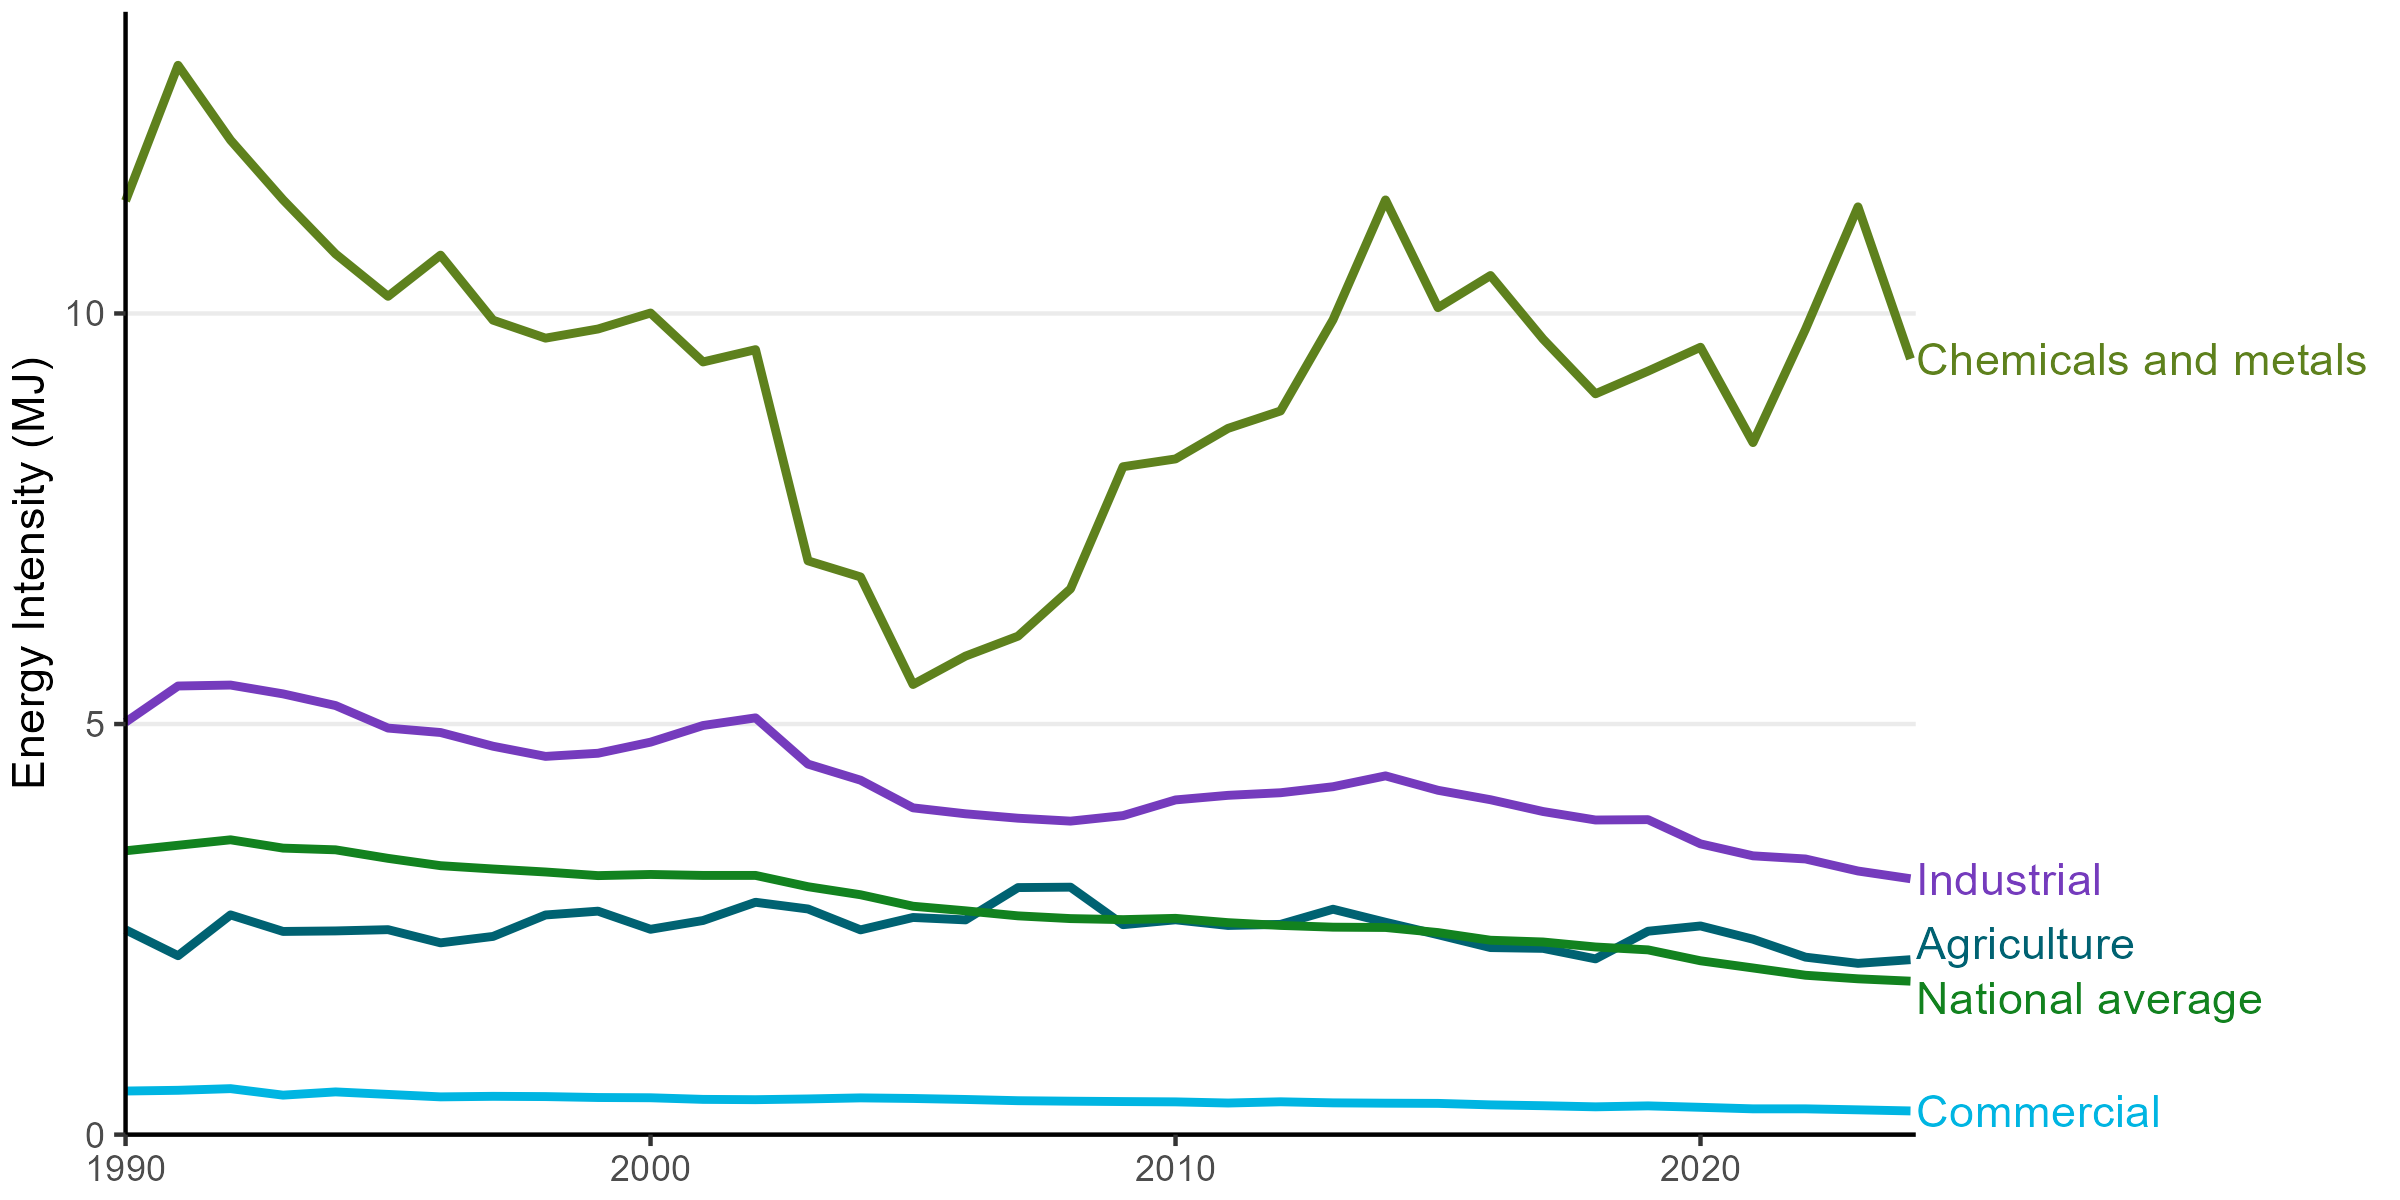
Figure 4. Energy intensity for selected sectors and subsectors in New Zealand, by year.
View chart data for figure 4
National average energy intensity has been improving since 2011, driven by the commercial sector with its large contribution to national GDP and its relatively low energy intensity.
Footnotes
[1] Total primary energy supply refers to the total indigenous production plus imports, minus any exports or energy used in international transport. It also takes into account any changes in energy stock levels.