Gas
Natural gas production decreased in 2024 because of faster-than-expected natural field decline, most notably impacting industrial gas use. Forecast production indicates this will continue throughout the coming years.
Background
New Zealand’s natural gas fields are concentrated around and off the coast of the Taranaki region (Figure 15). New Zealand has no facilities to import or export natural gas, which means that all natural gas produced in the country is used domestically, and that any decline in gas supply is met by a decline in demand. Most of the gas produced by these fields is injected into a transmission network that delivers gas to major centres in the North Island[8]. New Zealand’s only large-scale natural gas storage facility is at Ahuroa.
In New Zealand, natural gas is used for several applications, including:
- as a feedstock for chemical processes (that is, being used for its chemical properties, rather than being burned for energy)
- for electricity generation
- for high-temperature industrial process heat
- for operating boilers and heaters in hospitals, schools, and other large facilities
- for residential cooking and heating.
The largest user of natural gas in New Zealand is Methanex, which uses natural gas as both a feedstock to produce methanol and a source of energy. While some large users have direct connections to natural gas fields, most users draw natural gas from the transmission network.
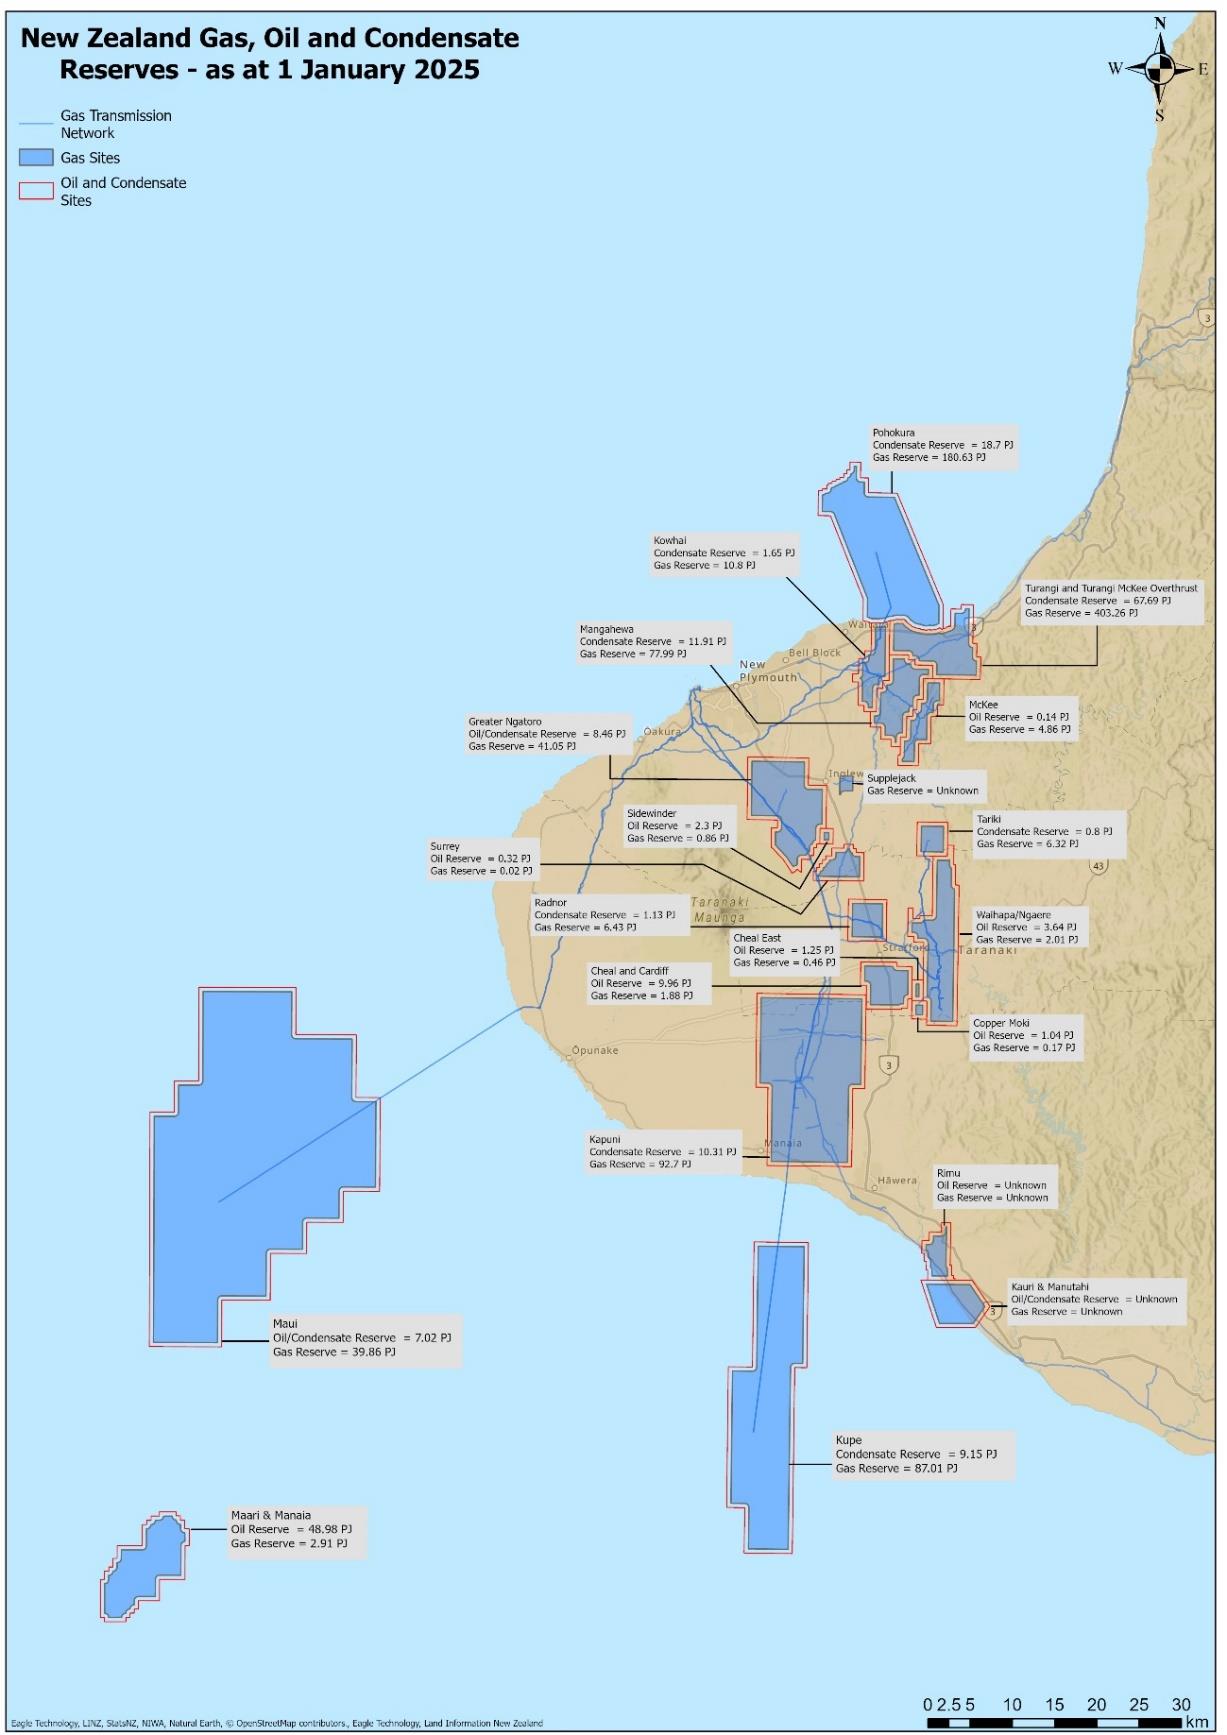
Figure 15. New Zealand’s active oil and gas fields, and their remaining reserves as at 1 January 2025.
View chart data for figure 15
New Zealand Gas, Oil and Condensate Reserves - as at 1 January 2025
Maui
- Oil/Condensate Reserves: 7.02 PJ
- Gas Reserves: 39.86 PJ
Maari & Manaia
- Oil Reserve: 48.98 PJ
- Gas Reserve: 2.91 PJ
Kupe
- Condensate Reserve: 9.15 PJ
- Gas Reserve: 87.01 PJ
Pohokura
- Condensate Reserve: 18.7 PJ
- Gas Reserve: 180.63 PJ
Kowhai
- Condensate Reserve: 1.65 PJ
- Gas Reserve: 10.8 PJ
Turangi and Turangi McKee Overthrust
- Condensate Reserve: 67.69 PJ
- Gas Reserve: 403.26 PJ
Mangahewa
- Condensate Reserve: 11.91 PJ
- Gas Reserve: 77.99 PJ
Greater Ngatoro
- Oil/Condensate Reserve: 8.46 PJ
- Gas Reserve: 41.05 PJ
McKee
- Oil Reserve: 0.14 PJ
- Gas Reserve: 4.86 PJ
Supplejack
Sidewinder
- Oil Reserve: 2.3 PJ
- Gas Reserve: 0.86 PJ
Tariki
- Condensate Reserve: 0.8 PJ
- Gas Reserve: 6.32 PJ
Surrey
- Oil Reserve: 0.32 PJ
- Gas Reserve: 0.02 PJ
Waihapa/Ngaere
- Oil Reserve: 3.64 PJ
- Gas Reserve: 2.01 PJ
Radnor
- Condensate Reserve: 1.13 PJ
- Gas Reserve: 6.43 PJ
Cheal East
- Oil Reserve: 1.25 PJ
- Gas Reserve: 0.46 PJ
Cheal and Cardiff
- Oil Reserve: 9.96 PJ
- Gas Reserve: 1.88 PJ
Copper Moki
- Oil Reserve: 1.04 PJ
- Gas Reserve: 0.17 PJ
Kapuni
- Condensate Reserve: 10.31 PJ
- Gas Reserve: 92.7 PJ
Rimu
- Oil Reserve: Unknown
- Gas Reserve: Unknown
Kauri & Manutahi
- Oil/Condensate Reserve: Unknown
- Gas Reserve: Unknown
Gas production drops below expected levels
Gas supply[9] for 2024 was 115.70 PJ, a decrease of 20.9% (29.04 PJ) on 2023 levels, mainly due to natural field decline. The most significant drops were observed for the Maui and Pohokura fields.
Gas field operators provide an expectation of future production through MBIE’s Petroleum Reserves[10], which considers natural field decline, expected levels of extraction, and field development projects. Gas production per field in 2024, compared against expected production as 1 January 2024, is shown in Figure 16. This shows that contributing to the drop in production was several fields not meeting their production expectations. This includes Kupe’s KS-9 well, which started production in January 2023 and was predicted to increase the field’s annual output by approximately 10 PJ. Additional reductions in production were the result of lower-than-expected deliverability from Maui and Pohokura fields, combined with several unplanned outages in 2024 (at the Kupe, Kapuni, Maui, and Pohokura fields).
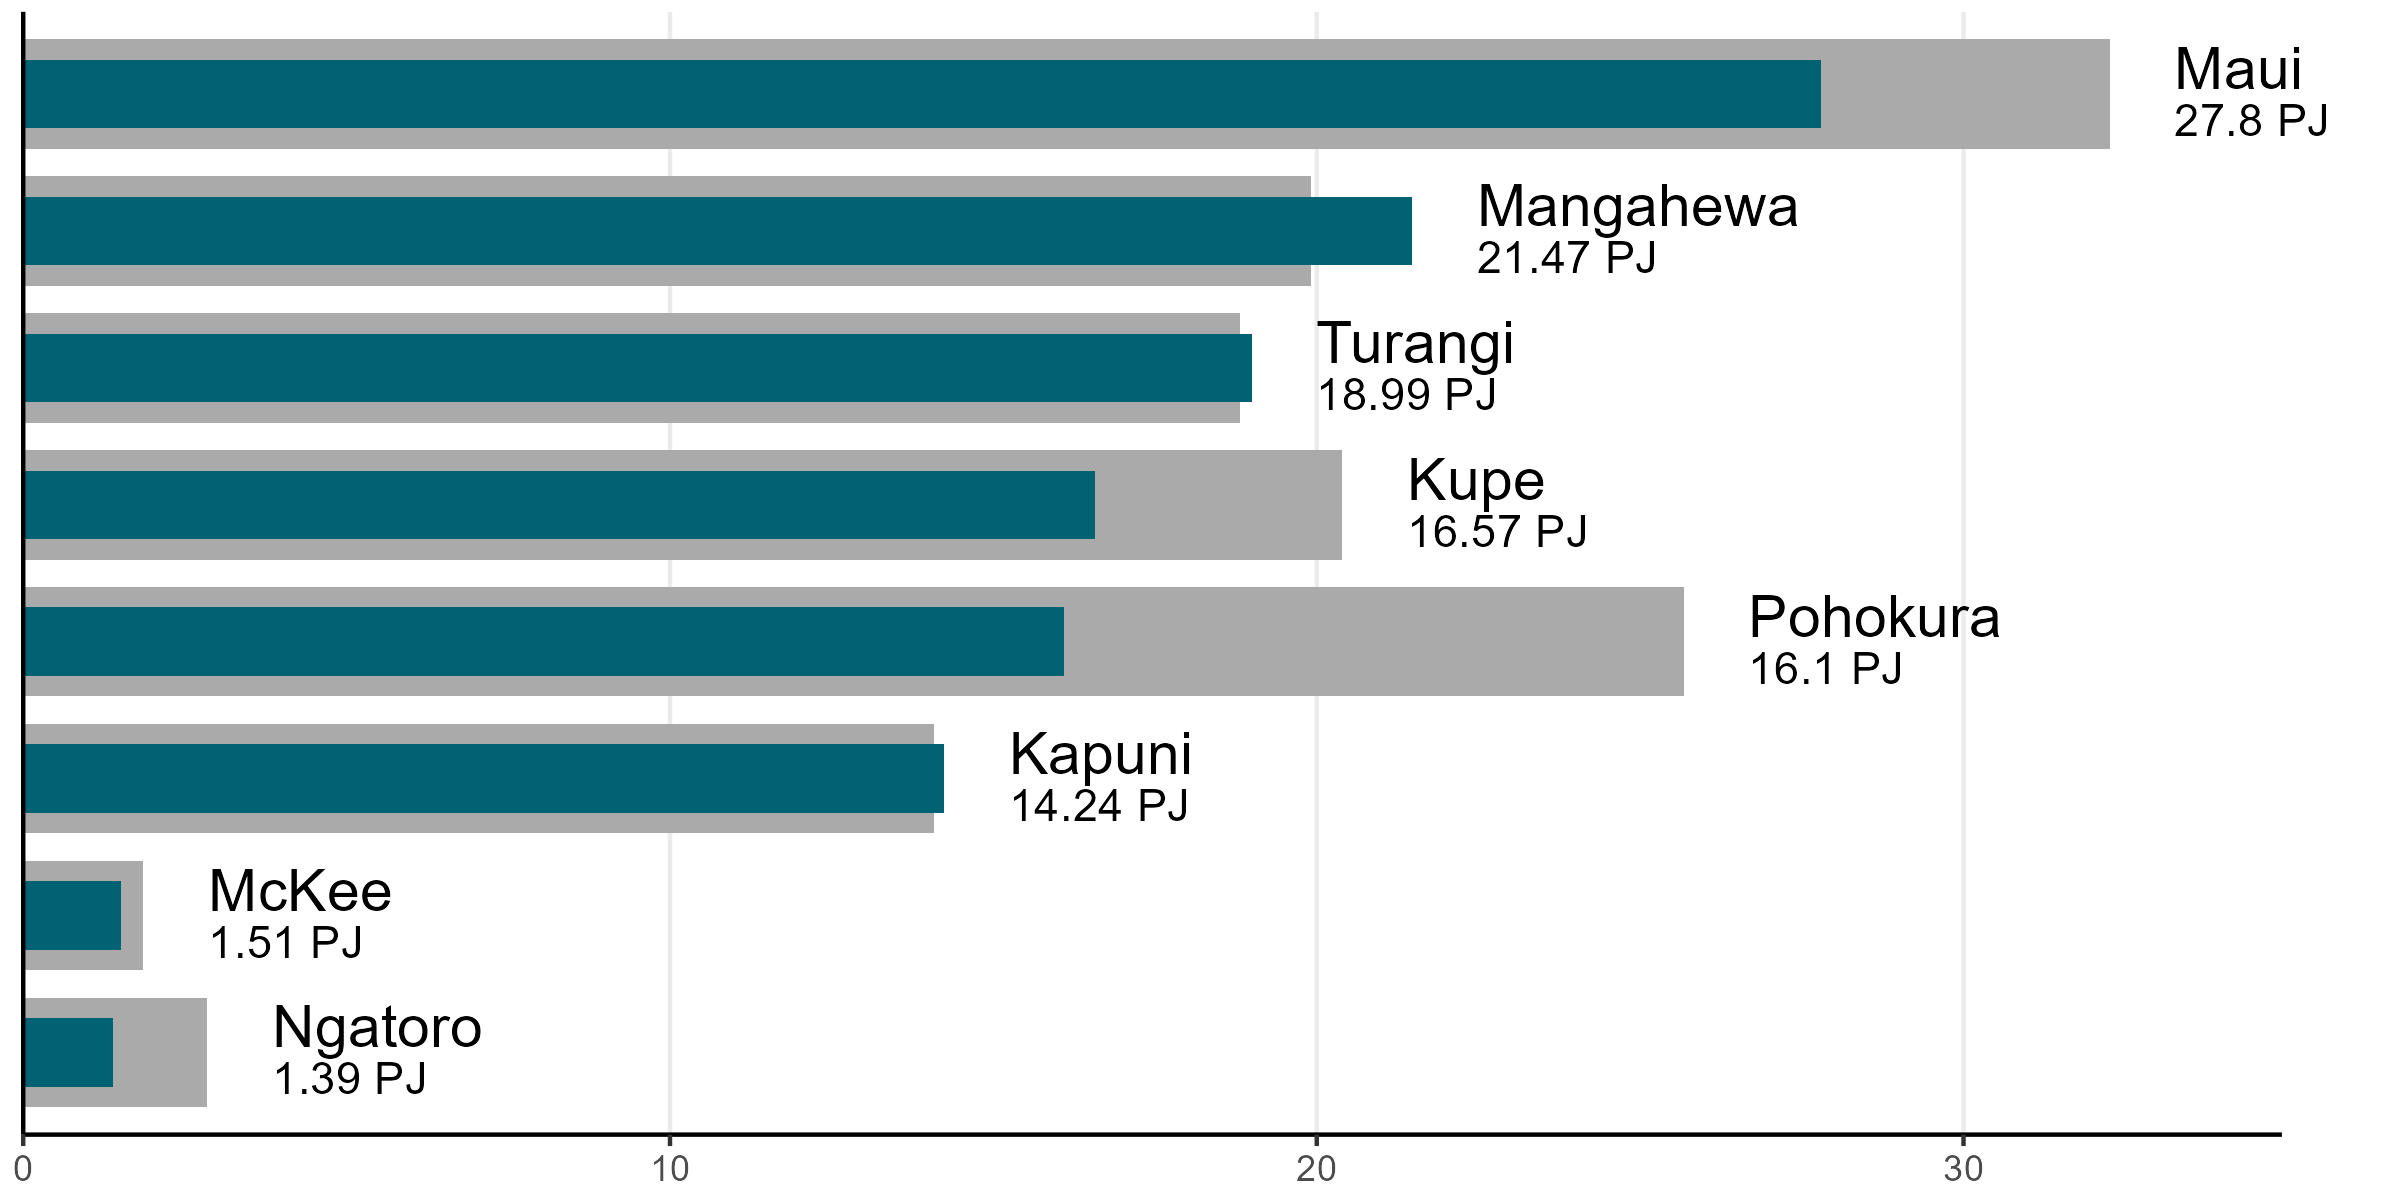
Figure 16. Natural gas net production (teal bars) versus predicted production from Petroleum Reserves as at 1 January 2024 (grey bars). Figures show actual production for 2024. Fields whose annual production was <1 PJ are not shown.
View chart data for figure 16
Table 16: Natural gas net production versus predicted production from Petroleum Reserves as at 1 January 2024. Figures show actual production for 2024. Fields whose annual production was <1 PJ are not shown
Field |
Actual production (PJ) |
Expected production (PJ) |
Kapuni |
14.23898995 |
14.08536583 |
Kupe |
16.56950251 |
20.39749011 |
Mangahewa |
21.47273788 |
19.91198177 |
Maui |
27.8009046 |
32.25968431 |
McKee |
1.512611554 |
1.859264273 |
Ngatoro |
1.38658083 |
2.845504969 |
Pohokura |
16.09587335 |
25.67375213 |
Turangi |
18.99194583 |
18.8083995 |
Gas users respond to lower supply
Total gas use in the economy (including use as a feedstock, energy use of gas, and gas use in electricity generation) was 117.73 PJ in 2024, a decrease of 22% on 2023 use (Figure 17). This decrease was driven mainly by a decrease in use at Methanex, which reduced its operations in response to low gas deliverability in early 2024 before idling its Motunui plant completely between August and October. This in turn freed up natural gas for use in electricity generation during the third quarter of 2024, when hydro inflows were particularly low.
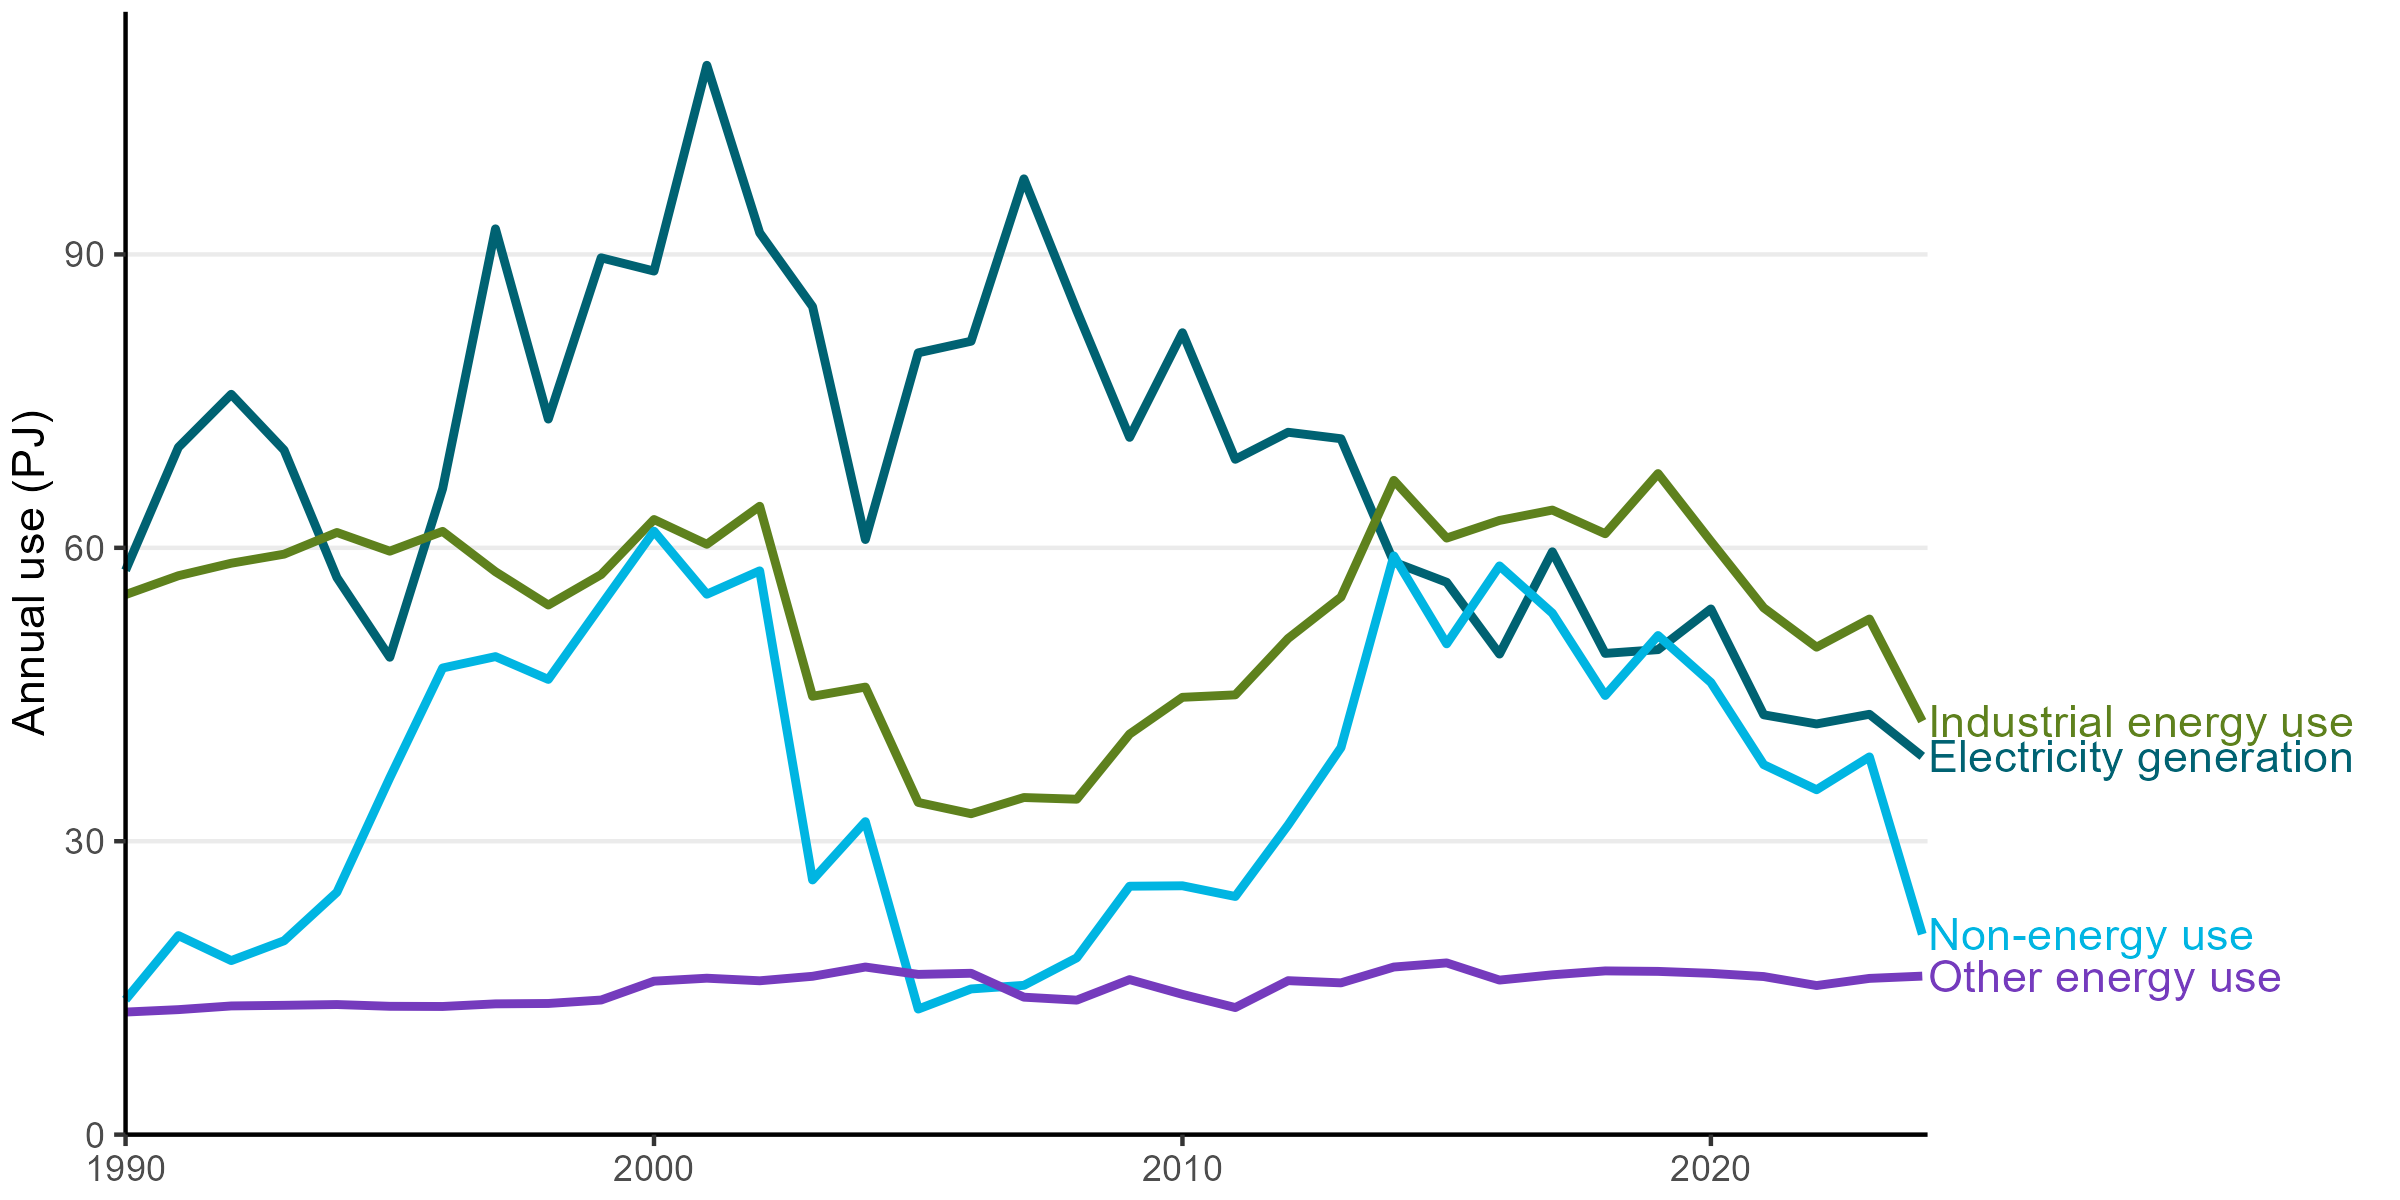
Figure 17. Natural gas use by sector over time. This plot does not show other transformation of gas, which was only prevalent until 1997.
View chart data for figure 17
Table 17: Natural gas use by sector over time. This plot does not show other transformation of gas, which was only prevalent until 1997
Year |
Electricity generation (PJ) |
Industrial energy use (PJ) |
Non-energy use (PJ) |
Other energy use (PJ) |
1990 |
57.7 |
55.2 |
13.8 |
12.5 |
1991 |
70.3 |
57.1 |
20.4 |
12.8 |
1992 |
75.7 |
58.4 |
17.8 |
13.2 |
1993 |
70 |
59.4 |
19.8 |
13.2 |
1994 |
57 |
61.6 |
24.8 |
13.3 |
1995 |
48.8 |
59.7 |
36.5 |
13.1 |
1996 |
66 |
61.7 |
47.7 |
13.1 |
1997 |
92.6 |
57.6 |
48.9 |
13.4 |
1998 |
73.2 |
54.2 |
46.5 |
13.4 |
1999 |
89.7 |
57.3 |
54.1 |
13.8 |
2000 |
88.3 |
62.9 |
61.7 |
15.7 |
2001 |
109 |
60.4 |
55.3 |
16 |
2002 |
92.2 |
64.3 |
57.6 |
15.7 |
2003 |
84.7 |
44.8 |
26 |
16.2 |
2004 |
60.8 |
45.8 |
32 |
17.1 |
2005 |
79.9 |
34 |
12.8 |
16.4 |
2006 |
81.1 |
32.8 |
14.9 |
16.5 |
2007 |
97.7 |
34.5 |
15.3 |
14.1 |
2008 |
84.3 |
34.3 |
18.1 |
13.8 |
2009 |
71.3 |
41 |
25.4 |
15.9 |
2010 |
82 |
44.7 |
25.4 |
14.3 |
2011 |
69.1 |
45 |
24.4 |
13 |
2012 |
71.8 |
50.7 |
31.7 |
15.7 |
2013 |
71.2 |
55 |
39.6 |
15.5 |
2014 |
58.5 |
66.9 |
59.2 |
17.1 |
2015 |
56.5 |
61 |
50.2 |
17.6 |
2016 |
49.1 |
62.8 |
58.2 |
15.8 |
2017 |
59.6 |
63.9 |
53.3 |
16.3 |
2018 |
49.2 |
61.4 |
44.9 |
16.7 |
2019 |
49.6 |
67.6 |
51 |
16.7 |
2020 |
53.8 |
60.7 |
46.2 |
16.5 |
2021 |
42.9 |
53.9 |
37.8 |
16.2 |
2022 |
42 |
49.8 |
35.3 |
15.2 |
2023 |
43 |
52.7 |
38.6 |
16 |
2024 |
38.7 |
42.3 |
20.5 |
16.2 |
Reserves data shows our gas supply is falling faster than previously expected
Natural gas reserves provide an indication of the amount of gas that can be extracted from existing gas fields[11]. New Zealand’s natural gas reserves as at 1 January 2025 were estimated to be 948 PJ, a drop of 27% on 1 January 2024 figures. While some of this drop was due to natural gas extracted for use over the course of 2024, around 66% of the drop is due to gas field operators revising their estimates of field reserves. This may occur, for example, when gas field operators perform more detailed surveys on reservoirs, or when development projects provide operators with a better idea of how much gas they are able to extract from a given reservoir.
Production profile data also indicates that production will continue to decrease year-on-year (Figure 18), with annual production likely dropping below 100 PJ in the next two years. This contrasts with previous production profiles, which had predicted an increase in production around 2025 as development projects were expected to mature (Figure 19). Since around 2020, this expected increase has been revised downward multiple times as new developments have failed to meet production expectations.
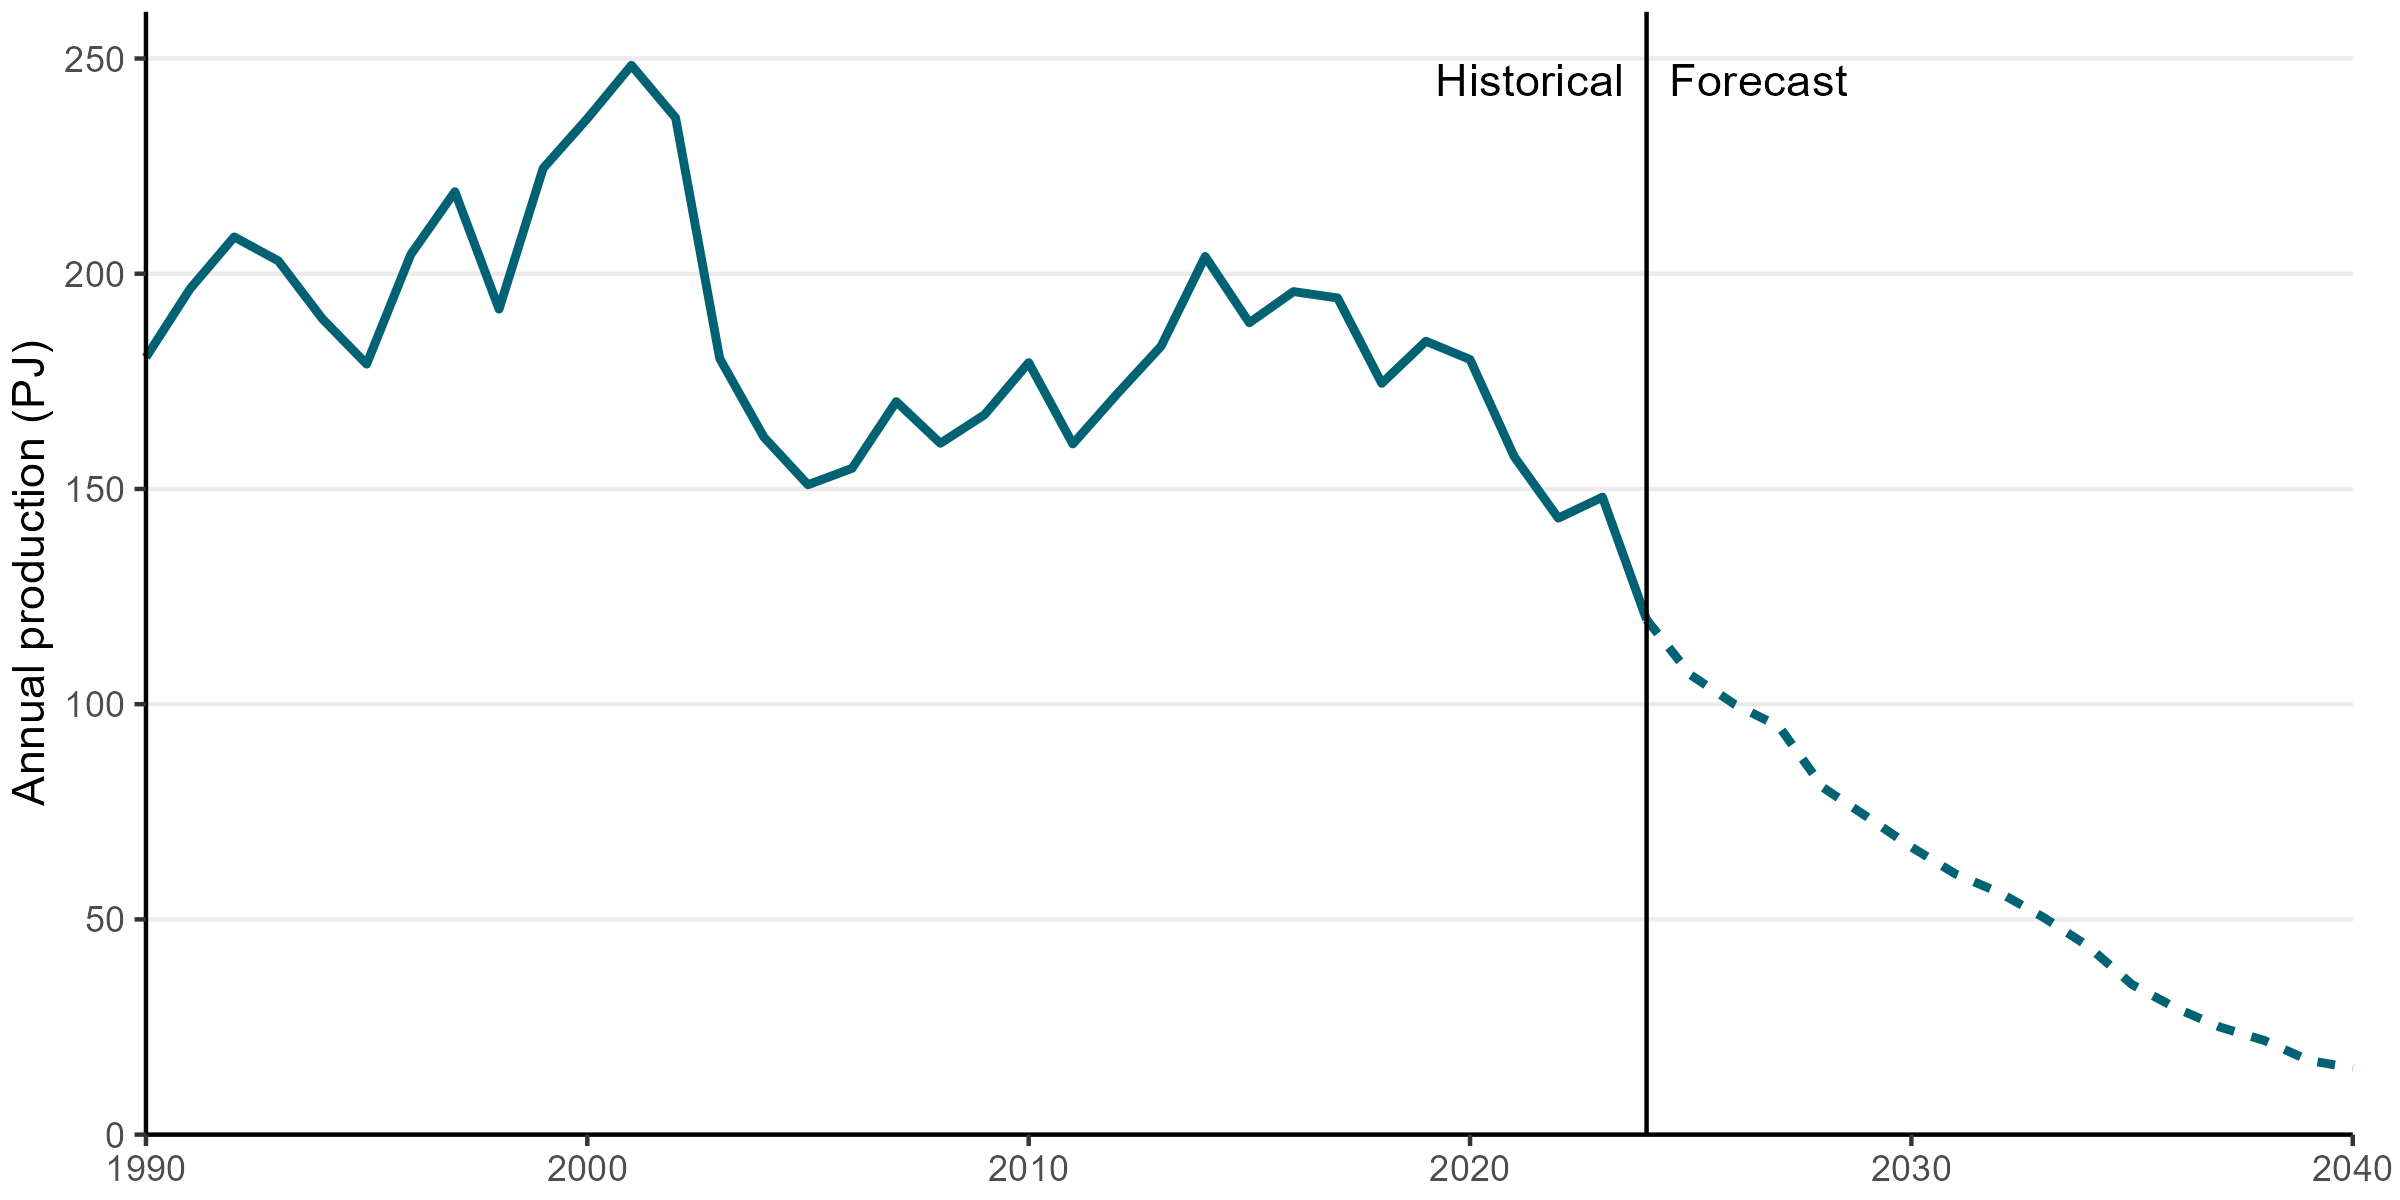
Figure 18. Gas net production (solid line) and forecast production (dashed line) based on production profile data.
View chart data for figure 18
Table 18: Gas net production and forecast production based on production profile data
Year |
Actual(PJ) |
Forecast(PJ) |
1990 |
180.583572 |
|
1991 |
196.503528 |
|
1992 |
208.551666 |
|
1993 |
202.98315 |
|
1994 |
189.498358 |
|
1995 |
179.003064 |
|
1996 |
204.454913 |
|
1997 |
219.06345 |
|
1998 |
191.77039 |
|
1999 |
224.496973 |
|
2000 |
236.046319 |
|
2001 |
248.425816 |
|
2002 |
236.226459 |
|
2003 |
180.303289 |
|
2004 |
162.050384 |
|
2005 |
150.972139 |
|
2006 |
154.801082 |
|
2007 |
170.297682 |
|
2008 |
160.603615 |
|
2009 |
167.240326 |
|
2010 |
179.340377 |
|
2011 |
160.454228 |
|
2012 |
172.03484 |
|
2013 |
183.153842 |
|
2014 |
204.007118 |
|
2015 |
188.609816 |
|
2016 |
195.848564 |
|
2017 |
194.366492 |
|
2018 |
174.535346 |
|
2019 |
184.317824 |
|
2020 |
180.081641 |
|
2021 |
157.525166 |
|
2022 |
143.220801 |
|
2023 |
148.102309 |
|
2024 |
119.635442 |
119.635442 |
2025 |
|
106.784057 |
2026 |
|
99.9532867 |
2027 |
|
94.8261588 |
2028 |
|
80.6162929 |
2029 |
|
73.7948692 |
2030 |
|
66.8060325 |
2031 |
|
60.5519692 |
2032 |
|
56.2105778 |
2033 |
|
50.4285432 |
2034 |
|
43.7994035 |
2035 |
|
34.862271 |
2036 |
|
29.3782561 |
2037 |
|
24.9561264 |
2038 |
|
21.8654801 |
2039 |
|
17.2464641 |
2040 |
|
15.4813259 |
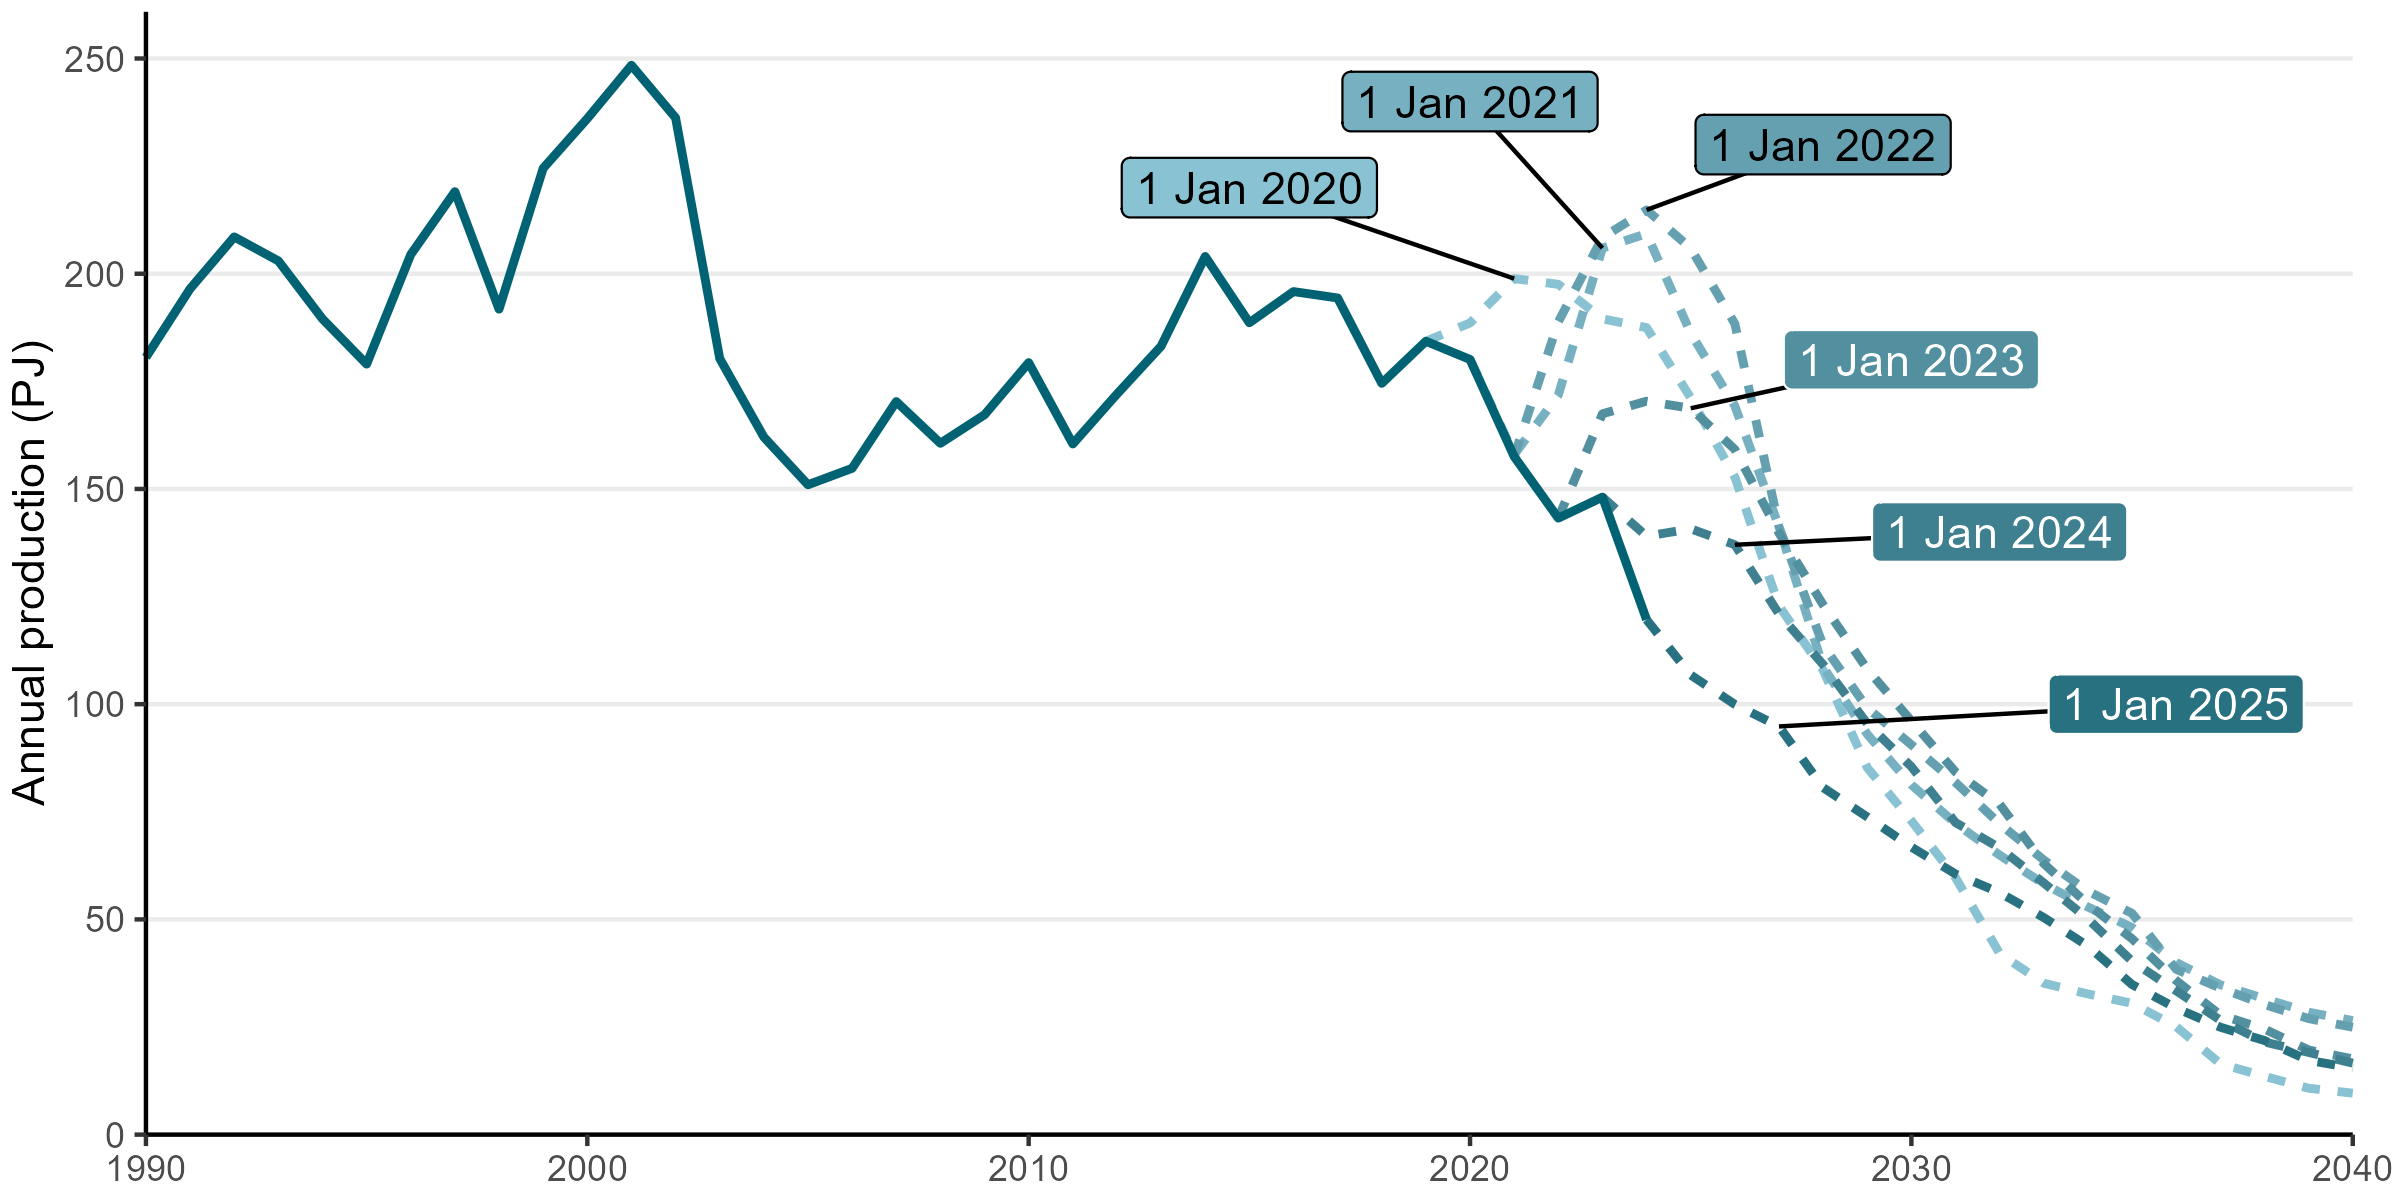
Figure 19. Gas production profiles as reported from 1 January 2020 through 1 January 2025.
View chart data for figure 19
Table 19: Gas production profiles as reported from 1 January 2020 through 1 January 2025
Year |
Actual(PJ) |
1 Jan 2020 Forecast(PJ) |
1 Jan 2021 Forecast(PJ) |
1 Jan 2022 Forecast(PJ) |
1 Jan 2023 Forecast(PJ) |
1 Jan 2024 Forecast(PJ) |
1 Jan 2025 Forecast(PJ) |
1990 |
180.583572 |
|
|
|
|
|
|
1991 |
196.503528 |
|
|
|
|
|
|
1992 |
208.551666 |
|
|
|
|
|
|
1993 |
202.98315 |
|
|
|
|
|
|
1994 |
189.498358 |
|
|
|
|
|
|
1995 |
179.003064 |
|
|
|
|
|
|
1996 |
204.454913 |
|
|
|
|
|
|
1997 |
219.06345 |
|
|
|
|
|
|
1998 |
191.77039 |
|
|
|
|
|
|
1999 |
224.496973 |
|
|
|
|
|
|
2000 |
236.046319 |
|
|
|
|
|
|
2001 |
248.425816 |
|
|
|
|
|
|
2002 |
236.226459 |
|
|
|
|
|
|
2003 |
180.303289 |
|
|
|
|
|
|
2004 |
162.050384 |
|
|
|
|
|
|
2005 |
150.972139 |
|
|
|
|
|
|
2006 |
154.801082 |
|
|
|
|
|
|
2007 |
170.297682 |
|
|
|
|
|
|
2008 |
160.603615 |
|
|
|
|
|
|
2009 |
167.240326 |
|
|
|
|
|
|
2010 |
179.340377 |
|
|
|
|
|
|
2011 |
160.454228 |
|
|
|
|
|
|
2012 |
172.03484 |
|
|
|
|
|
|
2013 |
183.153842 |
|
|
|
|
|
|
2014 |
204.007118 |
|
|
|
|
|
|
2015 |
188.609816 |
|
|
|
|
|
|
2016 |
195.848564 |
|
|
|
|
|
|
2017 |
194.366492 |
|
|
|
|
|
|
2018 |
174.535346 |
|
|
|
|
|
|
2019 |
184.317824 |
184.317824 |
|
|
|
|
|
2020 |
180.081641 |
188.56703 |
180.081641 |
|
|
|
|
2021 |
157.525166 |
198.871101 |
157.964388 |
157.525166 |
|
|
|
2022 |
143.220801 |
197.530069 |
171.80944 |
188.824785 |
143.220801 |
|
|
2023 |
148.102309 |
189.521098 |
205.968527 |
208.399203 |
167.460348 |
148.102309 |
|
2024 |
119.635442 |
187.477036 |
209.30955 |
214.824615 |
170.3844 |
139.022847 |
119.635442 |
2025 |
|
171.158402 |
186.183766 |
205.924493 |
168.742546 |
140.742069 |
106.784057 |
2026 |
|
152.759419 |
169.266749 |
188.373748 |
159.189885 |
137.032657 |
99.9532867 |
2027 |
|
122.846051 |
141.21551 |
141.19918 |
139.77316 |
120.940579 |
94.8261588 |
2028 |
|
107.898347 |
108.677406 |
113.677013 |
123.089929 |
109.201931 |
80.6162929 |
2029 |
|
85.2426514 |
93.025618 |
99.1254071 |
108.134716 |
95.4904594 |
73.7948692 |
2030 |
|
72.8969948 |
81.2727315 |
90.5698649 |
96.100396 |
85.4801472 |
66.8060325 |
2031 |
|
59.7097596 |
72.3045874 |
81.8079999 |
84.247057 |
72.4939016 |
60.5519692 |
2032 |
|
42.0682575 |
64.9314059 |
72.218553 |
76.7690996 |
66.6101978 |
56.2105778 |
2033 |
|
35.17823 |
58.2283912 |
63.7978124 |
62.9669861 |
58.4614329 |
50.4285432 |
2034 |
|
32.6787163 |
52.8762071 |
56.5572924 |
53.5025516 |
50.0883389 |
43.7994035 |
2035 |
|
30.504297 |
48.1103379 |
51.4004211 |
45.5005353 |
40.283413 |
34.862271 |
2036 |
|
25.0833654 |
39.9994223 |
38.4029771 |
35.7718187 |
33.4176843 |
29.3782561 |
2037 |
|
16.4581001 |
34.8006489 |
34.0392231 |
27.8004141 |
26.5708507 |
24.9561264 |
2038 |
|
13.539059 |
31.5901785 |
30.2352024 |
24.5277691 |
21.5173044 |
21.8654801 |
2039 |
|
10.7762515 |
28.4351263 |
26.9545377 |
19.6661808 |
19.0954648 |
17.2464641 |
2040 |
|
9.63071664 |
26.497669 |
24.9519781 |
17.5963504 |
16.6023701 |
15.4813259 |
Footnotes
[8] The South Island has no natural gas transmission network.
[9] Gas supply is equal to gross production minus gas reinjected, LPG extracted, gas flaring, and own use. It is a useful measure of the amount of produced which is available to the market.
[10] Petroleum reserves data
[11] All petroleum permit holders are required to submit data on remaining reserves as well as expected future production profiles (a forecast of annual production based on existing development plans and field data) to MBIE on an annual basis, and this data is published as MBIE’s Petroleum Reserves data.
Petroleum reserves data
< Coal | Oil >
Last updated: 21 August 2025