Our people
Everyone at MBIE contributes to delivering improved outcomes for New Zealanders. We want our people to reflect and support the communities we serve.
On this page I tēnei whārangi

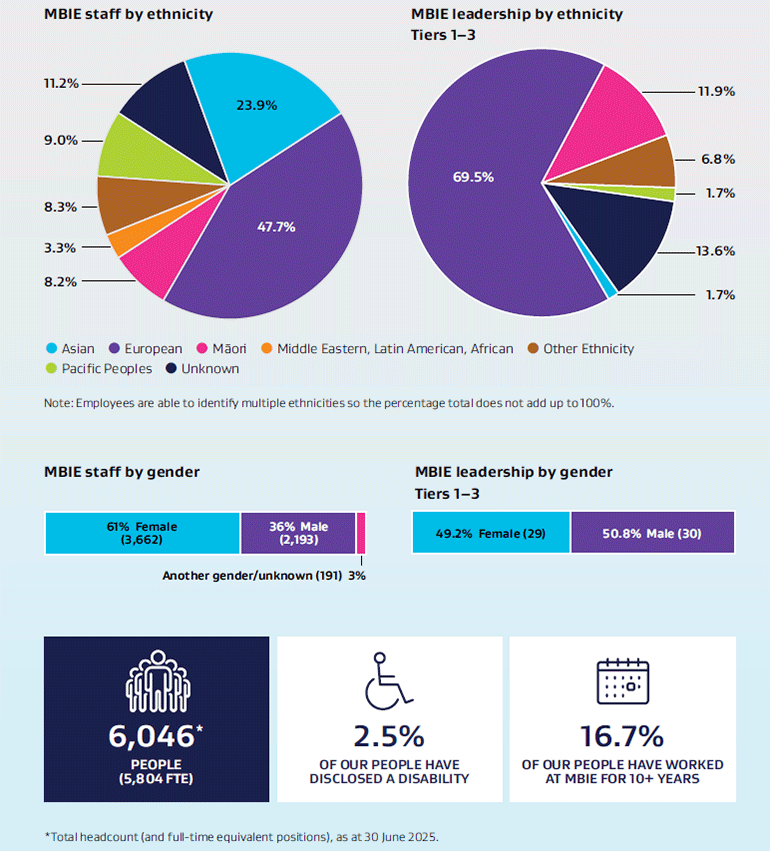
Text description for graph – MBIE staff by ethnicity
Text description for graph – Leadership by Ethnicity: Tiers 1 to3
Text description for infographic – MBIE staff by gender
Text description for infographic – Leadership by gender: Tiers 1 to 3
Text description for infographic – People working at MBIE
We are taking a streamlined and integrated approach to inclusion and belonging to make sure we are aligning with the evolving needs of our workforce while remaining fiscally responsible and operationally effective. Through People Experience Reports, our wider MBIE strategies and programmes of work, MyVoice employees’ surveys, workforce data and external benchmarks, we have gained important insights to ensure we remain grounded in evidence and are responsive to the needs of our workforce.
In aligning with Te Kawa Mataaho – Public Service Commission’s guidelines, MBIE combined its diversity, equity and inclusion work programme with Kia Tū Ranga, MBIE’s pay gap action plan, recognising the shared outcomes and strong connections between them.
MBIE’s gender pay gap has reduced and continues trending downwards. As of June 2025:
- 13.3% gender pay gap (a 0.9% decrease from the previous year)
- 4.3% pay gap for Māori (0.1% increase from the previous year)
- 19.6% pay gap for Pacific peoples (0.5% decrease from the previous year)
- 18.0% for Asian peoples (0.7% decrease from the previous year)
- 10.3% for Middle Eastern, Latin American and African peoples (2.1% decrease from the previous year).

