Ngā āhuatanga ohu mahi RSI | RSI Workforce characteristics
On this page
Ira tangata | Gender composition
The gender composition of the RSI workforce is unbalanced compared to the estimated gender composition of Aotearoa New Zealand. Around 58% (n=58,545, see Table 11 – Appendix D) of the RSI workforce identify as female, 41% (n=20,117) identify as male, and 1% (n=410) as another gender. The estimated split in the national population is 50% female and 50% male. This imbalance is driven by greater representation of women at TEIs (see Figure 1).
At ROs, the gender composition of the workforce is relatively balanced. However, as there are far more employees at TEIs than ROs (n=50,540 compared to 4,953), the overall skew of females outnumbering males in the RSI workforce is still present.
National population estimates: At 31 March 2022(external link) — Stats NZ
Figure 1: Employee numbers based on gender by headcount
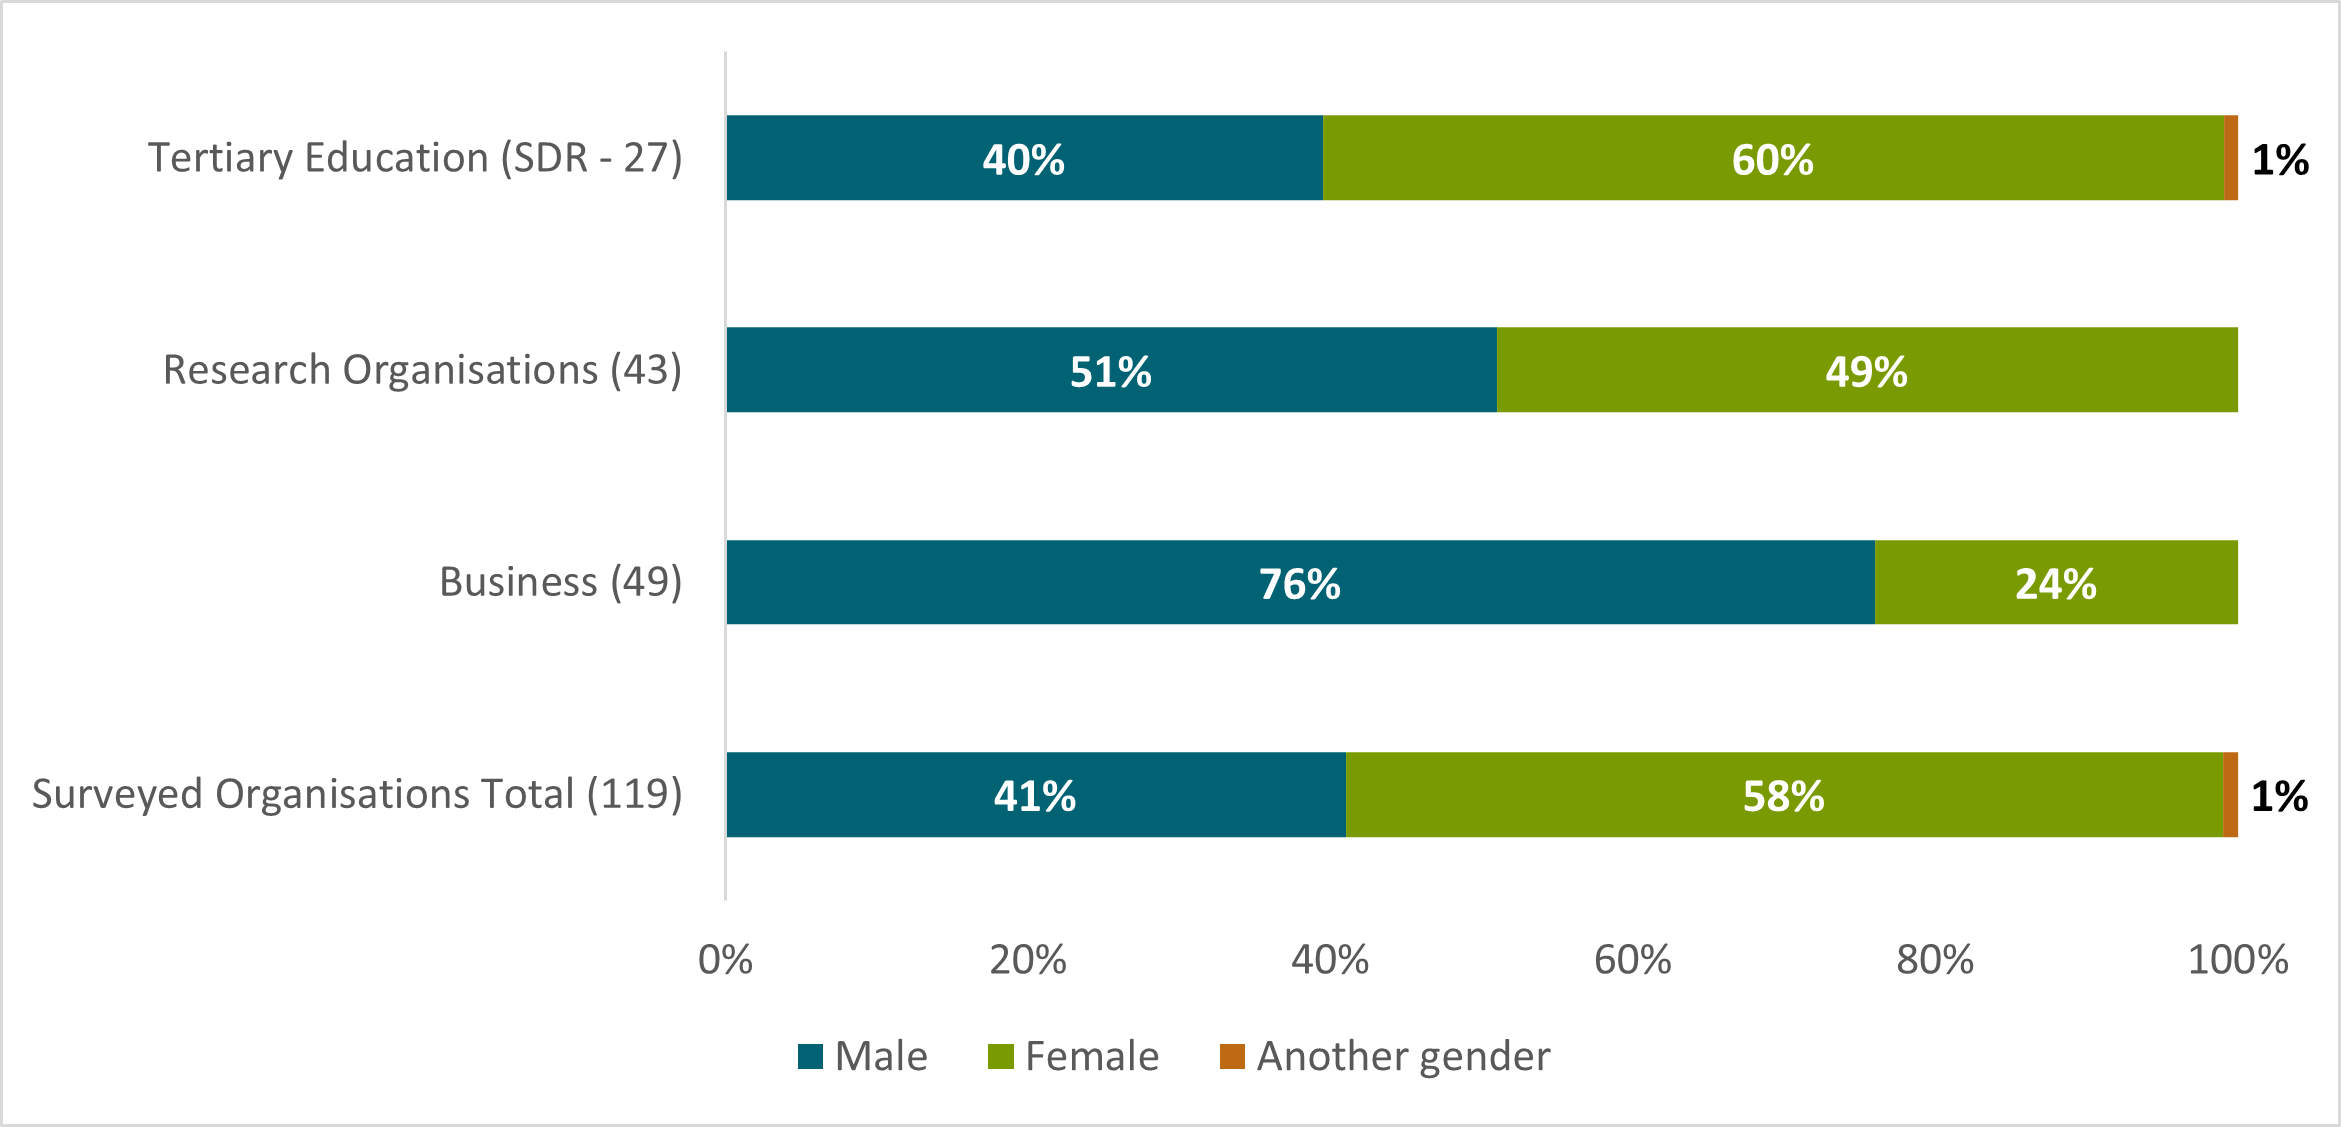
- 92 individual organisations responded to this question in the survey and 27 organisations were included in the MoE Single Data Return
- Data Sources: Workforce Organisations Survey and MoE Single Data Return
Text description of chart
Whānuitanga o ngā pakeke | Age composition
The age range of the RSI workforce is broad. A large majority of the workforce (66%, see Figure 2) are aged between 30 and 59 years. The RSI workforce is also generally older than the overall New Zealand workforce. This is mostly driven by far lower representation of people under the age of 30 years, who are 24% of the overall NZ workforce but only 16% of the RSI workforce. This difference is more marked at ROs, where employees under 30 years are only 10% of the workforce.
Furthermore, the RSI workforce has higher representation of those in the 30-49, 50-59, and 60-65 age categories versus the overall workforce. This may be partially driven by the higher qualification levels held by the RSI workforce, meaning that a higher proportion join the workforce at an older age after completing these qualifications. It may also be partially attributable to the tenured Professorships and Principal Investigator roles in universities and ROs respectively, which are generally not subject to age-related compulsory retirement.
Figure 2: Employee numbers based on age by headcount
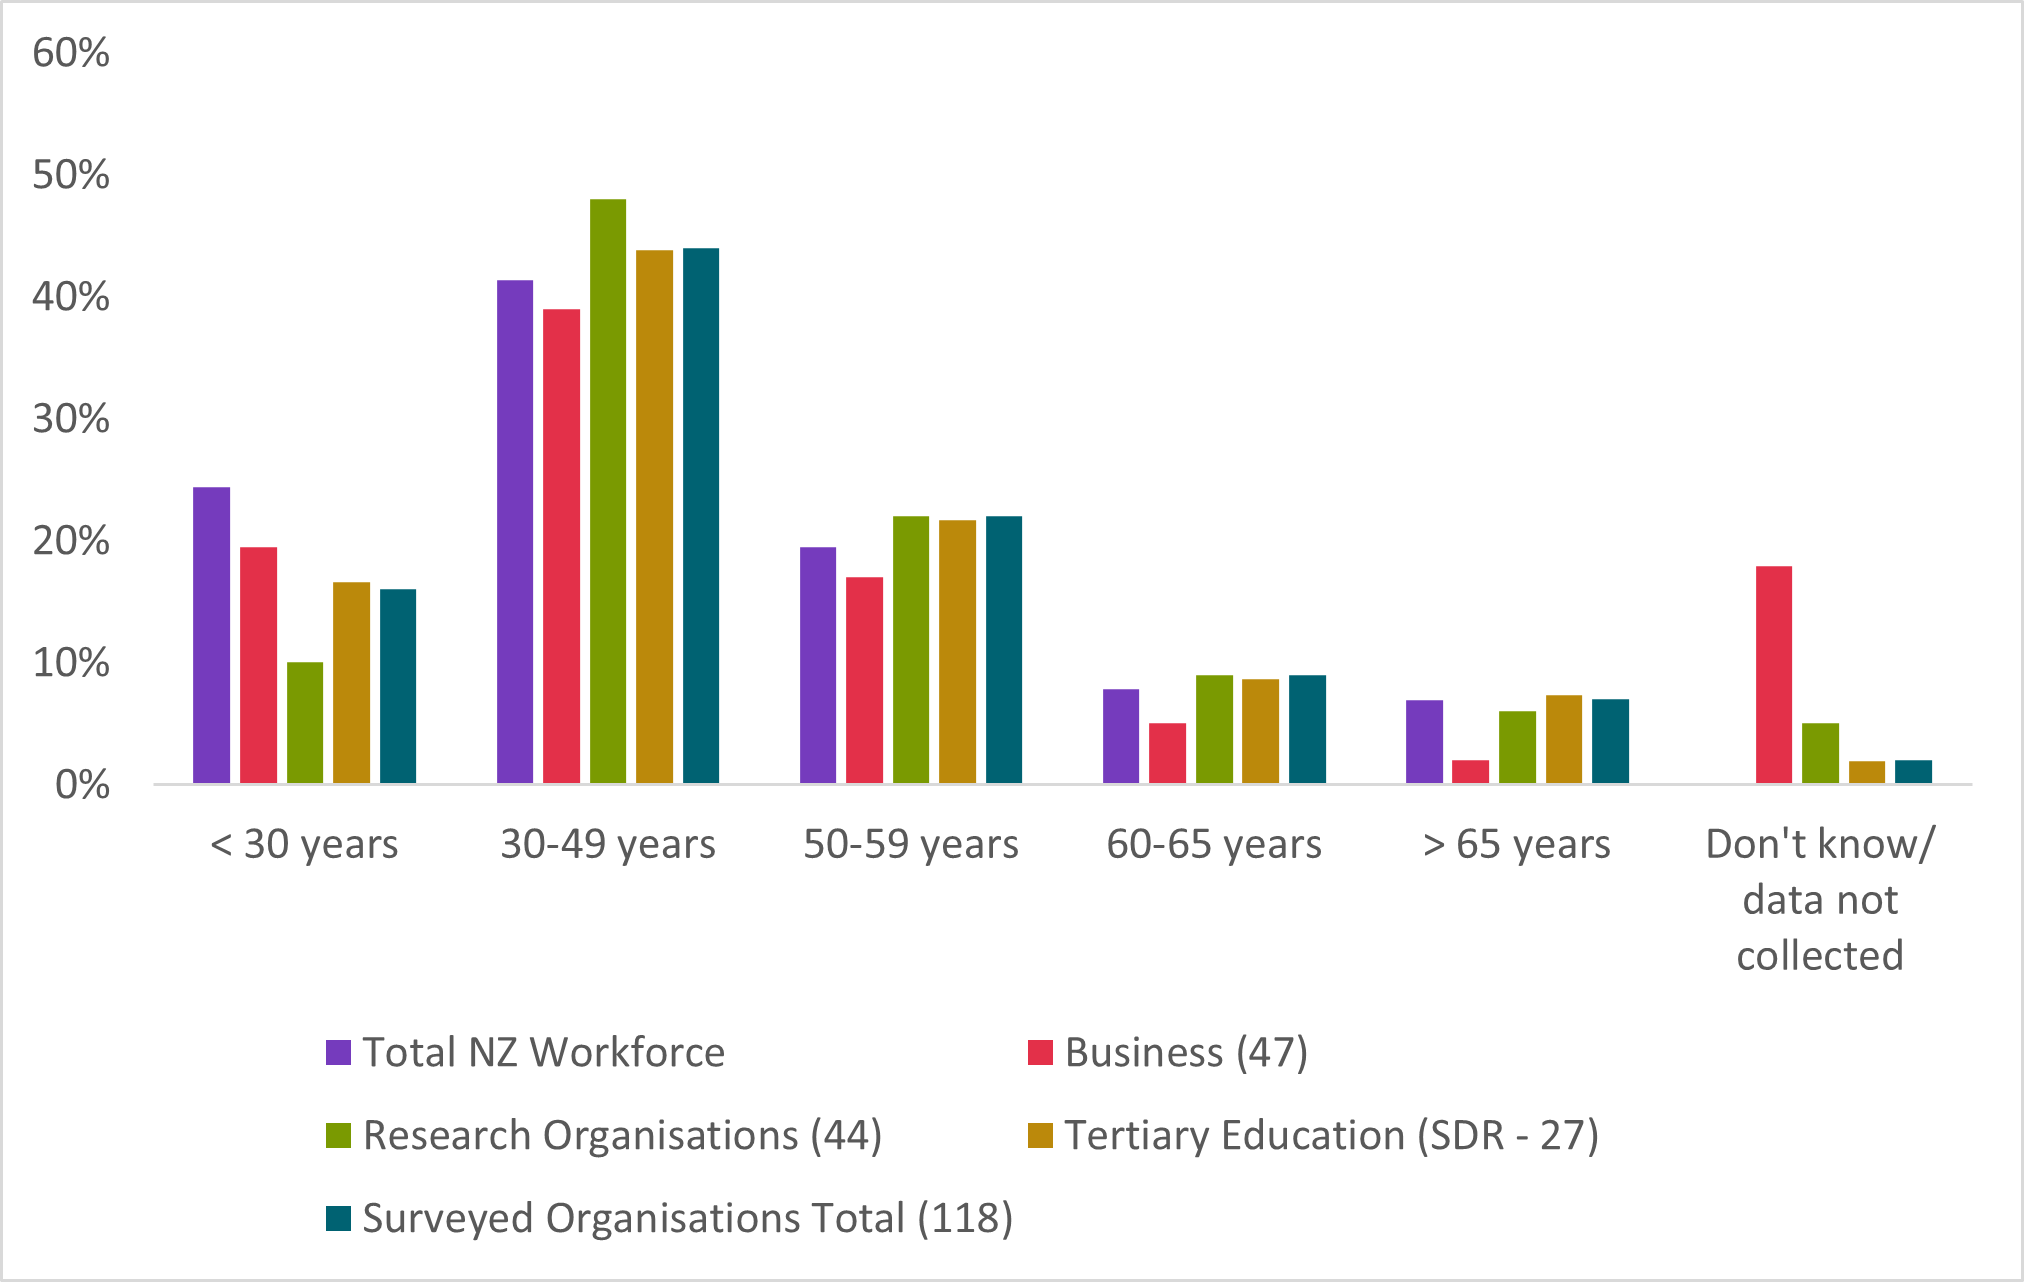
- 91 individual organisations responded to this question in the survey and 27 organisations were included in the MoE Single Data Return (SDR)
- The category of 30-49 years is merged to compare with the MoE Single Data Return data
- Data Sources: Workforce Organisations Survey, MoE Single Data Return, and Stats NZ Household Labour Force Survey.
Text description of chart
Ngā mātāwaka o te ohu mahi | Ethnicity of workforce
The RSI workforce is mostly European. Around 68% (n=2,961) of ROs’ employees are European, in line with the European population share of Aotearoa New Zealand (70% – figure 3). The representation of Europeans at TEIs appears significantly lower at 51% (n=26,085). However, most organisations reported that they do not know or collect ethnicity data for a significant proportion of their employees (16% (n=8,130) of RSI employees at TEIs, 9% (n=407) at ROs). This makes it difficult to make firm conclusions as to ethnicity distribution in the RSI workforce. For example, the proportion of European employees may be higher than just the European percentage suggests, although other ethnic groups may also be represented in “Don't know / data not collected”.
Māori are underrepresented in the RSI workforce across institutions, compared to the overall Māori population share of 17% (see Figure 3). Māori form 11% (n=5,620) of the workforce at TEIs. However, this is lower at universities, where Māori hold 6% (n=1,840) of positions. Māori are 5% (n=203) of RO employees and 3% (n=10) of Business employees.
Pacific Peoples are similarly underrepresented among the RSI workforce compared to their overall population share of 8%. Pacific Peoples hold 4% (n=2,090) of positions at TEIs, including 3% (n=915) of positions at universities, and just 1% of positions in both ROs (n=40) and Businesses (n=4).
Ngā tauwāhi o te ohu mahi | Location of the Workforce
The RSI workforce is concentrated in the main urban centres: Auckland (21%, n=3,830), Wellington (22%, n=4,110), and Canterbury (22%, n=3,961) (see Table 2). Wellington and Canterbury are overrepresented in comparison to their shares of the overall population, while Auckland is underrepresented. This is due to the concentration of universities and CRIs in these cities. Institutions with a strong workforce presence* in Wellington include Victoria University of Wellington (VUW), University of Otago, Massey University, the Institute of Geological and Nuclear Science (GNS) and the National Institute of Water and Atmospheric Research (NIWA). Institutions with a large workforce presence in Canterbury include the University of Canterbury, the University of Otago, Manaaki Whenua – Landcare Research and the New Zealand Institute for Plant and Food Research Limited (PFR) (all 7 CRIs have some staff in Canterbury). Auckland has significant numbers of staff from the University of Auckland, Auckland University of Technology (AUT), and PFR.
The large majority of RSI employees work in the North Island. Around 60% of RSI employees are located across the 9 regions of the North Island, compared to 40% across the 7 regions of the South Island. Therefore, a greater proportion of the RSI workforce work in the South Island when compared to the geographical location of the overall population, with 78% of the overall population living in the North Island, and 22% in the South Island.
*Over 150 employees working on research activities
Figure 3: Employee numbers based on ethnicity by headcount
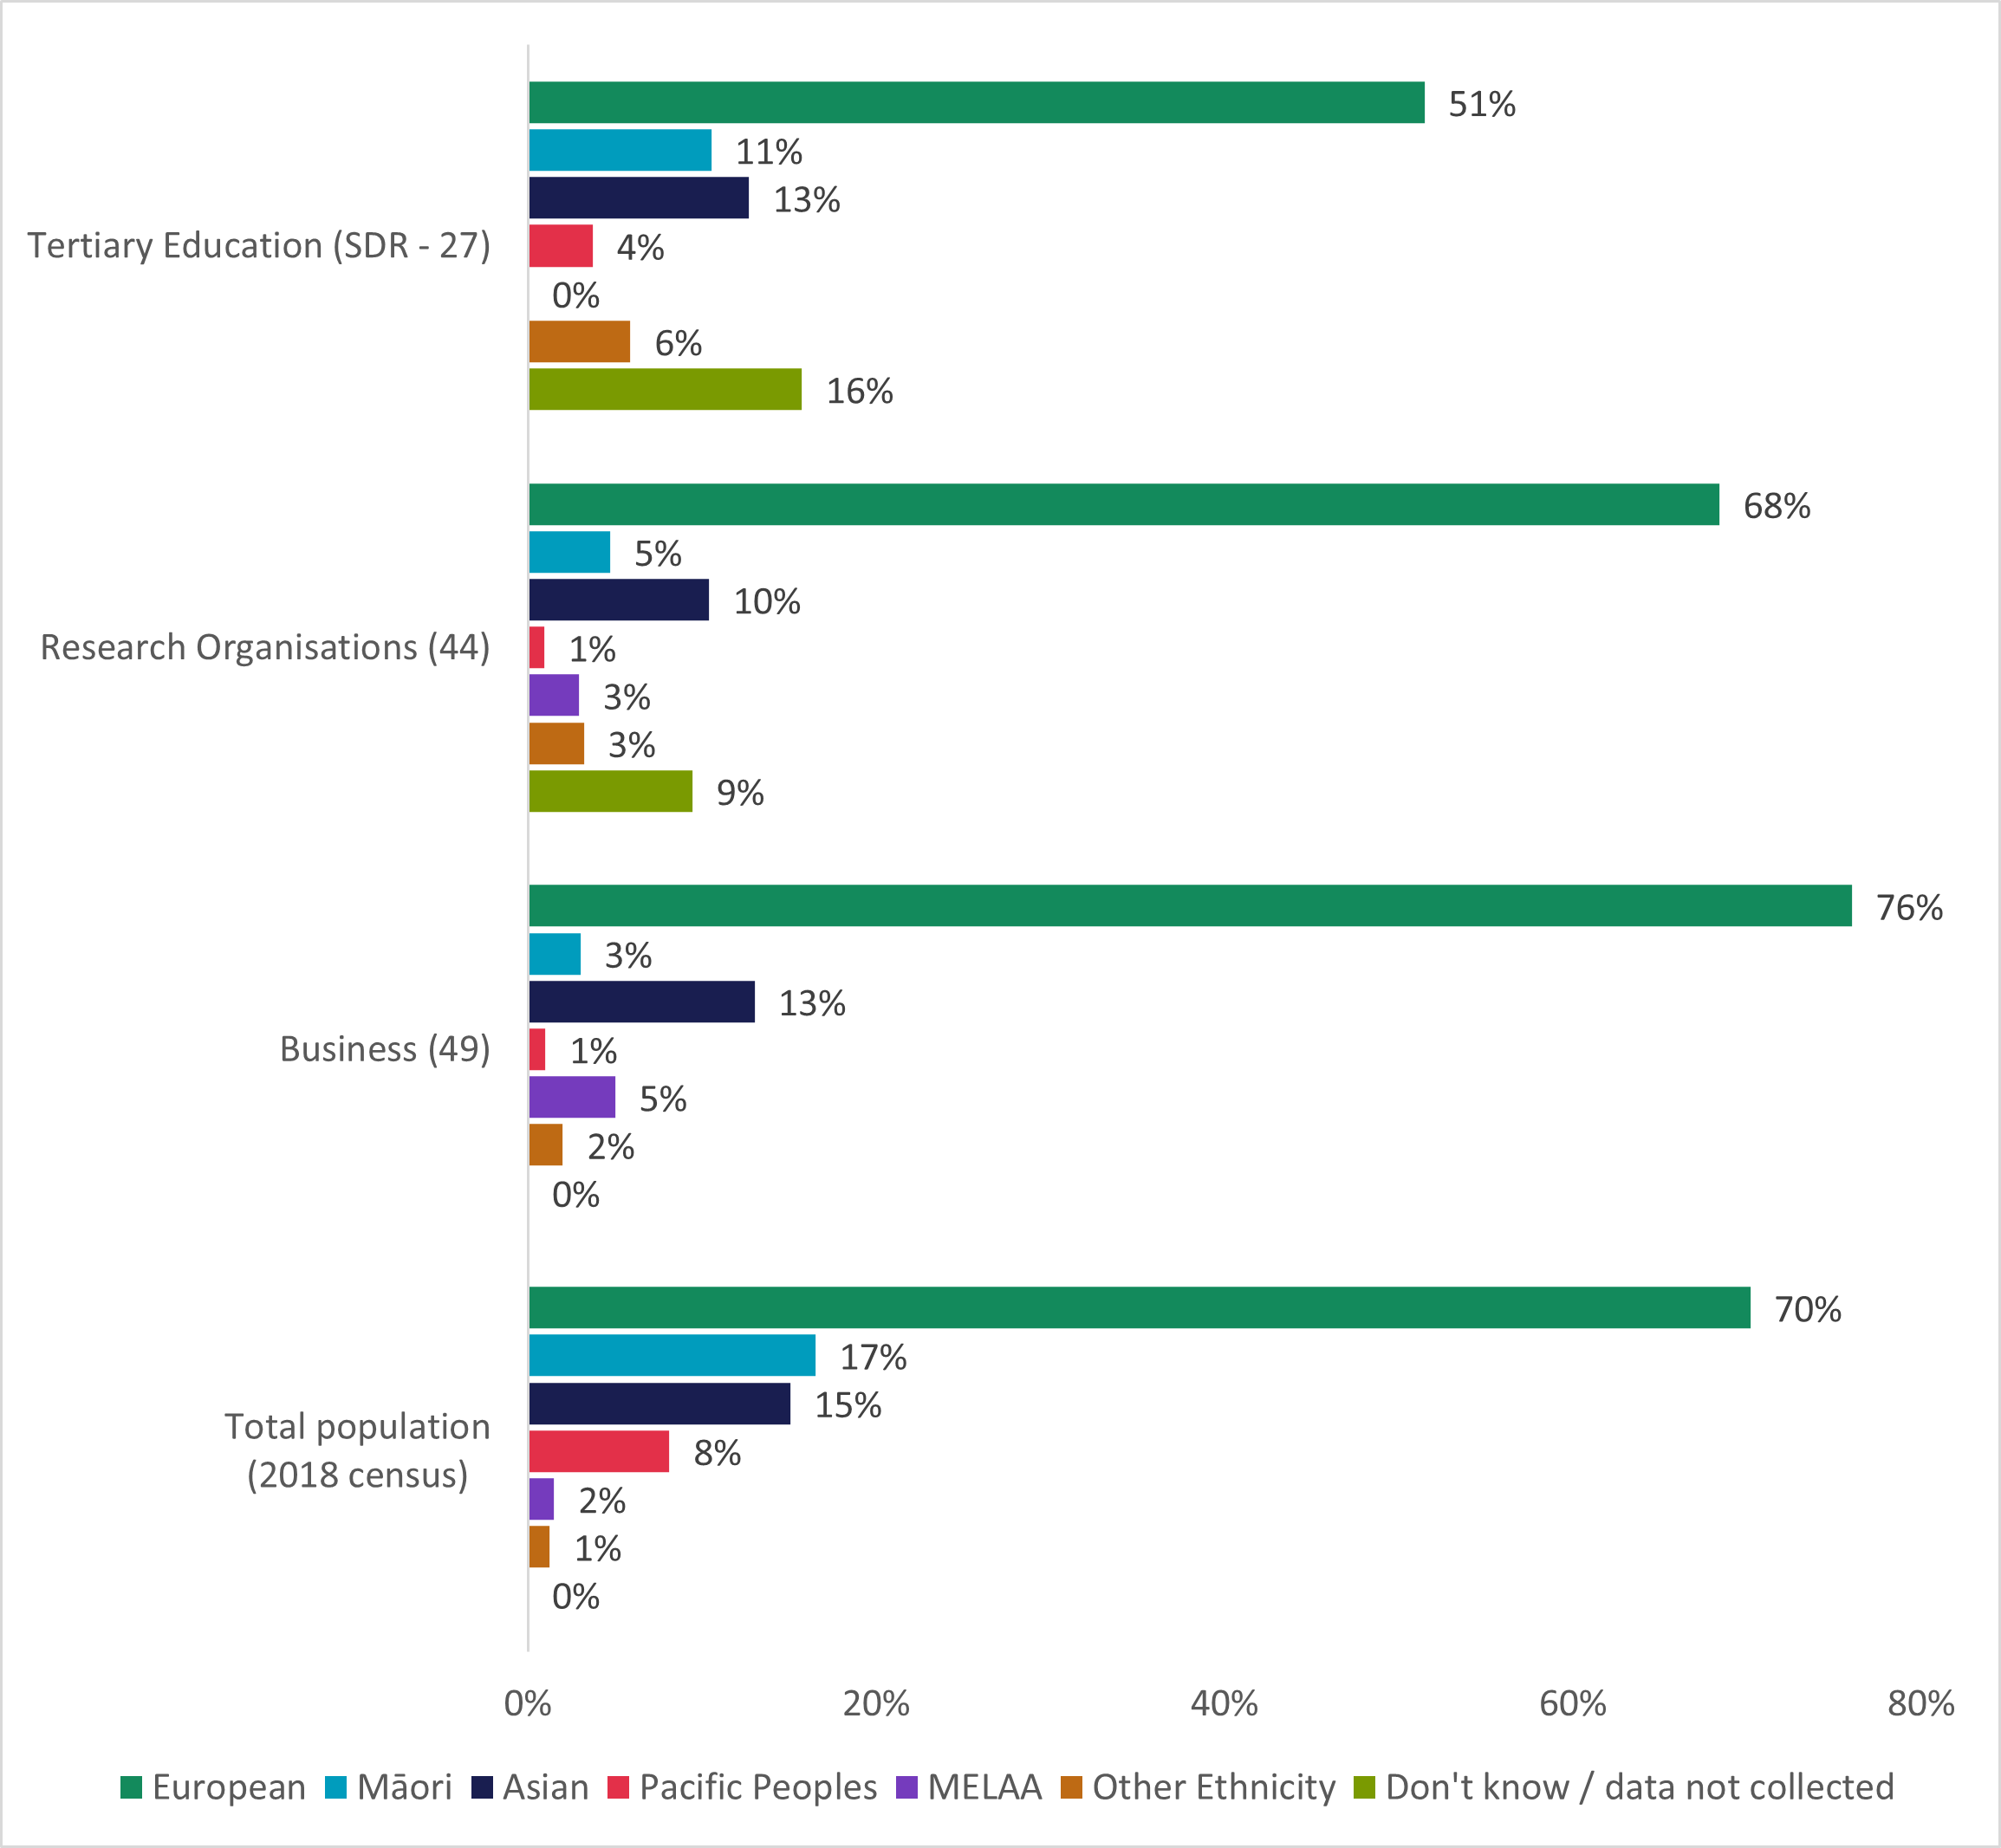
- 94 individual organisations responded to this question in the survey and 27 organisations were included in the MoE Single Data Return (SDR)
- Tertiary Education (SDR) MELAA included under ‘Other Ethnicity’
- Total Population for 2018 Census is calculated as 4,699,755 and this number is used when calculating percentages. As individuals can self-identify as more than one ethnicity, percentage adds up to more than 100%.
- Data Source: Workforce Organisations Survey, MoE Single Data Return, and 2018 New Zealand Census data.
Text description of chart
Table 2: Employee numbers regional distribution by headcount
| Regions | RSI Workforce | Total NZ population | ||
|---|---|---|---|---|
| Count | % | Count | % | |
| Te Whanganui-a-Tara / Wellington | 4,110 | 22% | 506,814 | 11% |
| Waitaha / Canterbury | 3,961 | 22% | 599,694 | 13% |
| Tāmaki Makaurau / Auckland | 3,830 | 21% | 1,571,718 | 33% |
| Ōtākou / Otago | 2,871 | 16% | 225,186 | 5% |
| Manawatū-Whanganui | 1,449 | 8% | 238,797 | 5% |
| Waikato | 1,086 | 6% | 458,202 | 10% |
| Te Moana-a-Toi / Bay of Plenty | 492 | 3% | 308,499 | 7% |
| Whakatū / Nelson | 288 | 2% | 50,880 | 1% |
| Te Matau-a-Māui / Hawke's Bay | 88 | 0% | 166,368 | 4% |
| Te Tai-o-Aorere / Tasman | 52 | 0% | 52,389 | 1% |
| Te Tai Tokerau / Northland | 49 | 0% | 179,076 | 4% |
| Taranaki | 33 | 0% | 117,561 | 3% |
| Wairau / Marlborough | 33 | 0% | 47,340 | 1% |
| Murihiku / Southland | 8 | 0% | 97,467 | 2% |
| Tūranganui-a-Kiwa / Gisborne | 6 | 0% | 47,517 | 1% |
| Te Tai Poutini / West Coast | 5 | 0% | 31,575 | 1% |
| Ahitereiria / Australia | 22 | 0% | N/A | N/A |
| Ngā Moutere o te Moananui-a-Kiwa / Pacific Islands | 0 | 0% | N/A | N/A |
| I tāwāhi (hāunga a Ahitereiria me ngā Moutere o te Moananui-a-Kiwa) / Outside New Zealand (not Australia or the Pacific) | 30 | 0% | N/A | N/A |
| Total | 18,413 | 100% | 4,699,755 | 100% |
- 99 organisations responded to this question
- Data Sources: Workforce Organisations Survey and NZ Census 2018.
- Total Population for 2018 Census is calculated as 4,699,755 and this number is used when calculating percentages. The sum of NZ population across regional areas do not equal this value as the total includes population for areas outside region.
Ngā momo tūranga | Role types
The largest category of RSI employees at ROs is research staff, forming 44% of RSI employees (n=2,227, see Table 3). Only a small number of RSI employees at ROs work in Commercialisation roles, forming 7% (n=356) of RSI employees.
Data on role types from TEIs was collected through the MoE SDR, so the same level of detail is not available for these institutions. The number of staff focussed specifically on research at TEIs is relatively small, compared with the total number of employees at these institutions. Research staff hold 9% (n=4,320) of roles at TEIs, compared to 45% of roles at ROs.*
*‘Research staff' includes research-only staff, research fellows, post-doctoral research fellows and other research support staff.
Table 3: Employee by role type in research organisations
| Role type | Research organisations | |
|---|---|---|
| Count | % | |
| Senior leadership/Management | 219 | 4% |
| Research staff | 2,227 | 44% |
| Technical staff | 1,307 | 26% |
| Support staff | 813 | 16% |
| Commercialisation staff | 356 | 7% |
| Other | 47 | 1% |
| Don't know / data not collected | 130 | 3% |
| Total | 5,099 | 100% |
- 41 research organisations responded to this question
- Data Source: Workforce Organisations Survey.
However, the total number of research staff at TEIs is greater than the total number of research staff at ROs by 2,093 employees. Additionally, university academic staff normally commit some of their time to research activities, typically 40%. Therefore, we can assume that around 2,950 FTE of university academic staff is committed to research activities.* This figure does not include contributions from non-academic staff, under which important research roles, such as technicians, are categorised. Additionally, due to lack of information, we have not made any assumptions about the proportion of time spent on research activities by academic staff at other TEI types.
Women are underrepresented in senior leadership, research staff, and commercialisation staff roles at ROs relative to population share (see Table 5). Māori and Pacific Peoples are underrepresented across all role types at ROs relative to population share.
* Total university academic staff FTE is 7,380.
Table 4: Employee by role type in tertiary education institutions
| Role type | Tertiary education (headcount) | Tertiary education (FTE) | ||
|---|---|---|---|---|
| n | % | n | % | |
| Total academic staff | 17,385 | 40% | 12,460 | 40% |
| Total research staff | 4,320 | 10% | 2,645 | 8% |
| Total non-academic staff | 21,980 | 50% | 16,280 | 52% |
| Total | 43,685 | 100% | 31,385 | 100% |
- 1. 27 tertiary education institutions responded to this question via the SDR
- Academic staff includes deans, heads of department, professors, associate professors, senior lecturers, principal lecturers, lecturers, senior tutors, tutors, tutorial assistants, teaching staff and other academic staff. Note that academic designations vary by provider type
- Non-academic staff includes executives, advisors, technicians, librarians, administrators and general services staff
- Data Source: MoE Single Data Return.
Ngā wāhi rangahau | Research areas
We collected information on research areas for female, Māori, and Pacific members of the RSI workforce*. Research at ROs is more focussed on science than at TEIs.
This is unsurprising given the wider scope of TEIs and the more targeted interests of CRIs. See glossary of terms at Appendix B for definitions of research areas.
Female researchers are focussed on science research (65%, n=1,349) at ROs, compared to at TEIs where they are focused in Arts and Social Sciences (25%, n=1,647), Health Sciences (29%, n=1,849), and Science (20%, n=1,324) (see Table 6).
As with female researchers, the majority of Māori researchers at ROs are focussed on science research (63%, n=114). Māori researchers at TEIs are focussed on Arts and Social Sciences (36%, n=283) and Health Sciences (23%, n=181).
Pacific researchers at ROs are focussed on Health Sciences (25%, n=10) and Science research (40%, n=16). Pacific researchers at TEIs are focussed on Arts and Social Sciences (39%, n=103) and Health Sciences (29%, n=77).
*This data was not collected for the overall RSI workforce.
Table 5: Key interest groups by role type at ROs, including comparison to population share
| Role type | RSI Workforce | Female | Māori | Pacific Peoples | ||||||
|---|---|---|---|---|---|---|---|---|---|---|
| n | % | Variation | n | % | Variation | n | % | Variation | ||
| Senior Leadership/ Management | 219 | 71 | 32% | -19% | 15 | 7% | -10% | 3 | 1% | -7% |
| Research staff | 2,227 | 957 | 43% | -7% | 69 | 3% | -14% | 18 | 1% | -7% |
| Technical staff | 1,307 | 707 | 54% | 3% | 54 | 4% | -13% | 13 | 1% | -7% |
| Support staff | 813 | 515 | 63% | 13% | 53 | 7% | -10% | 12 | 1% | -7% |
| Commercialisation staff | 356 | 107 | 30% | -5% | 6 | 2% | -14% | 3 | 1% | -7% |
| Other | 47 | 17 | 36% | -10% | 0 | 0% | -17% | 0 | 0% | -8% |
| Don't know / data not collected | 130 | 85 | 65% | 14% | 0 | 0% | -17% | 0 | 0% | -8% |
| Total | 5,099 | 2,459 | 197 | 49 | ||||||
- 108 organisations responded to this question
- Note: Variations are calculated by comparing with the proportion of New Zealand population according to Stats NZ 2018 Census Data (Female = 51%, Māori = 17%, Pacific Peoples = 8%)
- Data Source: Workforce Organisations Survey.
Table 6: Employees from key interest groups working in research areas by organisation type
| Research areas | Female | Māori | Pacific Peoples | |||
|---|---|---|---|---|---|---|
| RO | TEI | RO | TEI | RO | TEI | |
| Arts and Social Sciences | 53 | 1,647 | 17 | 283 | 5 | 103 |
| Engineering and Computing | 73 | 401 | 6 | 66 | 2 | 8 |
| Health Sciences | 244 | 1,859 | 13 | 181 | 10 | 77 |
| Law and Business | 76 | 718 | 8 | 72 | 0 | 37 |
| Science | 1,349 | 1,324 | 114 | 111 | 16 | 21 |
| Other | 290 | 538 | 24 | 86 | 7 | 17 |
| Total | 2,085 | 6,487 | 182 | 799 | 40 | 263 |
- 59 organisations responded to this question
- Data Source: Workforce Organisations Survey.
Ngā whakariteritenga tukumahi | Employment arrangements
Organisations were asked to provide information on employment arrangements for their employees. Additional information on the different forms of employment arrangement can be found at Appendix B. The majority of contracts are permanent across the RSI system (57%, n=10,240), with temporary contracts (fixed-term and casual) forming 41% (n=7,415) of total contracts.
The difference in the makeup of employment arrangements between organisation types is marked. The proportion of permanent contracts across the RSI workforce is driven by employment arrangements at TEIs where 45% (n=3,703) of RSI employees are on permanent contracts (see Figure 4).
Temporary (fixed-term/casual) employment arrangements are more concentrated for ECRs at research organisations, and for women, Pacific Peoples and ECRs at TEIs (see Table 7).
Figure 4: Employment agreement types by organisation type
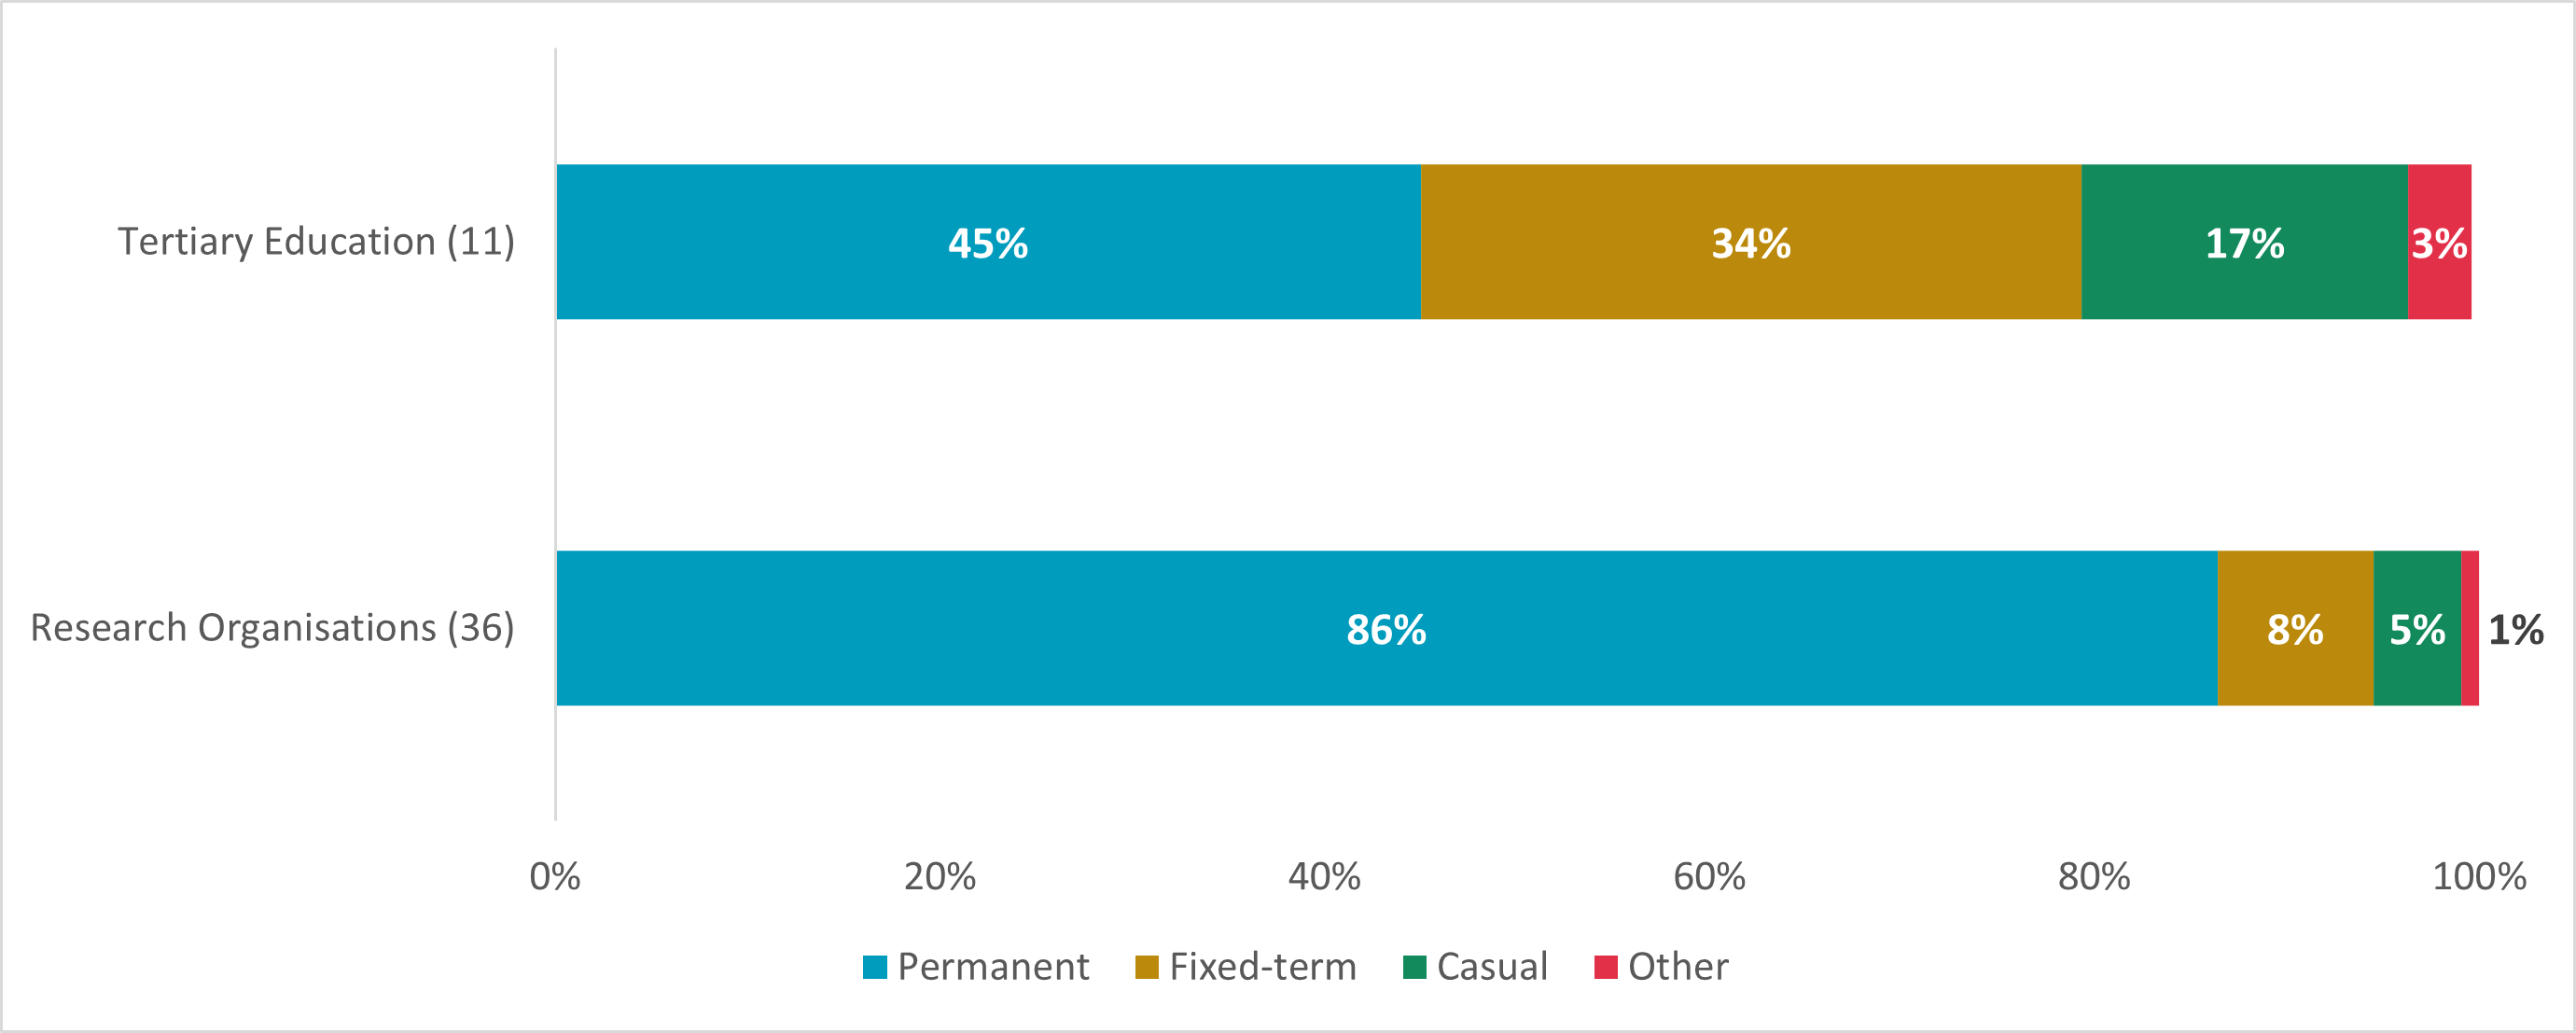
- 47 organisations responded to this question
- Data Source: Workforce Organisations Survey.
Text description of chart
Table 7: Employment agreement types for key interest groups by organisation type
| Research Areas | Female | Māori | Pacific Peoples | Early Career Researchers | ||||
|---|---|---|---|---|---|---|---|---|
| RO | TEI | RO | TEI | RO | TEI | RO | TEI | |
| Permanent | 84% | 42% | 85% | 46% | 85% | 37% | 80% | 41% |
| Fixed-term | 10% | 37% | 10% | 37% | 15% | 34% | 17% | 38% |
| Casual | 5% | 19% | 5% | 16% | 0% | 27% | 3% | 20% |
| Other | 1% | 2% | 0% | 1% | 0% | 2% | 1% | 1% |
| Total | 100% | 100% | 100% | 100% | 100% | 100% | 100% | 100% |
- 80 organisations responded to this question
- Data Source: Workforce Organisations Survey.