Te whakatau i te āhua o tā mātou kōpaki tūāhanga rangahau | Characterising our research infrastructure portfolio
On this page
Research infrastructure is a key aspect of research capability — it enables research. In order to understand the capabilities of research and science in Aotearoa, we need to understand the infrastructure that underlies and enables it. This section characterises the research infrastructure portfolio across the institutions. We note that this is a summary of infrastructure reported through the Kitmap survey, and reflects those held by the institutions at a given point in time. They do not reflect the future strategy or direction of infrastructure holdings or utilisation requirements of the institutions.
Institutions identified 493 different research infrastructures
In characterising the infrastructure, we look to the type of infrastructure and the trends across the institutions to see which types are most heavily invested in. This section also provides an indication of the scale of this infrastructure portfolio through counts of infrastructure and collections, broken down by institution. From this characterisation we can build a picture of the capabilities these institutions provide, enabled by their infrastructure investments.
Table 1: Number of platforms, infrastructures, and resources at each institution
| Total | 98 | 493 | 1,444 | 415,526 |
| Platforms[8] | Infrastructures[8] | Resources[8] | ||
| Small groupings | Large groupings | |||
| AgResearch | 15 | 62 | 146 | 0 |
| Callaghan Innovation | 4[7] | 124 | 87 | 0 |
| ESR | 5 | 47 | 131 | 0 |
| GNS | 9 | 53 | 155 | 125,000 |
| Manaaki Whenua | 7 | 49 | 11 | 0 |
| NeSI | 3 | 16 | 12 | 0 |
| NIWA | 12 | 31 | 304 | 4,702 |
| PFR | 28 | 46 | 380 | 0 |
| Scion | 9 | 65 | 218 | 285,824 |
Table 1 shows the number of platforms, infrastructures, and resources at each institution. Note that some of the variation across the data can be attributed to the decision-making process of each institution in fitting their portfolio to the Kitmap data definitions, as well as the different scales of infrastructure required by different fields of research.
Platforms were self-identified by the institutions and represent groupings of infrastructures. Thus, the number of platforms is somewhat arbitrary and less meaningful for understanding the total amount of infrastructure available. Where an institution has a high platform count, this could indicate that the institution has more infrastructures with standalone purposes or on a significantly larger scale, whereas a low platform count may indicate that the institution already has a different way of grouping their infrastructures, either physically (co-location) or by shared strategic purpose. Thus, the platform count is not especially informative for the purposes of this report, although the data are included for completeness.
Table 2: Breakdown of research infrastructures at each institution by type
|
|
AgResearch |
Callaghan Innovation |
ESR |
GNS |
Manaaki Whenua |
NeSI |
NIWA |
PFR |
Scion |
Total |
|
Laboratory |
36 |
112 |
47 |
19 |
30 |
- |
5 |
33 |
45 |
327 |
|
Digital Collection |
- |
- |
- |
26 |
9 |
- |
2 |
2 |
5 |
44 |
|
Field Site |
12 |
- |
- |
- |
- |
- |
7 |
5 |
5 |
29 |
|
Computing |
- |
2 |
- |
1 |
- |
16 |
1 |
1 |
1 |
22 |
|
Samples Collection |
2 |
- |
- |
3 |
8 |
- |
2 |
- |
6 |
21 |
|
Monitoring |
3 |
- |
- |
3 |
- |
- |
6 |
1 |
- |
13 |
|
Livestock Research |
4 |
1 |
- |
- |
2 |
- |
- |
4 |
1 |
12 |
|
Workshop |
- |
7 |
- |
1 |
- |
- |
1 |
- |
- |
9 |
|
Pilot Plant |
5 |
2 |
- |
- |
- |
- |
- |
- |
1 |
8 |
|
Vessel |
- |
- |
- |
- |
- |
- |
4 |
- |
- |
4 |
|
Other |
- |
- |
- |
- |
- |
- |
3 |
- |
1 |
4 |
The infrastructure counts are more informative in terms of how much research infrastructure is held by an institution. These are made up of a variety of types (defined on the following page), as indicated in Table 2. However, infrastructure counts are more nuanced than might be taken at first glance. High infrastructure counts reflect where an institution has reported large numbers of individual physical spaces, collections, or networks with different purposes, or where an institution has listed many individual physical spaces as a separate infrastructure. In contrast, low infrastructure counts reflect institutions’ grouping of physical spaces/collections/network with a shared purpose as a single “facility” at the infrastructure level. Therefore, comparison of the total number of infrastructures at each institution does not necessarily reflect the scale of operation of each institution.
The individual resources reflect significant pieces of equipment, although the scale of each is not apparent from the counts, ie some may be much larger than others. The individual resource types are not presented here, however these will be an important component of the forthcoming Kitmap online tool.
These counts and breakdown of infrastructure across categories are explored in more detail below.
The majority of science facilities are laboratories
Figure 3 illustrates the proportion of infrastructure types held by each institution, based on the data in Table 2. Each infrastructure was tagged to 1 category through a standardisation process —many of the infrastructures have broad capabilities that may overlap across multiple categories but are here simplified to reflect the main category for each infrastructure. The infrastructure types used here are:
- laboratory: conventional laboratory rooms/buildings
- digital collection: online databases and digital archives
- sample collection: collections of physical specimens
- field site: physical spaces used for research activities which are not conventional scientific laboratories (not only sites at which field work is carried out)
- computing: physical computing hardware and/or virtual spaces and networks
- monitoring: sets or networks of monitoring equipment
- livestock facilities: physical spaces for rearing, containing, or conducting research with livestock (including farm animals, fish, and insects)
- workshop: physical spaces which support research activities through fabrication/maintenance of research equipment
- pilot plant: production facilities which enable trials of new production technologies or products on a pre-commercial scal
- vessel: ships or boats which are equipped to enable research to be conducted at sea
- other: infrastructures whose main designation/purpose does not match the previous categories.
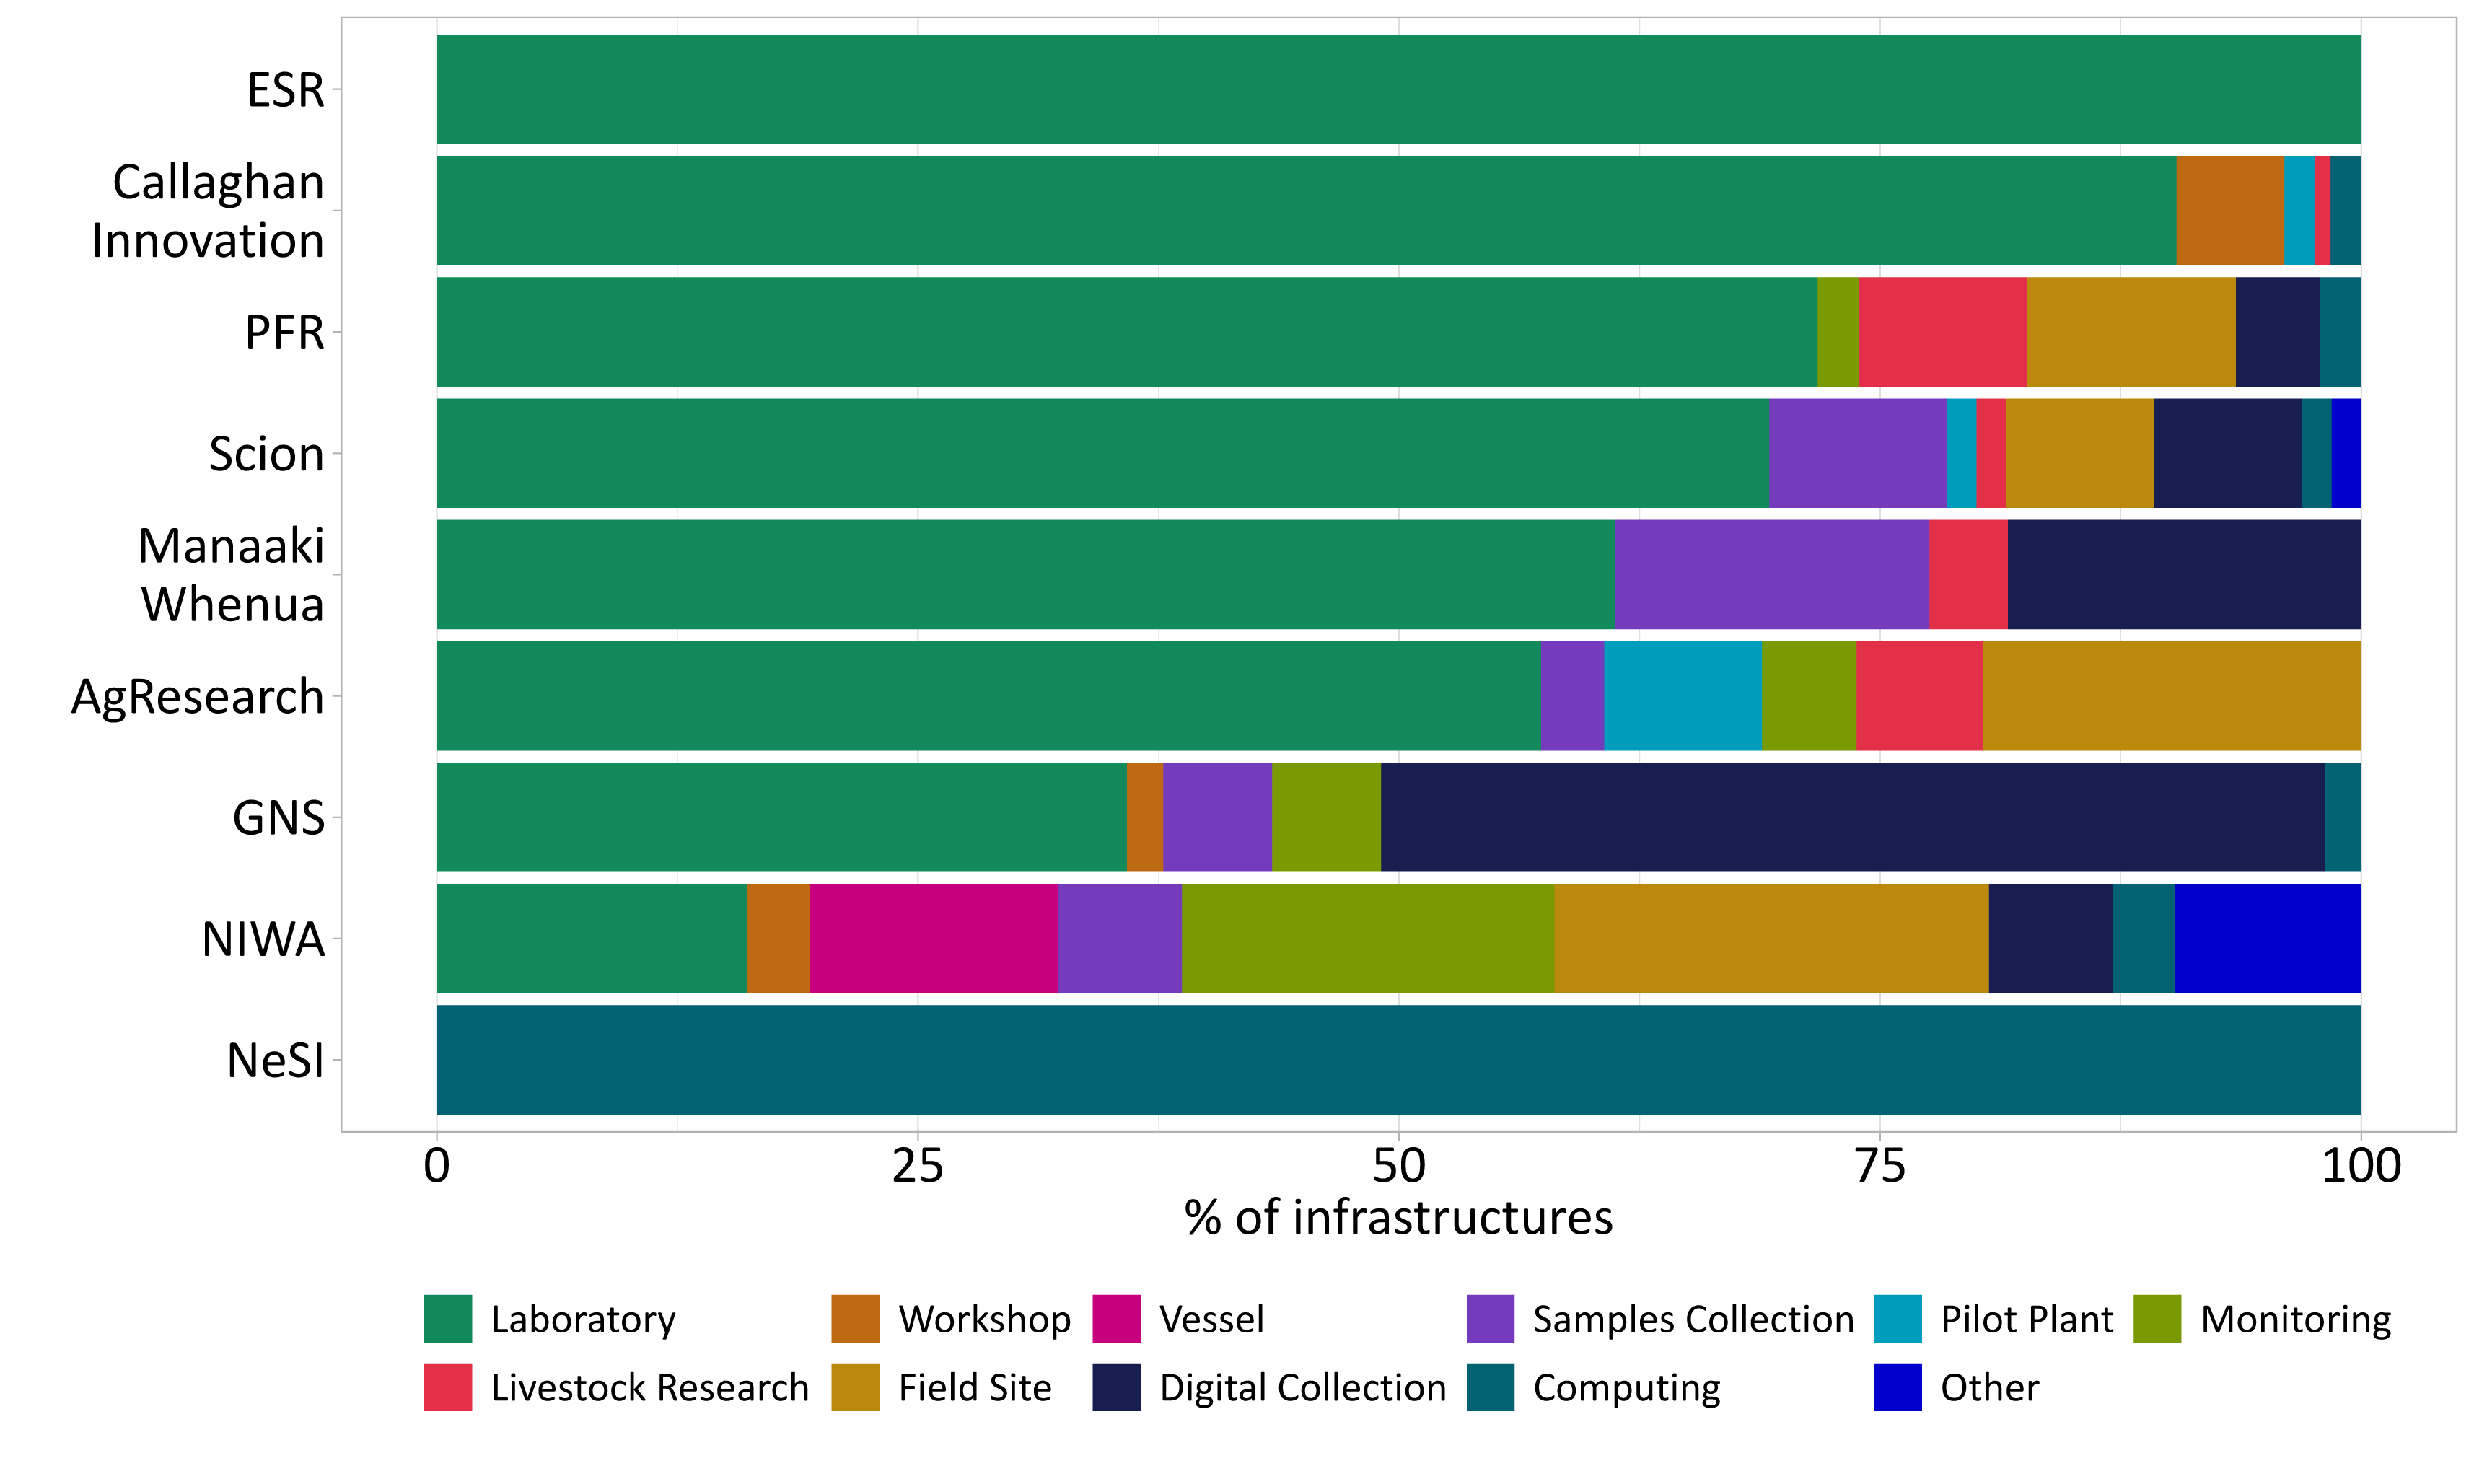
Figure 3: Types of infrastructures at each institution, sorted by proportion of laboratories in infrastructures reported
Text description of figure
Most infrastructure reported across the institutions are laboratories. These laboratories host a wide range of resources and represent the backbone of the scientific research infrastructure that supports research across the institutions. The large fraction of laboratories in the infrastructure from ESR and Callaghan Innovation reflects the research focus of these institutions. PFR, Scion, Manaaki Whenua and AgResearch have more diverse infrastructure holdings to support their research priorities, which encompass a broader range of scientific approaches. Similarly, GNS and NIWA have the most diverse holdings, reflecting the environmental and monitoring focuses of these institutions requiring the widest range of supporting infrastructure types. The primary exception to these points is NeSI, as its significant infrastructures all fall in a single category, computing (Figure 3), which reflects NeSI’s role as Aotearoa’s eScience infrastructure.
The breakdown of users across these infrastructure types is explored further in:
Section 3: Access and use of research infrastructure
Facilities have varying numbers of resources
As described in Section 1, resources here comprise the tools and equipment that researchers use, often customised to allow particular activities. Resources are often key attractions for a facility and reflect the differences in capabilities of the institutions.
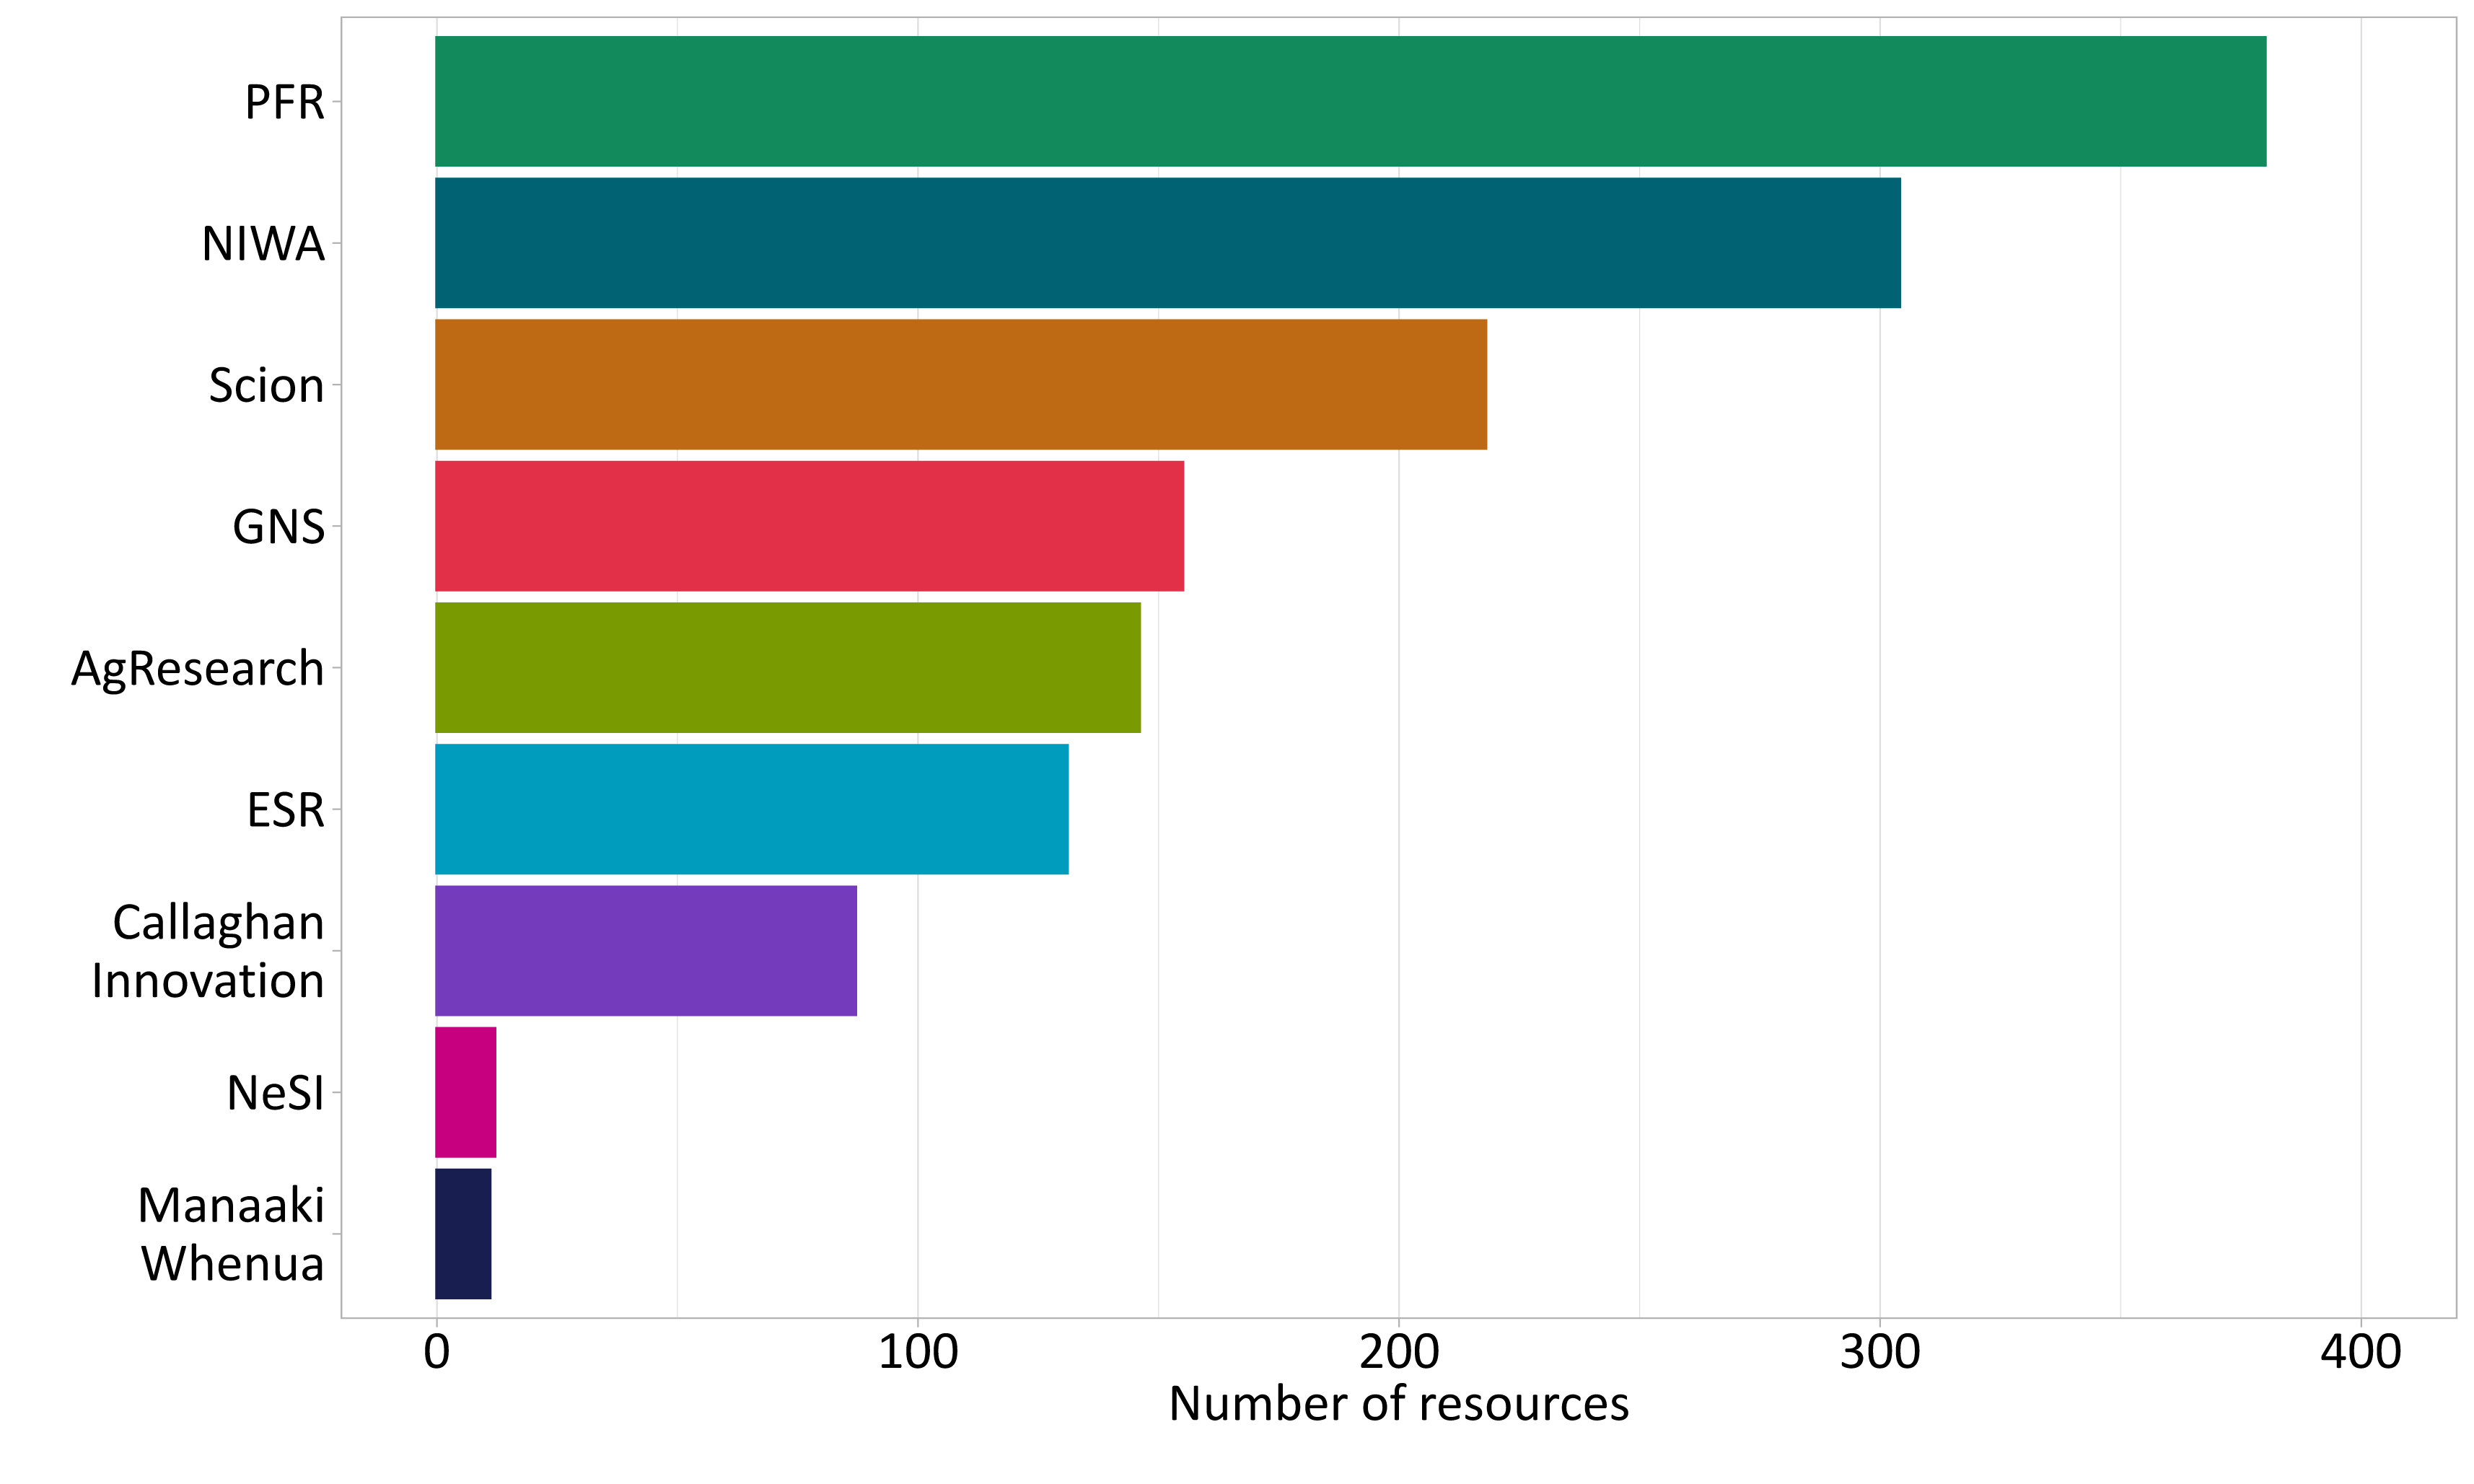
Figure 4 shows the total number of resources reported by each institution. Per the definitions in Section 1, resources data in Figure 4 show a subdivision of the resources data to exclude those with numerous individual parts (eg individual specimens in a collection, sensors in a monitoring network, or computers in a cluster) to focus on small groups of resources.
Figure 4: Number of resources reported by each institution*
*Data notes
Text description of figure
Metadata table (response rates)
The counts of resources at the institutions ranged from 11 to 380. This large variation may partly be a result of differences in reporting from the institutions[8], which means some relative differences between institutions are not accurately reflected. However, some reflect the true number of resources (noting that these do not reflect the scale of each resource). For example, NeSI’s lower resource counts likely reflect that supporting eResearch requires a narrower variety of equipment compared with organisations than carrying out experimentally based research, though each resource may be of high value.
Facilities support research across all fields, but reflect the focus of the organisations surveyed
Here we address the core Kitmap question of what infrastructure is used for and what areas of research are enabled by infrastructure in Aotearoa. These categories were self-identified by each institution according to Australian and New Zealand Standard Research Classification (ANZSRC) codes for Fields of Research (FoR) and Socio-Economic Objective (SEO)[9]. We note that it can be difficult to apply these codes, as the objectives or types of research enabled by some types of infrastructure can be extremely broad.
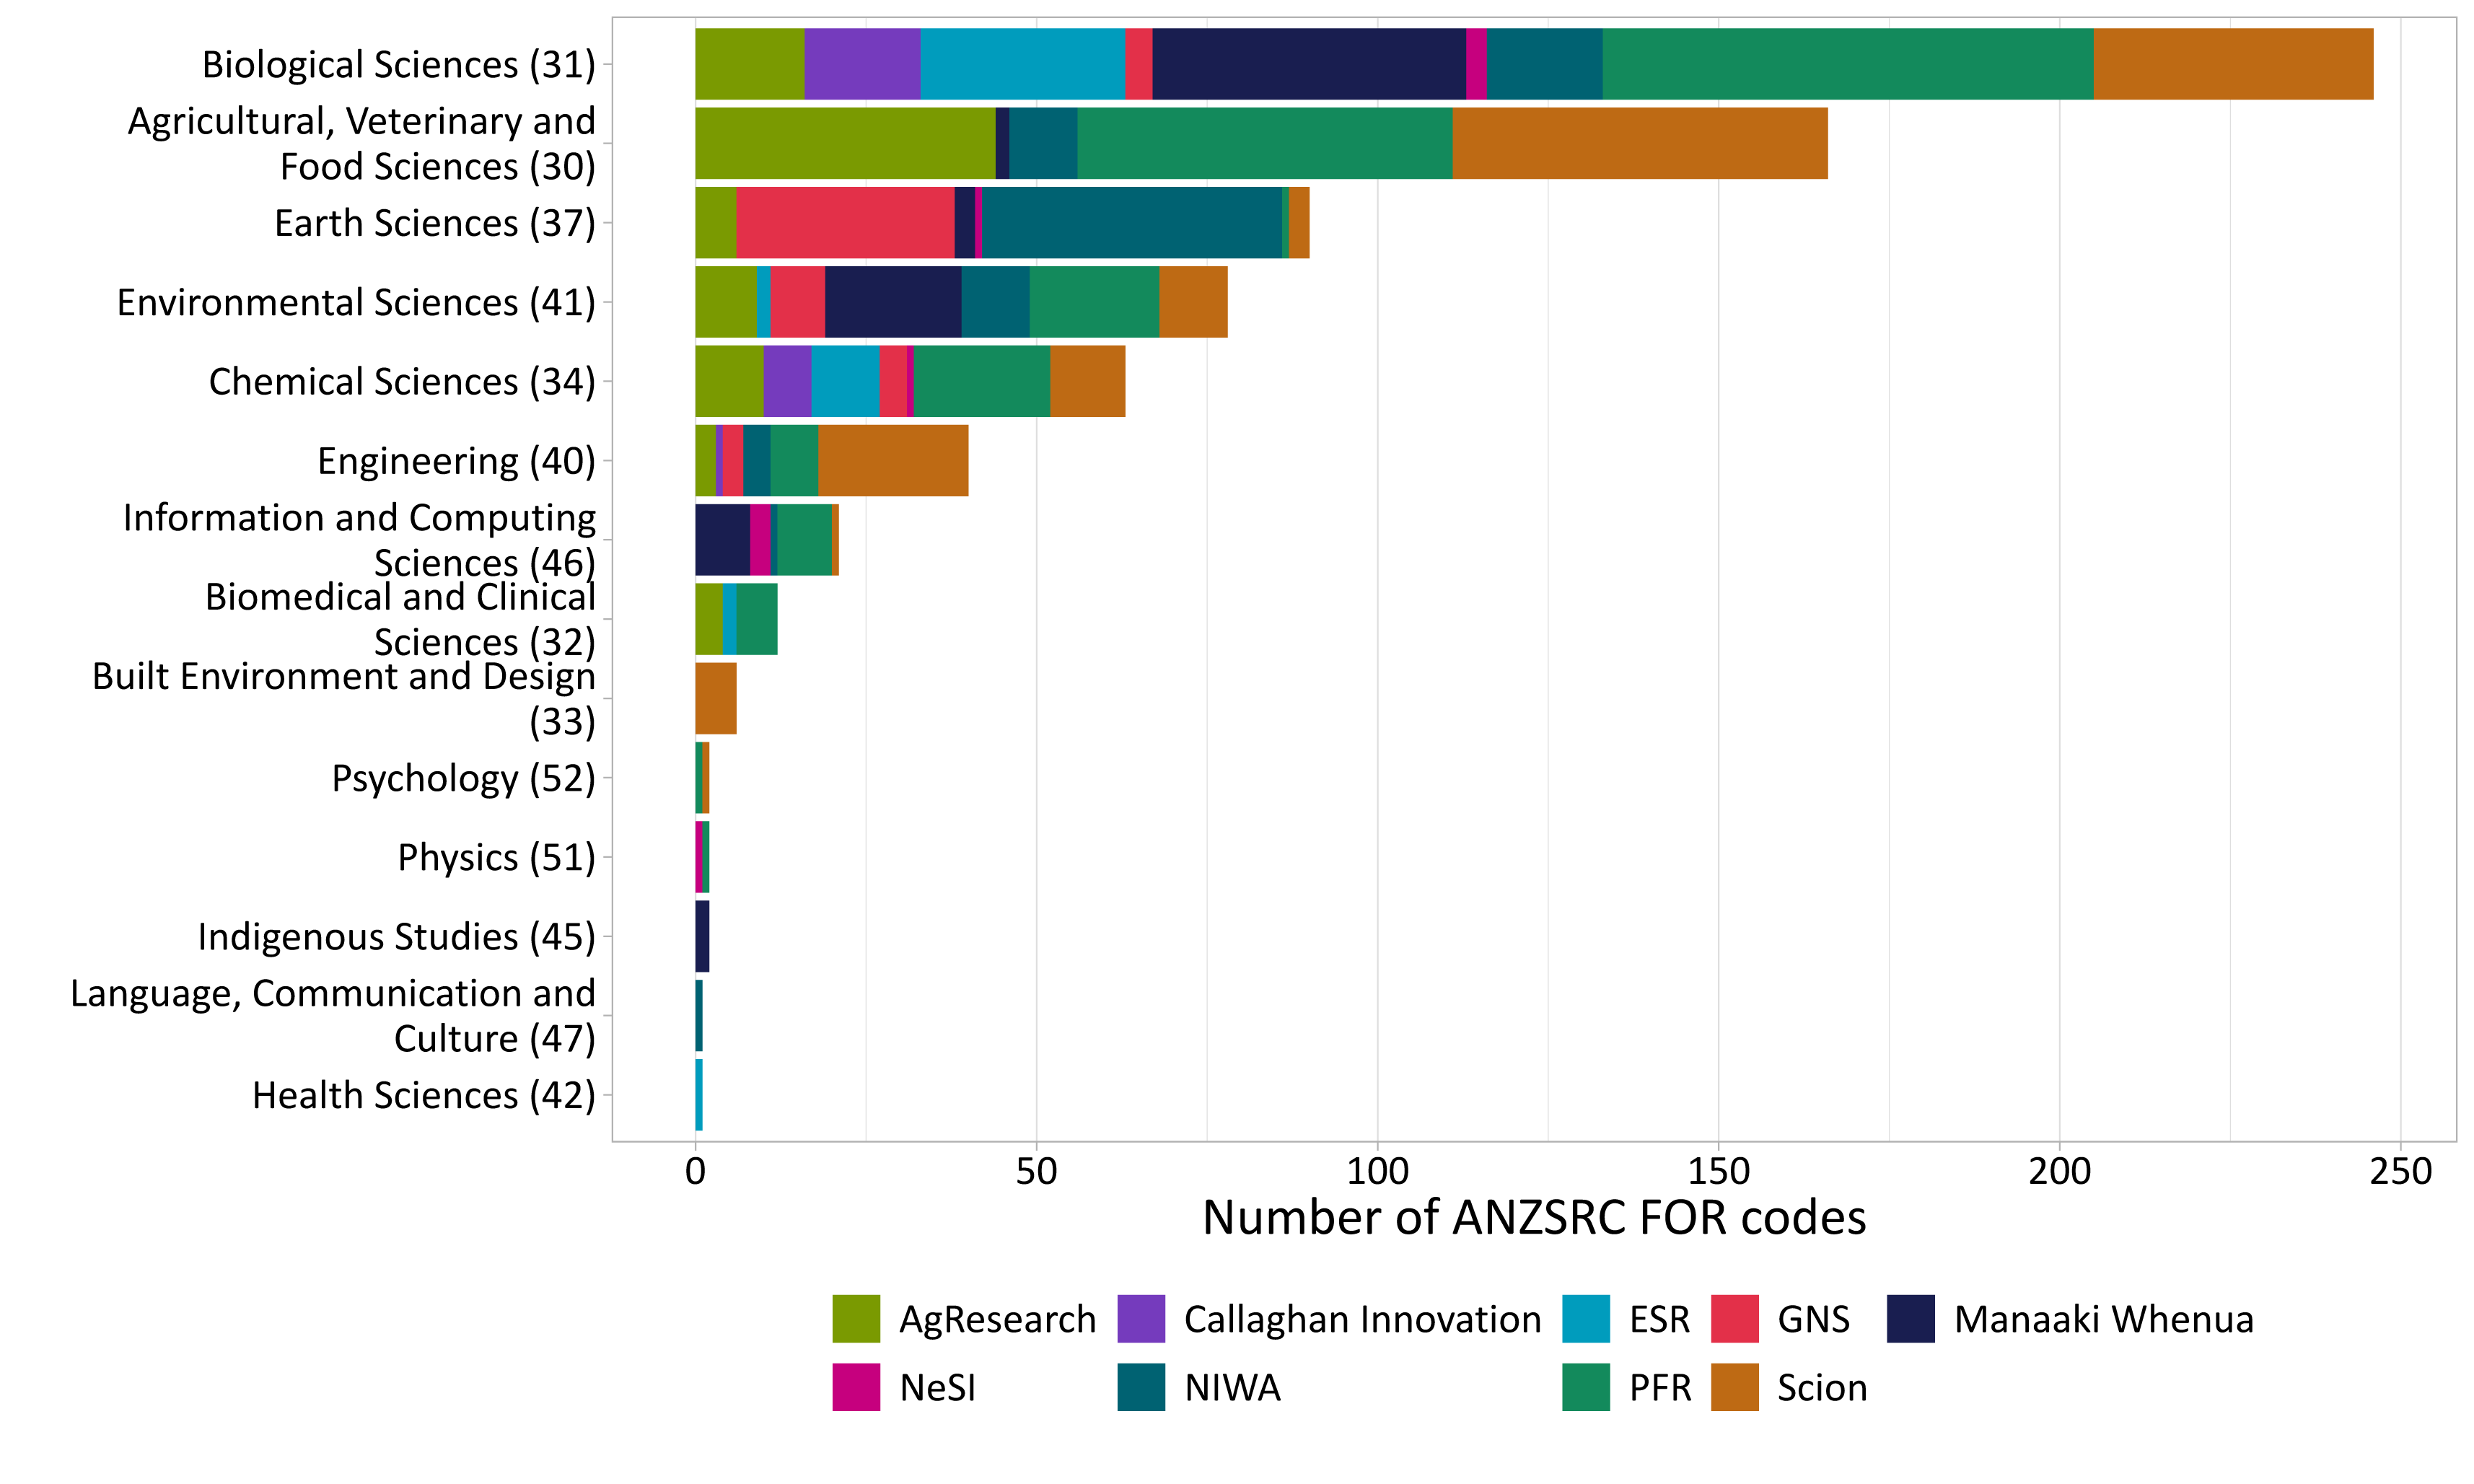
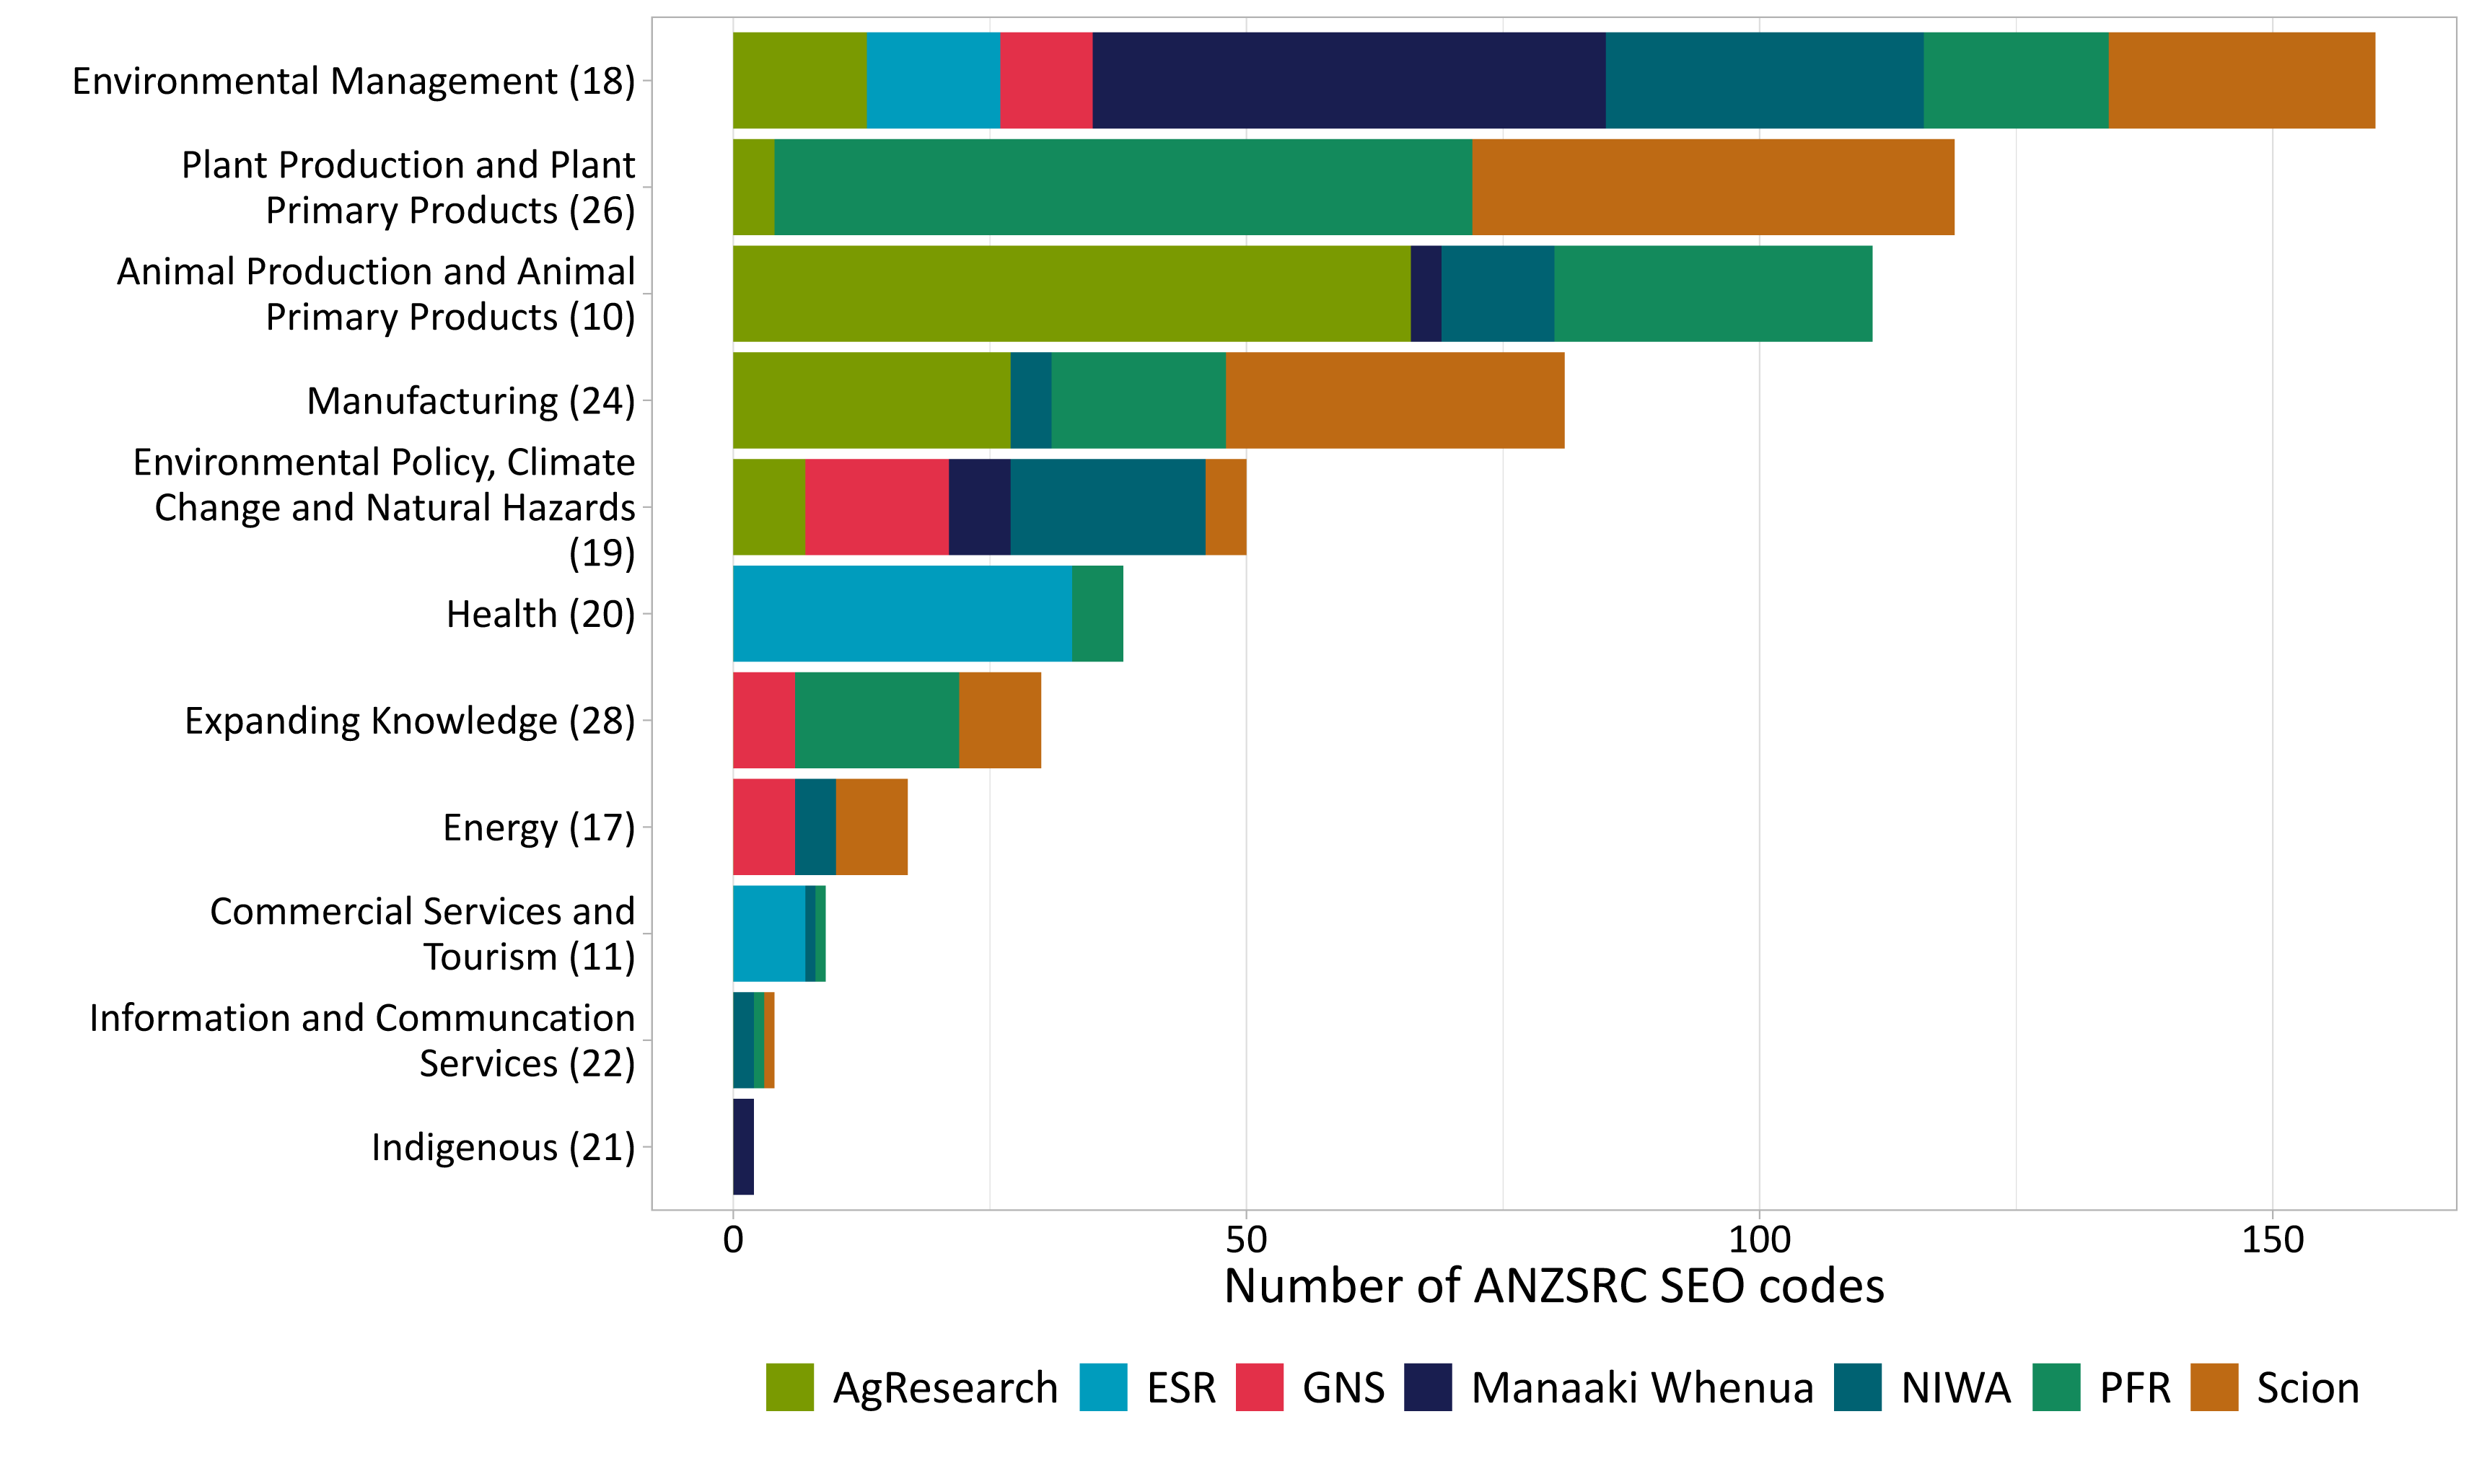
Figure 5 and Figure 6 show the numbers of research infrastructures supporting each of the ANZSRC FoR and SEO codes, respectively, across the infrastructures reported in the Kitmap survey. The available data clearly reveal the focus of Aotearoa’s research efforts, at least as supported through infrastructure. Unsurprisingly, these show that a significant fraction of the research infrastructure held across the CRIs is used to support the primary industries (particularly agriculture) or for researching and/or monitoring the natural environment and natural hazards, which align with the core purposes of the respective institutions and the overarching goals of the funding they receive. This is addressed in further detail in Section 3:
Figure 5: ANZSRC Field of Research (FoR) divisions supported by research infrastructure at each institution*
*Data notes
Text description of figure
Figure 6: ANZSRC Socio-Economic Objectives (SEO) supported by infrastructure at each institution*
*Data notes
Text description of figure
Metadata table (response rates)
As would be expected, GNS and NIWA have the most infrastructure used for earth science. Notably, every institution features infrastructure under the biological sciences FoR division, revealing this as a connecting area across a wide range of disciplines. Manaaki Whenua was the only institution reporting infrastructures with SEO codes for indigenous outcomes. The majority of research infrastructures reported are generic technologies which could as easily apply to indigenous as non-indigenous SEOs. The small number of infrastructures with this SEO applied reflects those with a more defined focus, such as collections containing taonga species with specific links to indigenous outcomes. Several institutions reported infrastructures supporting the Expanding Knowledge SEO, which is interesting given that this SEO is suggestive of basic research, whereas these organisations are more typically thought of as carrying out applied research.
Most institutions access international infrastructures
While the primary focus of the Kitmap survey was to characterise our domestic research infrastructure portfolio, understanding how the institutions utilise research infrastructure outside of Aotearoa provides further insights into our infrastructure needs and how they are resourced. International agreements provide opportunities for accessing infrastructure that could otherwise be unattainable, particularly for Aotearoa as a smaller country. Such arrangements are integral to our research remaining competitive and at the forefront of research on a global scale.
The institutions were asked to describe access to international research infrastructure or facilities. Most institutions reported the use of at least one piece of international research infrastructure, which are accessed through various access arrangements. These agreements for access included fee-paying memberships, service delivery contracts, access fees, collaborative research, including collaborative arrangements between individual scientists (both contracted and non-contracted), pan-CRI agreements (agreements between groups of CRIs and an international facility), use of research infrastructure purchased in exchange for maintenance, and fee-for-service arrangements.
Several of the institutions (AgResearch, GNS, Callaghan Innovation and PFR) are fee-paying members of the New Zealand Synchrotron Group (NZSG) which coordinates Aotearoa’s investment in and access to the Australian Synchrotron, one of Aotearoa’s largest nationally funded research infrastructures, with substantial funding from the SSIF[10]. The Australian Synchrotron is a large facility with many experimental stations and a wide variety of research applications, including health, environment, food production, nuclear science, and development within space and quantum technologies. Through this bilateral agreement, our researchers gain access to this infrastructure that would otherwise be beyond the reach of Aotearoa institutions, and this is a good example of how our needs can be met through international arrangements.
[7] This value reflects the core platforms at Callaghan Innovation; this value would be higher if expanded to included co-located companies that are tenants of Callaghan Innovation.
[8] See definitions in Survey details: Defining research infrastructure
[9] ANZSRC is a statistical classification used for the measurement and analysis of R&D across the two countries, classifying R&D projects by Type of Activity (ToA), Fields of Research (FoR) and Socio-Economic Objectives (SEO). The FoR and SEO categories are divided into a hierarchy of levels comprising division (2-digit codes), group (4-digit codes), and field (6-digit codes), becoming more specific at each level.
[10] NZ Synchrotron Group Ltd(external link) (royalsociety.org.nz)