COVID-19 consumer impacts study reports
This study followed a group of over 1,000 adult New Zealanders from March 2021 to March 2022 to track changes in consumer concerns, attitudes and experiences.
About the series
Early in 2021 we surveyed around 1,700 adult New Zealanders to provide a benchmark of consumer concerns, experiences, and behaviours and how these had been impacted from COVID-19 (wave 1).
For additional survey waves, the same group of New Zealanders were recontacted every 6-months to enable us to track changes over time and compare anticipated with actual change (waves 2-3).
Changes to the survey in Wave 4
This survey series was intended to be conducted over 5 rounds, with one survey every 6 months for 2 years. However, by round 3, results from all rounds consistently reiterated that COVID-19 has brought more rapid than usual changes in circumstances to consumers and is exacerbating pain points such as the cost of living and concerns about the economy. It was decided to end the series at round 3 and put more focus on consumer issues such as purchasing, transacting confidently, and consumer concerns in line with Consumer Services work programme this financial year.
Summary of Wave four
Total responses 883, response rate of 55%
Fieldwork dates:
- Start date: 20th September 2022
- End date: 18th October 2022
Key findings
- 83% of respondents had taken some action to resolve their problem. The most common action is contacting the seller.
- The perception that the problem is not worth the effort (e.g., a low value product) was the most reported reason for inaction.
- In seeking a resolution, around half looked for advice or information, with the seller/service provider the most used source. Advice was also commonly sought from family and friends, especially by young people.
- Of the 5 information sources prompted on, Consumer NZ (79%) and Consumer Protection (76%) were considered most useful. 17% felt that the seller was not a useful information source.
- Just over half of faulty good/service problems had been resolved to the respondent’s satisfaction; 18% remained unresolved, with overseas retailers over-represented in this group.
- 81% reported that their faulty good/service problem had had some impact on their everyday life, including 12% who reported a significant impact. Those with problems with internet/streaming services were over-represented among those reporting a significant impact.
- When asked what could be done to make it easier to resolve problems with faulty goods/services, consumer self-improvements were most mentioned, including seeking advice/information around their rights as consumers, keeping receipts, being more proactive about returning faulty products and being more assertive with sellers. Pasifika respondents were over-represented among this group.
- 1 in 5 respondents report working more hours than they want/need (21%) than 6 months ago. Only 14% now report working fewer hours than they want/need, down from 24% in Round 3.
- Motivated by a desire for more income and/or more challenging work, a third of those currently working are considering changing jobs in the next 6 months.
- Overall, personal incomes have increased from Round 3, 33% having experienced an increase and 16% a decline, a net change of +17 percentage points, stable from +16 in Round 3.
- With 31% reporting an increase and 17% experiencing a decrease, the net change in household income is positive (+14, compared with -1 in Round 3).
- The impact of COVID-19 on both personal and household income changes continues to decline. Where COVID-19 is reported to have had an impact on income, this impact is significantly more likely to have resulted in a decrease. Among those who reported an increase in personal income, only 14% attributed this to COVID; in contrast, 53% of all declines in personal income over the last 6 months were attributed to the pandemic.
Image description
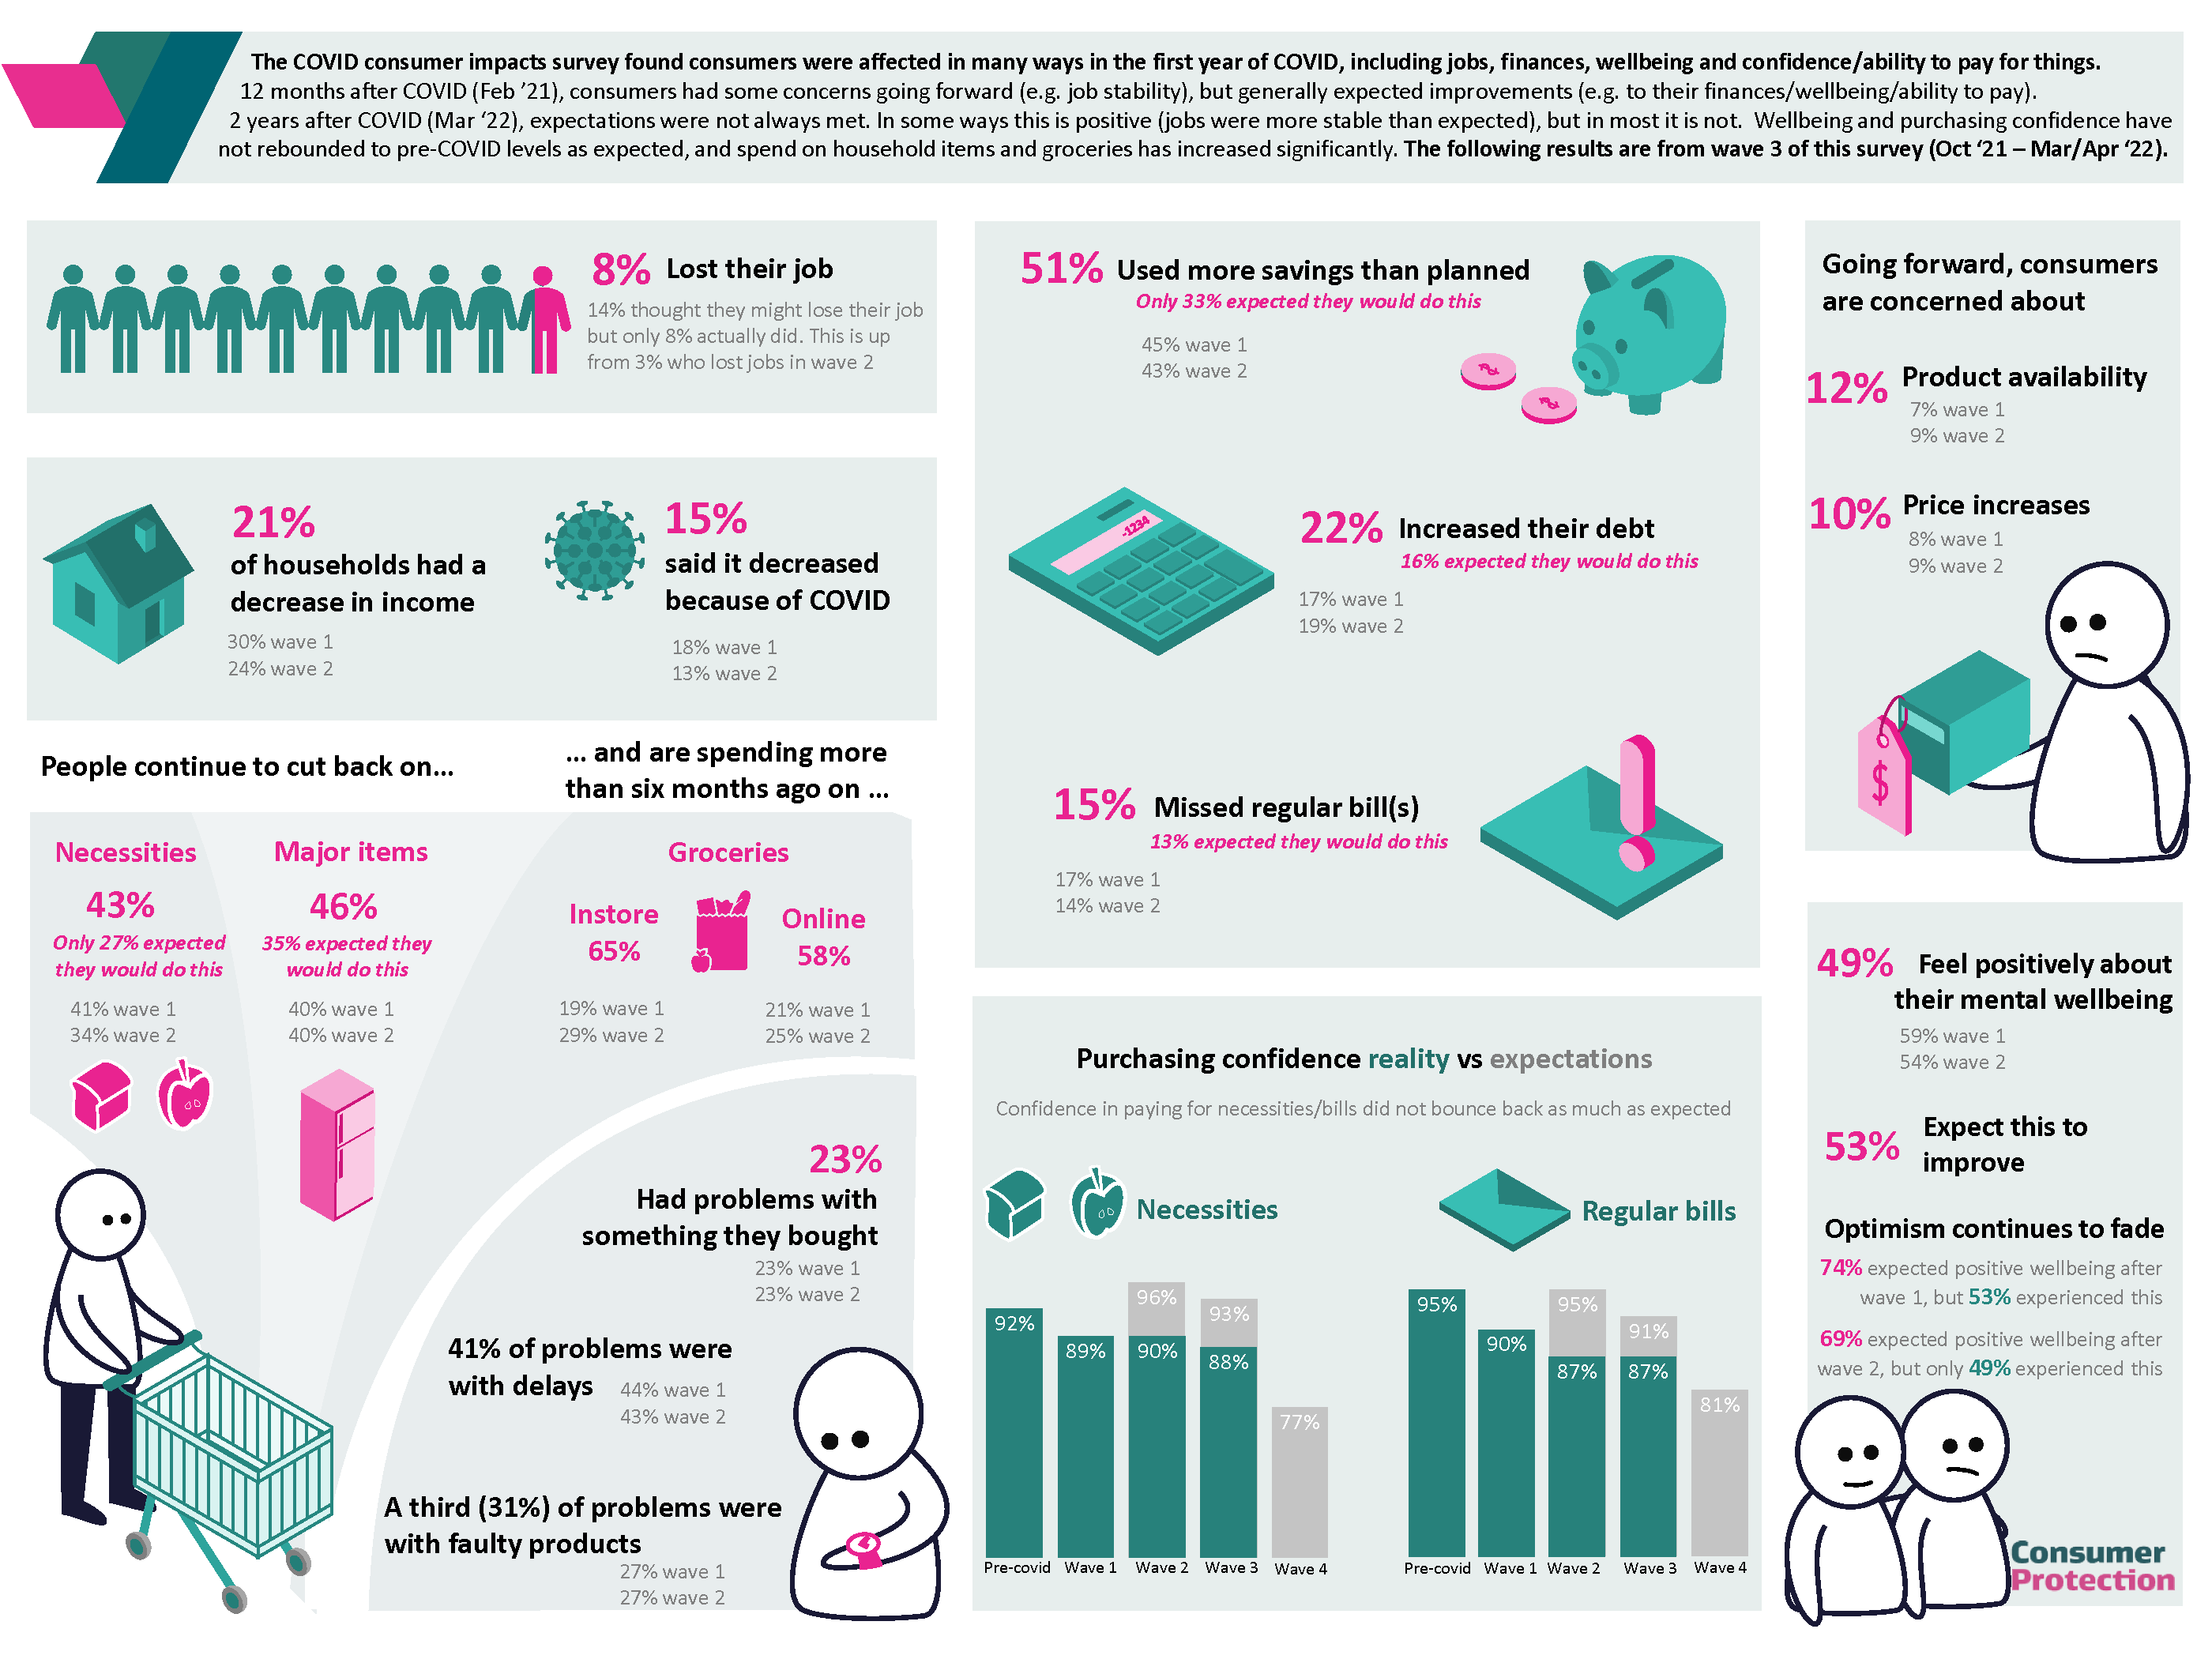
The COVID consumer impacts survey found consumers were affected in many ways in the first year of COVID, including jobs, finances, wellbeing and confidence/ability to pay for things.12 months after COVID (February 2021), consumers had some concerns going forward (e.g., job stability), but generally expected improvements (e.g., to their finances/wellbeing/ability to pay). 2 years after COVID (March 2022), expectations were not always met. In some ways this is positive (jobs were more stable than expected), but in most it is not. Wellbeing and purchasing confidence have not rebounded to pre-COVID levels as expected and spend on household items and groceries has increased significantly. The following results are from wave 3 of this survey (October 2021 –March/April 2022).
The survey spoke with 1,600 New Zealanders and found that:
- 8% had lost their job
- 21% had a decrease in income their income and 15% attributed it to COVID19
- 43% have had to cut back on buying necessities and 46% have cut back on buying major household items
- 65% are spending more on buying groceries instore and 58% online
- 23% had problems with something the bought and 41% of problems were with delays and 315 of problems with faulty products.
- 51% used more savings than planned and only 33% expected they would do this in the last 6 months
- 22% increased their debt and 16% expected they would do this in the last 6 months
- 15% missed regular bills
- 88% were confident they could purchase necessities, even when 93% expected they could in August 2021
- 87% were confident they could pay regular bills, even when 91% expected they could in August 2021
- 12% of consumer are concerned about product availability, a 3% increase from wave 2
- 10% of consumers are concerned about price increase
- Going forward, there appears to be continuous fading optimism about wellbeing with: 49% feeling positive about their mental wellbeing, this is down from 59% in wave 1 and 54% in wave 2. Only 53% expected this to improve.
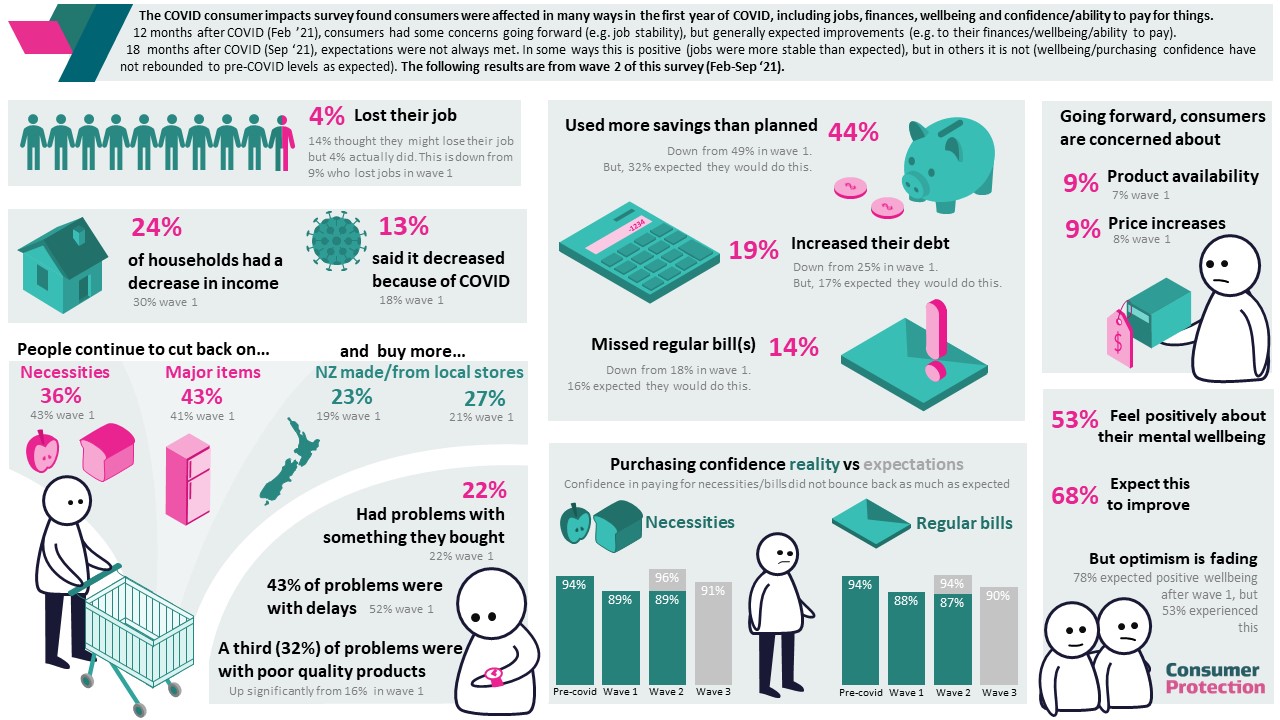
Image description
A snapshot infographic of the impact COVID-19 had on New Zealand consumers 12 months after COVID-19 (February 2021) consumers had some concerns going forward (e.g., job stability), but generally expected improvements in finance, wellbeing, and ability to pay for necessities and major household items. 18 months after COVID-19 (September 2021), expectations were not always met. However, jobs were more stable than expected, but others feel wellbeing and purchasing confidence have not rebounded to pre-COVID levels as they expected.
The survey spoke with 991 New Zealanders and found that:
- 4% had lost their job.
- 24% had a decrease in their income and 13% attributed it to COVID.
- 36% have had to cut back on buying necessities and 43% have cut back on buying major household items.
- 23% now buy NZ made products and from local stores.
- 22% had problems with what they purchased and 43% of problems were with delay and 32% of problems was with poor quality products.
- 44% used more savings than they had planned.
- 19% have had to increase their debt.
- 14% missed regular bill payment.
- 89% in reality were confident they could purchase necessities, even though 96% expected they could in March 2021.
- 87% in reality were confident they could pay regular bills, even though 94% expected they could in March 2021.
- 9% of consumers are concerned about product availability.
- 9% of consumers are concerned about price increases.
Going forward, there appeared to be fading optimism about wellbeing with:
- 53% feeling positive about their mental wellbeing, because 78% expected wellbeing to improve in Wave 1.
- 68% are expecting wellbeing to improve in the next 6 months.
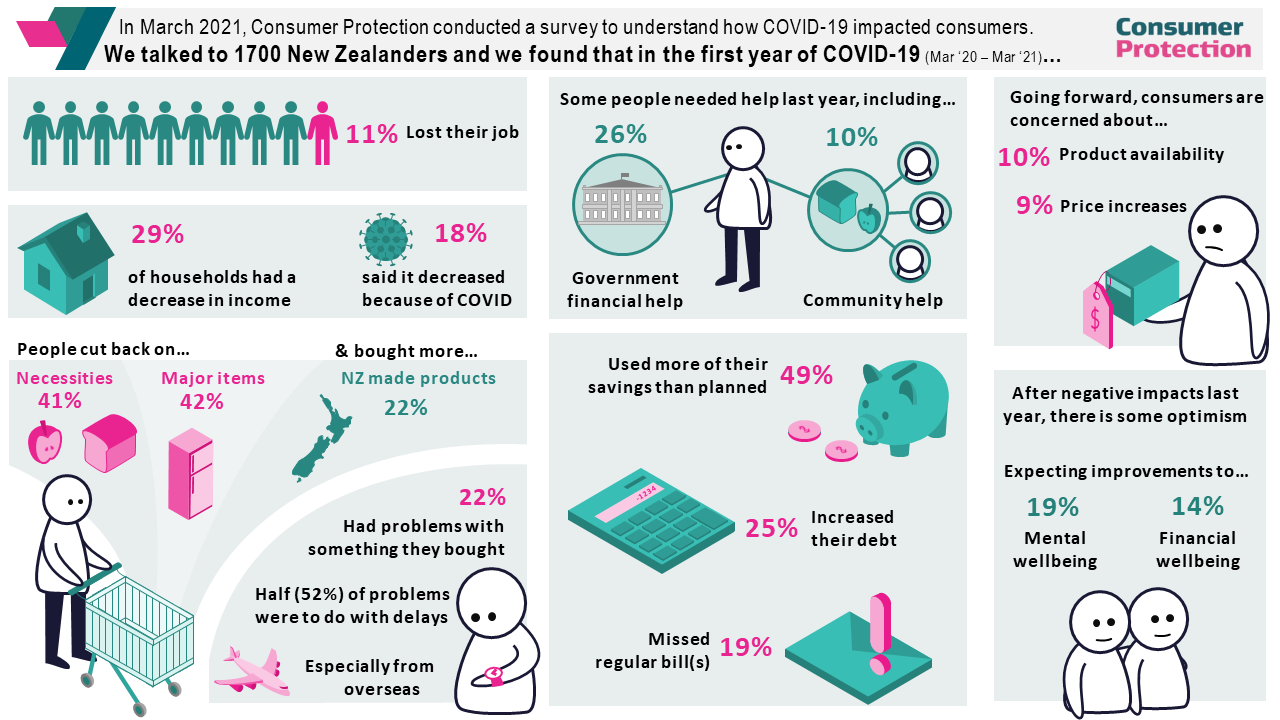
Image description
A snapshot infographic of the impact COVID-19 had on New Zealand consumers in the first year of COVID from March 2020 to March 2021.
The survey spoke with 1,700 New Zealanders and found that:
- 11% had lost their jobs.
- 29% said their household income decreased, and 18% said it was because of COVID-19.
- 26% had to access government help during this time and 16% from the community.
- 41% have had to cut back on necessities and 42% on major household items.
- 22% resorted to buying more NZ made products.
- 22% had problems with what they had bought and half of those had to do with delays, especially from overseas.
- 49% have had to use their savings more than they planned.
- 25% increased their debt as a result of COVID-19.
- 19% have missed payment of at least one regular bill.
- 10% of consumers are most concerned about product availability.
- 9% were most concerned about price increase.
Going forward, there appeared to be optimism about wellbeing with:
- 19% optimistic that mental wellbeing will improve.
- 14% optimistic that financial wellbeing will improve.
Last updated: 16 March 2023