Use of Regional Tourism Indicator data
Regional Tourism Indicator (RTI) data is presented as indexes, and can be compared between years, however there are some limitations to its use.
On this page
About the indexes
The actual data held is aggregations of dollars spent and number of transactions. However the RTI is presented as indexes, to avoid confusion with estimates for the total expenditure that are obtained from the International Visitor Survey or other sources.
For the data that is presented as indexes, the default index year is 2008. For monthly data this means that the index is based on an average month for 2008 — that is, total expenditure for 2008 divided by 12.
Index = (Current month/Average 2008 month) * 100
This means that any value:
- greater than 100 is more tourist spend than the average 2008 month
- lower than 100 is less tourist spend than the average 2008 month.
This preserves the seasonality of the data but allows comparisons with the previous year.
Comparing indexes between years
When comparing indexes between years (when one is not 2008), to get the percent change you need to get the percent difference between them.
Percent change = (Index year 2 – Index year 1)/ Index year 1
For example, if September 2010 index is 105 and September 2011 is 110, then the percent change in level of spend between September 2010 and 2011 is (110-105)/105 = 4.7%.
Limitations in use
This data set is best used to identify change over time. Because of the nature of transactions and difference in behaviours between people there are some areas where care needs to be taken.
Level of spend between 2 countries
Level of spend between 2 countries can't be compared. This is for two reasons:
- Different countries have different propensities to pre-purchase parts of their visits to New Zealand
- More generally, different countries have different usage rates of electronic transactions.
This only impacts the international data.
Spending between ANZSIC categories
For both international and domestic data, care needs to be taken when viewing spend between different categories. Depending on the category there are different abilities to pre-purchase the goods or services. For example, spending on accommodation compared to fuel — accommodation can be pre-purchased but fuel is unlikely to be pre-purchased. However, accommodation is not likely to be paid for via cash, but fuel could be.
Changes in spending patterns
Care needs to be taken when looking at the RTIs that a trend observed is not a reflection in a change in visitors’ electronic transactions usage, rather than 'genuine' travel and spend patterns. As such the data is regularly compared against other sources to check this. On a continuous basis Stats NZ monitors electronic transactions for core retail. Below is the graph from the October 2012 ECT release which shows the share sitting between 63 - 66 % for the period of interest for the RTI.
Graph: Share of core retail spending by electronic card transactions
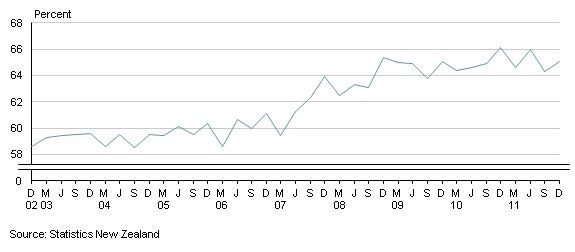
Excluding GST; Quarterly