National
The commentary below presents the national context for tourism in the year ending September 2019 (and for the September 2019 quarter where available).
MBIE acknowledges that the outbreak of coronavirus creates some uncertainty looking ahead. This Quarterly Tourism Report provides a retrospective look at the performance of the sector, so the impacts of the outbreak are not included. Analysis of the impact of the outbreak will be included in future reports. Key findings are below:
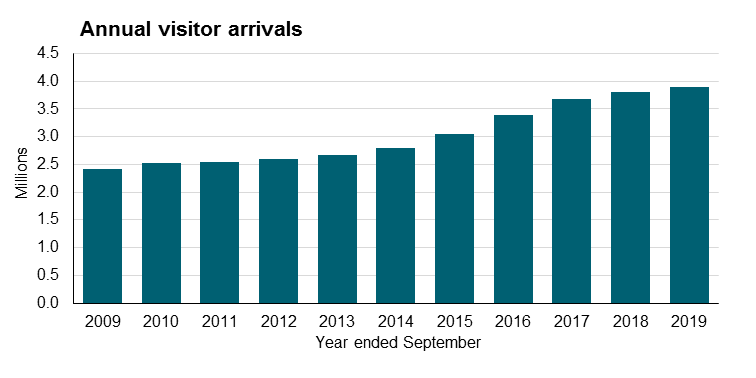
Growth in annual visitor arrivals eases to 2.5 per cent
The number of international visitor arrivals to New Zealand increased by 2.5 per cent to 3.90 million, for the year ending September 2019.
Source: International Travel, Stats NZ
Annual visitor arrivals - data table
| Year ended September |
Number |
Change from previous year |
| |
|
Number |
Percent |
| 2009 |
2,425,192 |
-43,872 |
-1.8 |
| 2010 |
2,516,683 |
91,491 |
3.8 |
| 2011 |
2,548,094 |
31,411 |
1.2 |
| 2012 |
2,594,699 |
46,605 |
1.8 |
| 2013 |
2,670,048 |
75,349 |
2.9 |
| 2014 |
2,801,802 |
131,754 |
4.9 |
| 2015 |
3,040,667 |
238,865 |
8.5 |
| 2016 |
3,386,685 |
346,018 |
11.4 |
| 2017 |
3,677,744 |
291,059 |
8.6 |
| 2018 |
3,808,605 |
130,861 |
3.6 |
| 2019 |
3,902,924 |
94,319 |
2.5 |
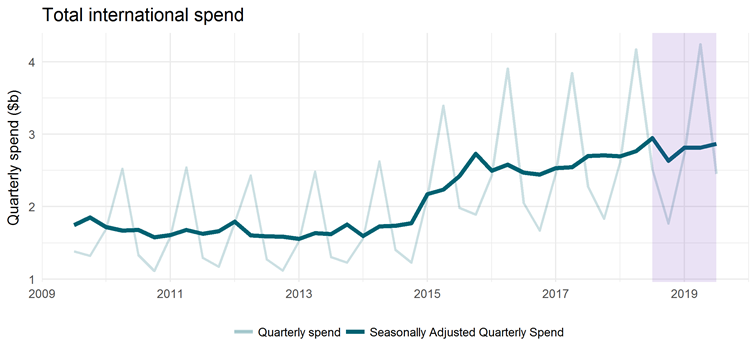
Over the same period, spend by international visitors grew two per cent to $11.31 billion (although the growth was not statistically significant). This equated to an overall increase of $247 million over the year, pushing the average spend per visitor up marginally, to $3,350 (again, this growth was not statistically significant).
Source: International Visitor Survey, MBIE
Total intenational spend - data table
| Date |
Spend (billions) |
| 1/10/2009 |
1.319214 |
| 1/01/2010 |
1.692265 |
| 2/04/2010 |
2.521884 |
| 2/07/2010 |
1.333367 |
| 1/10/2010 |
1.115075 |
| 1/01/2011 |
1.585756 |
| 2/04/2011 |
2.539152 |
| 2/07/2011 |
1.295248 |
| 1/10/2011 |
1.171723 |
| 1/01/2012 |
1.774207 |
| 1/04/2012 |
2.428588 |
| 2/07/2012 |
1.271306 |
| 1/10/2012 |
1.116434 |
| 1/01/2013 |
1.525808 |
| 2/04/2013 |
2.484795 |
| 2/07/2013 |
1.304091 |
| 1/10/2013 |
1.22928 |
| 1/01/2014 |
1.561397 |
| 2/04/2014 |
2.625237 |
| 2/07/2014 |
1.40684 |
| 1/10/2014 |
1.23076 |
| 1/01/2015 |
2.125335 |
| 2/04/2015 |
3.391833 |
| 2/07/2015 |
1.985796 |
| 1/10/2015 |
1.889349 |
| 1/01/2016 |
2.430566 |
| 1/04/2016 |
3.904143 |
| 2/07/2016 |
2.051447 |
| 1/10/2016 |
1.672107 |
| 1/01/2017 |
2.458119 |
| 2/04/2017 |
3.842189 |
| 2/07/2017 |
2.277175 |
| 1/10/2017 |
1.832828 |
| 1/01/2018 |
2.610823 |
| 2/04/2018 |
4.169637 |
| 2/07/2018 |
2.515302 |
| 1/10/2018 |
1.766756 |
| 1/01/2019 |
2.729583 |
| 2/04/2019 |
4.240943 |
| 2/07/2019 |
2.453033 |
| 1/10/2019 |
1.886032 |
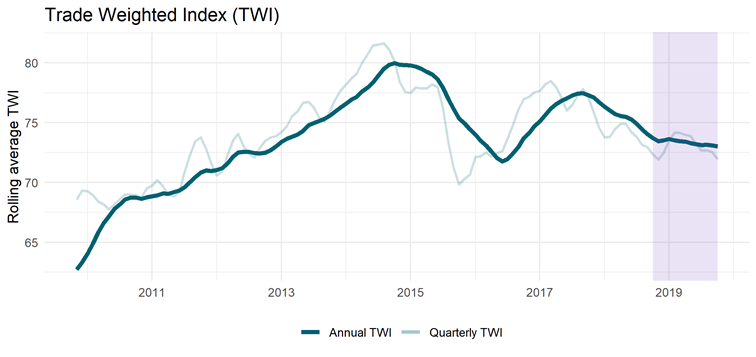
The New Zealand dollar softened fractionally against our major tourism markets this quarter, allowing visitors to spend slightly more in New Zealand dollars for the same amount of their home currency. The Trade Weighted Index is an index showing the value of the New Zealand dollar in relation to our major trading partners.
Trade Weighted Index (TWI) - data table
| Date |
Quarter exchange rate |
Annual exchange rate |
| 2/03/2010 |
68.41 |
65.8175 |
| 2/04/2010 |
68.16333 |
66.595 |
| 2/05/2010 |
67.75667 |
67.1975 |
| 2/06/2010 |
68.17667 |
67.79083 |
| 2/07/2010 |
68.59333 |
68.175 |
| 1/08/2010 |
69.01333 |
68.56917 |
| 1/09/2010 |
68.98667 |
68.72417 |
| 1/10/2010 |
68.93667 |
68.74083 |
| 1/11/2010 |
68.77667 |
68.6175 |
| 1/12/2010 |
69.5 |
68.76833 |
| 1/01/2011 |
69.72667 |
68.855 |
| 31/01/2011 |
70.18 |
68.93167 |
| 2/03/2011 |
69.69667 |
69.09 |
| 2/04/2011 |
68.94667 |
69.05083 |
| 2/05/2011 |
68.83333 |
69.20083 |
| 2/06/2011 |
69.13333 |
69.32917 |
| 2/07/2011 |
70.81667 |
69.60667 |
| 1/08/2011 |
72.27 |
70.015 |
| 1/09/2011 |
73.46 |
70.4475 |
| 1/10/2011 |
73.77 |
70.815 |
| 1/11/2011 |
72.80667 |
71.0225 |
| 1/12/2011 |
71.53667 |
70.95667 |
| 1/01/2012 |
70.57667 |
71.0275 |
| 31/01/2012 |
70.91 |
71.205 |
| 2/03/2012 |
72.31667 |
71.61167 |
| 1/04/2012 |
73.52 |
72.17083 |
| 1/05/2012 |
74.05333 |
72.51 |
| 1/06/2012 |
72.99333 |
72.57667 |
| 2/07/2012 |
72.39667 |
72.56583 |
| 1/08/2012 |
72.09333 |
72.46583 |
| 1/09/2012 |
72.9 |
72.43667 |
| 1/10/2012 |
73.48333 |
72.49417 |
| 31/10/2012 |
73.77667 |
72.70833 |
| 1/12/2012 |
73.87667 |
73.02167 |
| 1/01/2013 |
74.21333 |
73.40333 |
| 31/01/2013 |
74.70667 |
73.6575 |
| 2/03/2013 |
75.57 |
73.835 |
| 2/04/2013 |
75.93667 |
74.0075 |
| 2/05/2013 |
76.64667 |
74.30583 |
| 2/06/2013 |
76.74333 |
74.7725 |
| 2/07/2013 |
76.25333 |
74.97167 |
| 1/08/2013 |
75.45 |
75.145 |
| 1/09/2013 |
75.1 |
75.3225 |
| 1/10/2013 |
75.97333 |
75.59417 |
| 1/11/2013 |
76.94667 |
75.9375 |
| 1/12/2013 |
77.69667 |
76.2775 |
| 1/01/2014 |
78.18667 |
76.5875 |
| 31/01/2014 |
78.68333 |
76.93167 |
| 2/03/2014 |
79.13 |
77.1675 |
| 2/04/2014 |
80.04333 |
77.61417 |
| 2/05/2014 |
80.72333 |
77.95083 |
| 2/06/2014 |
81.44 |
78.34167 |
| 2/07/2014 |
81.52 |
78.93083 |
| 1/08/2014 |
81.62333 |
79.49417 |
| 1/09/2014 |
81.11333 |
79.845 |
| 1/10/2014 |
80.11 |
79.965 |
| 1/11/2014 |
78.38667 |
79.85417 |
| 1/12/2014 |
77.56 |
79.81083 |
| 1/01/2015 |
77.47667 |
79.7875 |
| 31/01/2015 |
77.95 |
79.67083 |
| 2/03/2015 |
77.86 |
79.49333 |
| 2/04/2015 |
77.87 |
79.24417 |
| 2/05/2015 |
78.2 |
79.04 |
| 2/06/2015 |
77.97667 |
78.6275 |
| 2/07/2015 |
76.21 |
77.91667 |
| 1/08/2015 |
73.29 |
76.95667 |
| 1/09/2015 |
71.23333 |
76.1575 |
| 1/10/2015 |
69.83333 |
75.3475 |
| 1/11/2015 |
70.29667 |
74.93417 |
| 1/12/2015 |
70.65333 |
74.43083 |
| 1/01/2016 |
72.14 |
74.01333 |
| 31/01/2016 |
72.18333 |
73.4925 |
| 2/03/2016 |
72.50333 |
73.09167 |
| 1/04/2016 |
72.15667 |
72.585 |
| 1/05/2016 |
72.44667 |
72.05417 |
| 1/06/2016 |
72.61667 |
71.75167 |
| 2/07/2016 |
73.63 |
71.94 |
| 1/08/2016 |
74.79667 |
72.43083 |
| 1/09/2016 |
76.1 |
72.96833 |
| 1/10/2016 |
76.97 |
73.72417 |
| 31/10/2016 |
77.16 |
74.14667 |
| 1/12/2016 |
77.54667 |
74.69167 |
| 1/01/2017 |
77.64 |
75.09917 |
| 31/01/2017 |
78.2 |
75.65083 |
| 2/03/2017 |
78.48333 |
76.18667 |
| 2/04/2017 |
77.95667 |
76.54917 |
| 2/05/2017 |
77.11 |
76.81667 |
| 2/06/2017 |
76.01667 |
77.03667 |
| 2/07/2017 |
76.47667 |
77.26083 |
| 1/08/2017 |
77.27667 |
77.43667 |
| 1/09/2017 |
77.80333 |
77.4625 |
| 1/10/2017 |
77.11333 |
77.29667 |
| 1/11/2017 |
75.88667 |
77.11833 |
| 1/12/2017 |
74.56333 |
76.71667 |
| 1/01/2018 |
73.77333 |
76.33 |
| 31/01/2018 |
73.83 |
76.02583 |
| 2/03/2018 |
74.49 |
75.71833 |
| 2/04/2018 |
74.90333 |
75.56667 |
| 2/05/2018 |
74.89667 |
75.4725 |
| 2/06/2018 |
74.20333 |
75.265 |
| 2/07/2018 |
73.79667 |
74.89667 |
| 1/08/2018 |
73.15667 |
74.4425 |
| 1/09/2018 |
72.92667 |
74.04583 |
| 1/10/2018 |
72.35667 |
73.7075 |
| 1/11/2018 |
71.92667 |
73.4525 |
| 1/12/2018 |
72.52 |
73.535 |
| 1/01/2019 |
73.5 |
73.63917 |
| 31/01/2019 |
74.14 |
73.53 |
| 2/03/2019 |
74.15333 |
73.45083 |
| 2/04/2019 |
73.99 |
73.41083 |
| 2/05/2019 |
73.87 |
73.27333 |
| 2/06/2019 |
73.24333 |
73.21083 |
| 2/07/2019 |
72.66667 |
73.12833 |
| 1/08/2019 |
72.69667 |
73.15833 |
| 1/09/2019 |
72.53 |
73.11167 |
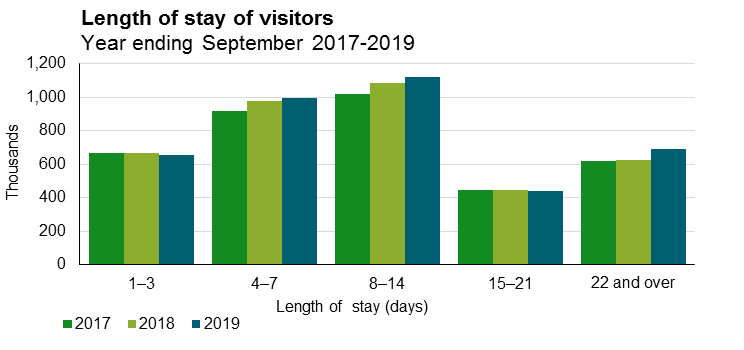
Visitors are staying in New Zealand longer
The median length of stay of visitors increased 3.2 per cent to 9.1 days, driven by a 10.7 per cent increase in the people staying 22 days and over, and a 2.5 per cent reduction of people on short trips of 1 – 3 days.
Source: International Travel, StatsNZ
Length of stay of visitors - data table
| |
Year ended September |
Change |
| Length of stay (days) |
2015 |
2016 |
2017 |
2018 |
2019 |
Number |
Percent |
| 1–3 |
509,648 |
587,920 |
669,184 |
669,216 |
652,154 |
-17,062 |
-2.5 |
| 4–7 |
815,600 |
884,832 |
916,240 |
978,416 |
995,478 |
17,062 |
1.7 |
| 8–14 |
813,712 |
924,384 |
1,019,008 |
1,083,216 |
1,123,159 |
39,943 |
3.7 |
| 15–21 |
357,424 |
394,880 |
444,512 |
447,104 |
441,854 |
-5,250 |
-1.2 |
| 22 and over |
540,704 |
592,704 |
617,168 |
623,120 |
689,607 |
66,487 |
10.7 |
| Median |
8.9 |
8.9 |
8.9 |
8.8 |
9.1 |
0.3 |
3.2 |
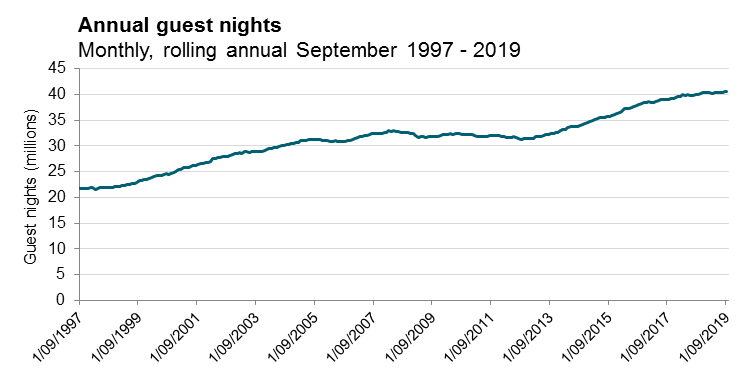
Final release of Accommodation Survey data
The final release of accommodation survey information by Stats NZ was released for the September 2019 month. The Ministry of Business, Innovation and Employment is currently in the process of procuring a new provider for accommodation data, with the intention to expand into other accommodation types previously not covered, and to improve access and usability of the data.
Over the 22 years that the accommodation survey has been running, guest nights spent in commercial accommodation have grown considerably, from around 22 million in 1997 to over 40 million in 2019. Population growth, increases in annual leave, and increased international visitor volumes have driven substantial growth over the life of the survey.
Source: Accommodation Survey, Stats NZ
Annual guest nights - data table
| Date |
Annual guest nights, monthly, 1997–2019 |
| 1/06/1997 |
21805908 |
| 1/07/1997 |
21851601 |
| 1/08/1997 |
21859765 |
| 1/09/1997 |
21651689 |
| 1/10/1997 |
21814150 |
| 1/11/1997 |
21721662 |
| 1/12/1997 |
21725247 |
| 1/01/1998 |
21865284 |
| 1/02/1998 |
21861156 |
| 1/03/1998 |
21631383 |
| 1/04/1998 |
21828120 |
| 1/05/1998 |
21878714 |
| 1/06/1998 |
21855550 |
| 1/07/1998 |
21885278 |
| 1/08/1998 |
21881732 |
| 1/09/1998 |
21972782 |
| 1/10/1998 |
22017908 |
| 1/11/1998 |
22097066 |
| 1/12/1998 |
22133238 |
| 1/01/1999 |
22223476 |
| 1/02/1999 |
22234748 |
| 1/03/1999 |
22379174 |
| 1/04/1999 |
22468075 |
| 1/05/1999 |
22445411 |
| 1/06/1999 |
22704122 |
| 1/07/1999 |
22802362 |
| 1/08/1999 |
22910417 |
| 1/09/1999 |
23250502 |
| 1/10/1999 |
23263396 |
| 1/11/1999 |
23461011 |
| 1/12/1999 |
23532018 |
| 1/01/2000 |
23632541 |
| 1/02/2000 |
23878171 |
| 1/03/2000 |
24024677 |
| 1/04/2000 |
24271027 |
| 1/05/2000 |
24353525 |
| 1/06/2000 |
24357761 |
| 1/07/2000 |
24507108 |
| 1/08/2000 |
24639880 |
| 1/09/2000 |
24548812 |
| 1/10/2000 |
24654758 |
| 1/11/2000 |
24794050 |
| 1/12/2000 |
25128606 |
| 1/01/2001 |
25421456 |
| 1/02/2001 |
25518221 |
| 1/03/2001 |
25776447 |
| 1/04/2001 |
25736217 |
| 1/05/2001 |
25861686 |
| 1/06/2001 |
25978649 |
| 1/07/2001 |
26116135 |
| 1/08/2001 |
26290766 |
| 1/09/2001 |
26450582 |
| 1/10/2001 |
26580366 |
| 1/11/2001 |
26625828 |
| 1/12/2001 |
26759504 |
| 1/01/2002 |
26859542 |
| 1/02/2002 |
27043667 |
| 1/03/2002 |
27497119 |
| 1/04/2002 |
27522695 |
| 1/05/2002 |
27684489 |
| 1/06/2002 |
27790298 |
| 1/07/2002 |
27914554 |
| 1/08/2002 |
27985632 |
| 1/09/2002 |
28052488 |
| 1/10/2002 |
28180978 |
| 1/11/2002 |
28410199 |
| 1/12/2002 |
28504234 |
| 1/01/2003 |
28548077 |
| 1/02/2003 |
28732289 |
| 1/03/2003 |
28560323 |
| 1/04/2003 |
28841183 |
| 1/05/2003 |
28881588 |
| 1/06/2003 |
28817715 |
| 1/07/2003 |
28868204 |
| 1/08/2003 |
28870818 |
| 1/09/2003 |
28965616 |
| 1/10/2003 |
28984577 |
| 1/11/2003 |
29002454 |
| 1/12/2003 |
29162458 |
| 1/01/2004 |
29376865 |
| 1/02/2004 |
29471950 |
| 1/03/2004 |
29575876 |
| 1/04/2004 |
29682461 |
| 1/05/2004 |
29752128 |
| 1/06/2004 |
29970493 |
| 1/07/2004 |
30084694 |
| 1/08/2004 |
30167556 |
| 1/09/2004 |
30306857 |
| 1/10/2004 |
30368960 |
| 1/11/2004 |
30504885 |
| 1/12/2004 |
30546091 |
| 1/01/2005 |
30727584 |
| 1/02/2005 |
30769515 |
| 1/03/2005 |
31100522 |
| 1/04/2005 |
31054356 |
| 1/05/2005 |
31054318 |
| 1/06/2005 |
31171438 |
| 1/07/2005 |
31226558 |
| 1/08/2005 |
31232909 |
| 1/09/2005 |
31176477 |
| 1/10/2005 |
31224131 |
| 1/11/2005 |
31190691 |
| 1/12/2005 |
31087501 |
| 1/01/2006 |
31007658 |
| 1/02/2006 |
31082922 |
| 1/03/2006 |
30859499 |
| 1/04/2006 |
30958826 |
| 1/05/2006 |
30987329 |
| 1/06/2006 |
30864234 |
| 1/07/2006 |
30777859 |
| 1/08/2006 |
30838886 |
| 1/09/2006 |
30904288 |
| 1/10/2006 |
31012665 |
| 1/11/2006 |
31130261 |
| 1/12/2006 |
31268112 |
| 1/01/2007 |
31367000 |
| 1/02/2007 |
31562549 |
| 1/03/2007 |
31794410 |
| 1/04/2007 |
31863222 |
| 1/05/2007 |
31967610 |
| 1/06/2007 |
32074457 |
| 1/07/2007 |
32201549 |
| 1/08/2007 |
32331328 |
| 1/09/2007 |
32422897 |
| 1/10/2007 |
32391468 |
| 1/11/2007 |
32446224 |
| 1/12/2007 |
32472530 |
| 1/01/2008 |
32572364 |
| 1/02/2008 |
32690307 |
| 1/03/2008 |
32921185 |
| 1/04/2008 |
32824652 |
| 1/05/2008 |
32916263 |
| 1/06/2008 |
32822507 |
| 1/07/2008 |
32775535 |
| 1/08/2008 |
32693061 |
| 1/09/2008 |
32573965 |
| 1/10/2008 |
32676539 |
| 1/11/2008 |
32563161 |
| 1/12/2008 |
32480393 |
| 1/01/2009 |
32332672 |
| 1/02/2009 |
32069969 |
| 1/03/2009 |
31697262 |
| 1/04/2009 |
31814201 |
| 1/05/2009 |
31801602 |
| 1/06/2009 |
31719502 |
| 1/07/2009 |
31790579 |
| 1/08/2009 |
31788068 |
| 1/09/2009 |
31852740 |
| 1/10/2009 |
31864106 |
| 1/11/2009 |
31876373 |
| 1/12/2009 |
32013662 |
| 1/01/2010 |
32201363 |
| 1/02/2010 |
32250715 |
| 1/03/2010 |
32324704 |
| 1/04/2010 |
32346356 |
| 1/05/2010 |
32224167 |
| 1/06/2010 |
32337024 |
| 1/07/2010 |
32341413 |
| 1/08/2010 |
32340447 |
| 1/09/2010 |
32313541 |
| 1/10/2010 |
32270919 |
| 1/11/2010 |
32323289 |
| 1/12/2010 |
32246583 |
| 1/01/2011 |
32142597 |
| 1/02/2011 |
32092012 |
| 1/03/2011 |
31914235 |
| 1/04/2011 |
31808485 |
| 1/05/2011 |
31825406 |
| 1/06/2011 |
31830870 |
| 1/07/2011 |
31874500 |
| 1/08/2011 |
32044612 |
| 1/09/2011 |
32050107 |
| 1/10/2011 |
32013336 |
| 1/11/2011 |
31973154 |
| 1/12/2011 |
32016011 |
| 1/01/2012 |
31832848 |
| 1/02/2012 |
31766286 |
| 1/03/2012 |
31741681 |
| 1/04/2012 |
31685042 |
| 1/05/2012 |
31679426 |
| 1/06/2012 |
31751633 |
| 1/07/2012 |
31600917 |
| 1/08/2012 |
31398542 |
| 1/09/2012 |
31320227 |
| 1/10/2012 |
31402138 |
| 1/11/2012 |
31369028 |
| 1/12/2012 |
31438012 |
| 1/01/2013 |
31429745 |
| 1/02/2013 |
31478473 |
| 1/03/2013 |
31805778 |
| 1/04/2013 |
31772343 |
| 1/05/2013 |
31923279 |
| 1/06/2013 |
31969497 |
| 1/07/2013 |
32138690 |
| 1/08/2013 |
32283162 |
| 1/09/2013 |
32386766 |
| 1/10/2013 |
32425076 |
| 1/11/2013 |
32600248 |
| 1/12/2013 |
32709648 |
| 1/01/2014 |
32964018 |
| 1/02/2014 |
33221314 |
| 1/03/2014 |
33126810 |
| 1/04/2014 |
33517943 |
| 1/05/2014 |
33690125 |
| 1/06/2014 |
33710060 |
| 1/07/2014 |
33805336 |
| 1/08/2014 |
33876803 |
| 1/09/2014 |
34015001 |
| 1/10/2014 |
34202669 |
| 1/11/2014 |
34369224 |
| 1/12/2014 |
34610955 |
| 1/01/2015 |
34779091 |
| 1/02/2015 |
34968819 |
| 1/03/2015 |
35216738 |
| 1/04/2015 |
35324374 |
| 1/05/2015 |
35447075 |
| 1/06/2015 |
35505560 |
| 1/07/2015 |
35599693 |
| 1/08/2015 |
35691511 |
| 1/09/2015 |
35814301 |
| 1/10/2015 |
35894483 |
| 1/11/2015 |
36030261 |
| 1/12/2015 |
36253894 |
| 1/01/2016 |
36531835 |
| 1/02/2016 |
36792710 |
| 1/03/2016 |
37228567 |
| 1/04/2016 |
37344125 |
| 1/05/2016 |
37335424 |
| 1/06/2016 |
37565400 |
| 1/07/2016 |
37734430 |
| 1/08/2016 |
37882702 |
| 1/09/2016 |
38040747 |
| 1/10/2016 |
38211322 |
| 1/11/2016 |
38369438 |
| 1/12/2016 |
38500899 |
| 1/01/2017 |
38556463 |
| 1/02/2017 |
38540077 |
| 1/03/2017 |
38418276 |
| 1/04/2017 |
38640791 |
| 1/05/2017 |
38811942 |
| 1/06/2017 |
38957936 |
| 1/07/2017 |
38995323 |
| 1/08/2017 |
38986908 |
| 1/09/2017 |
39022755 |
| 1/10/2017 |
39165490 |
| 1/11/2017 |
39306060 |
| 1/12/2017 |
39464430 |
| 1/01/2018 |
39534095 |
| 1/02/2018 |
39615912 |
| 1/03/2018 |
39926326 |
| 1/04/2018 |
39894323 |
| 1/05/2018 |
39934652 |
| 1/06/2018 |
39893225 |
| 1/07/2018 |
39897177 |
| 1/08/2018 |
39980761 |
| 1/09/2018 |
40059134 |
| 1/10/2018 |
40180689 |
| 1/11/2018 |
40310113 |
| 1/12/2018 |
40366981 |
| 1/01/2019 |
40365581 |
| 1/02/2019 |
40350011 |
| 1/03/2019 |
40181565 |
| 1/04/2019 |
40356122 |
| 1/05/2019 |
40378119 |
| 1/06/2019 |
40408352 |
| 1/07/2019 |
40429785 |
| 1/08/2019 |
40522830 |
| 1/09/2019 |
40545702 |
The increase in nights spent in short-term commercial accommodation has been supported by a 15 per cent increase in accommodation establishments during the length of the survey, with just over 3,000 providers surveyed in the September 2019 year.
There were 40.5 million guest nights in measured commercial accommodation (hotels, motels, backpackers and holiday parks) for the year ending September 2019, up 1.2 per cent (or 487,000) from the previous year. This figure includes both domestic and international visitors. Domestic visitors make up approximately 60 per cent of all guest nights.
Domestic guest nights continue to grow while international guest nights ease
For the September 2019 quarter compared with the September 2018 quarter, domestic guest nights increased 4.1 per cent, while international guest nights fell 2.5 per cent.
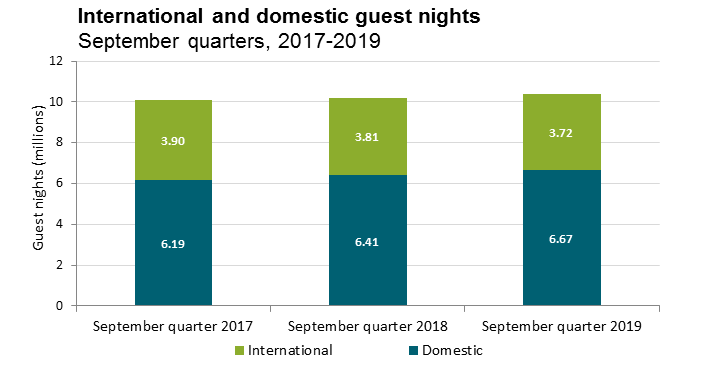
Source: Accommodation Survey, Stats NZ
International and domestic guest nights - data table
| Date |
Domestic |
International |
| September quarter 2017 |
6192000 |
3900000 |
| September quarter 2018 |
6405000 |
3812000 |
| September quarter 2019 |
6668000 |
3718000 |
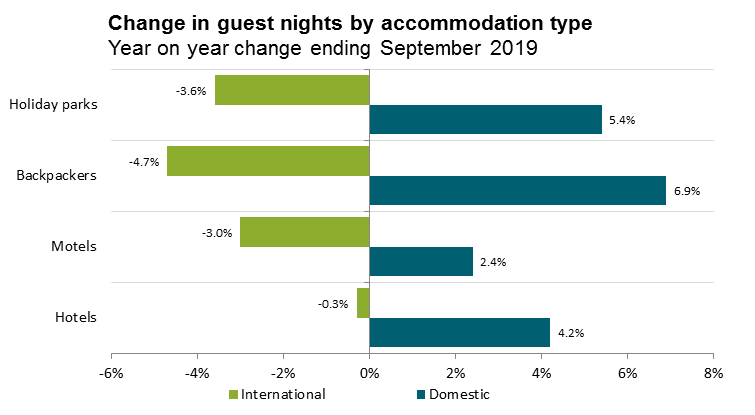
Growth in domestic guest nights was distributed across the range of commercial accommodation types. Holiday park guest nights were up 5.4 per cent, backpackers were up 6.9 per cent, hotels were up 4.2 per cent, and motels were up 2.4 per cent.
International guest nights continued to display the opposite trend, with backpackers contributing the most to the fall in visitor nights, down 4.7 per cent on last year. Holiday park guest nights were down 3.6 per cent, and motels were down three per cent.
Please note that this measure is partial, and does not include guest nights in hosted accommodation, such as homes rented through a peer-to-peer network such as Airbnb. It also does not include guest nights in holiday homes or people staying with friends and family.
Source: Accommodation Survey, Stats NZ
Change in guest nights by accommodation type - data table
| |
Hotels |
Motels |
Backpackers |
Holiday parks |
| Domestic |
4.20% |
2.40% |
6.90% |
5.40% |
| International |
-0.30% |
-3% |
-4.70% |
-3.60% |
Tourism Satellite Account shows tourism expenditure lifted 4 per cent to reach $40.9 billion
The Tourism Satellite Account (TSA) is part of a core set of tourism data that integrates information about the supply and use of tourism-related goods and services into a single format. The TSA cuts across standard industry definitions found in the national accounts, unlike ‘conventional’ industries such as agriculture or manufacturing. The TSA aggregates proportions of sub-industries relevant to tourism such as, Accommodation, Food and beverage services, and Transportation. It summarises the contribution tourism makes to production and employment, ensuring that the importance of the tourism sector is measured and understood in the context of the New Zealand economy as a whole.
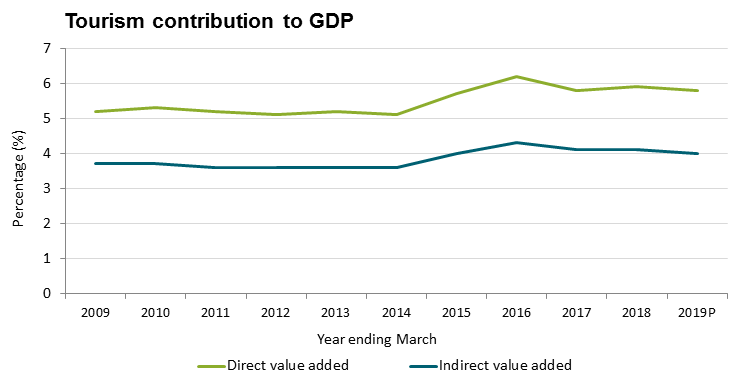
Tourism Satellite Account data for the year ending March 2019, shows that tourism directly accounted for 5.8 per cent ($16.2 billion) of Gross Domestic Product (GDP). This is known as the direct ‘value added’ tourism businesses provide to the goods and services they purchase and use in the production of their own goods and services for tourists. The indirect value-add of industries supporting tourism generated an additional $11.2 billion, or four per cent of GDP.
Tourism contribution to GDP - data table
| Year |
Direct value added |
Indirect value added |
| 2009 |
5.2 |
3.7 |
| 2010 |
5.3 |
3.7 |
| 2011 |
5.2 |
3.6 |
| 2012 |
5.1 |
3.6 |
| 2013 |
5.2 |
3.6 |
| 2014 |
5.1 |
3.6 |
| 2015 |
5.7 |
4 |
| 2016 |
6.2 |
4.3 |
| 2017 |
5.8 |
4.1 |
| 2018 |
5.9 |
4.1 |
| 2019P |
5.8 |
4 |
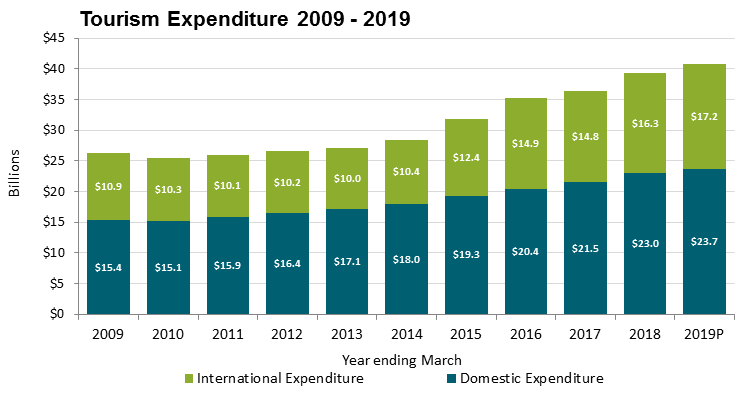
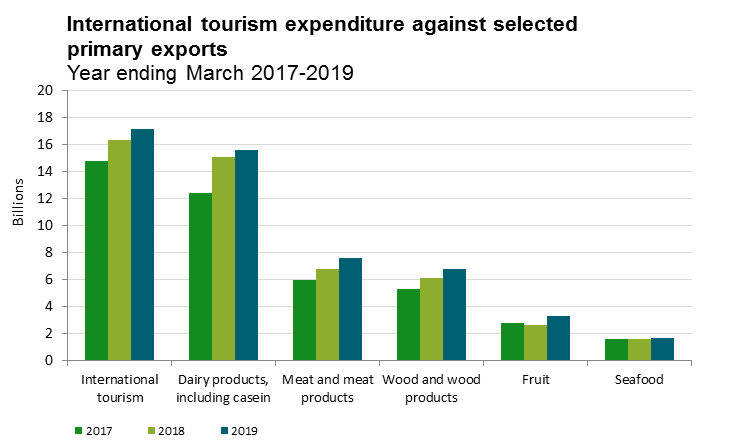
International tourism spend increased to $17.2 billion (up 5.2 per cent on last year), while domestic tourism spend increased to $23.7 billion (up 3.3 per cent). Overall, tourism expenditure lifted 4 per cent to reach $40.9 billion, following an increase of 8.1 per cent in the March 2018 year. Tourists generated $3.8 billion in goods and services tax revenue, with $1.8 billion coming from international tourists.
Tourism Expenditure 2009 - 2019 - data table
| Year ended March |
International tourism expenditure ($ million) |
Domestic tourism expenditure ($ million) |
| 1999 |
5,999 |
|
9,371 |
R |
| 2000 |
7,122 |
|
10,284 |
R |
| 2001 |
8,169 |
|
10,529 |
R |
| 2002 |
8,989 |
|
11,060 |
R |
| 2003 |
9,494 |
|
12,044 |
R |
| 2004 |
9,603 |
|
12,243 |
R |
| 2005 |
9,987 |
|
12,560 |
R |
| 2006 |
10,065 |
|
13,207 |
R |
| 2007 |
10,676 |
|
13,917 |
R |
| 2008 |
11,010 |
|
14,733 |
R |
| 2009 |
10,927 |
|
15,354 |
R |
| 2010 |
10,316 |
|
15,108 |
R |
| 2011 |
10,090 |
|
15,872 |
R |
| 2012 |
10,151 |
|
16,449 |
R |
| 2013 |
9,958 |
|
17,119 |
R |
| 2014 |
10,444 |
|
17,973 |
R |
| 2015 |
12,426 |
R |
19,313 |
R |
| 2016 |
14,865 |
R |
20,411 |
R |
| 2017 |
14,794 |
R |
21,525 |
R |
| 2018 |
16,319 |
R |
22,950 |
R |
| 2019P |
17,162 |
|
23,696 |
|
1. Individual figures may not sum to stated totals due to rounding.
Symbols:
P provisional
R revised
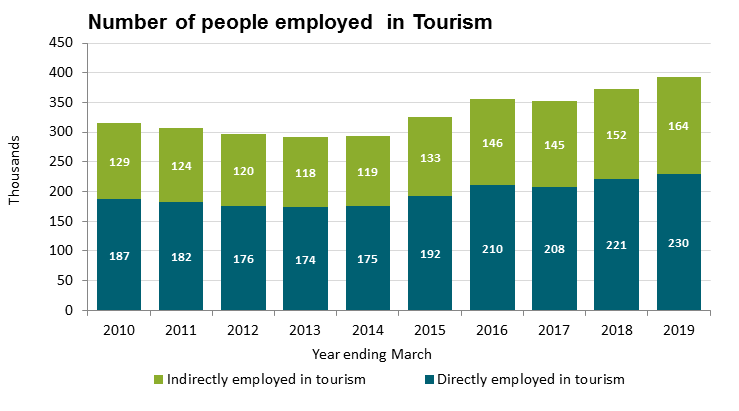
For the year ending March 2019, tourism directly employed 229,566 people, generating 8.4 per cent of total employment in New Zealand. This compares with tourism generating 5.8 per cent of direct value added to GDP. As tourism contributes more to total employment than it does to direct value added, this reflects a relatively high level of labour intensity in tourism industries. A further 163,713 people were indirectly employed in tourism, generating an additional six per cent share of total employment.
Number of people employed in Tourism - data table
| Year |
Directly employed in tourism |
Indirectly employed in tourism |
| 2010 |
187077 |
128877 |
| 2011 |
181866 |
124437 |
| 2012 |
175827 |
120306 |
| 2013 |
173682 |
118476 |
| 2014 |
174972 |
119130 |
| 2015 |
191763 |
133038 |
| 2016 |
210093 |
146115 |
| 2017 |
208251 |
144639 |
| 2018 |
221046 |
152238 |
| 2019 |
229566 |
163713 |
International tourism continues to be a significant export earner for New Zealand, compared with other traditional export products. In the year ended March 2019, international tourism’s contribution to total exports was $17.2 billion (20.4 per cent of exports). The export receipts from dairy products, including casein, totalled $15.6 billion (18.5 per cent of exports in 2019).
International tourism expenditure against selected primary exports - data table
| Year ended March |
Selected export |
| International tourism |
Dairy products, including casein |
Meat and meat products |
Wood and wood products |
Fruit |
Seafood |
| $(million) |
| 1999 |
5,999 |
4,703 |
2,843 |
2,348 |
909 |
1,173 |
| 2000 |
7,122 |
4,460 |
3,198 |
2,950 |
1,059 |
1,199 |
| 2001 |
8,169 |
6,167 |
3,854 |
3,635 |
1,074 |
1,334 |
| 2002 |
8,989 |
7,491 |
4,414 |
3,536 |
1,051 |
1,388 |
| 2003 |
9,494 |
5,919 |
4,242 |
3,653 |
1,054 |
1,309 |
| 2004 |
9,603 |
5,707 |
4,232 |
3,076 |
1,047 |
1,062 |
| 2005 |
9,987 |
5,678 |
4,688 |
3,203 |
1,356 |
1,136 |
| 2006 |
10,065 |
5,884 |
4,411 |
3,116 |
1,181 |
1,146 |
| 2007 |
10,676 |
7,332 |
4,813 |
3,497 |
1,191 |
1,193 |
| 2008 |
11,010 |
9,277 |
4,416 |
3,406 |
1,298 |
1,098 |
| 2009 |
10,927 |
9,975 |
5,432 |
3,472 |
1,497 |
1,289 |
| 2010 |
10,316 |
8,972 |
4,997 |
3,605 |
1,586 |
1,201 |
| 2011 |
10,090 |
11,576 |
5,199 |
4,413 |
1,446 |
1,350 |
| 2012 |
10,151 |
12,704 |
5,389 |
4,327 |
1,583 |
1,388 |
| 2013 |
9,958 |
12,349 |
5,279 |
4,385 |
1,568 |
1,369 |
| 2014 |
10,444 |
15,896 |
5,492 |
5,154 |
1,548 |
1,337 |
| 2015 |
12,426 R |
14,168 |
6,194 |
4,633 |
1,758 |
1,380 |
| 2016 |
14,865 R |
12,346 |
6,580 |
4,855 |
2,362 |
1,527 |
| 2017 |
14,794 R |
12,374 |
5,983 |
5,315 |
2,758 |
1,586 |
| 2018 |
16,319 R |
15,078 |
6,797 |
6,144 |
2,648 |
1,619 |
| 2019P |
17,162 |
15,574 |
7,632 |
6,773 |
3,294 |
1,696 |
1. Exports are valued fob (free on board – the value of goods at New Zealand ports before export) and include re-exports.
Symbols:
P provisional
R revised
Last updated: 11 February 2020