Where will we find our future workforce?
On this page
Sources of skills and labour
We need to make sure that we have people with the right skills for the 70,000 new jobs to be created across our region in the next 15 years and also to replace people who exit the region’s labour market.
There are several potential pools of labour:
- New entrants to the workforce (school leavers and new graduates from tertiary education; people from outside the workforce, for example people who have been undertaking other responsibilities such as unpaid caring for others)
- Re-entrants to the workforce
- The existing workforce (whether already in an industry or occupation or outside, including the underemployed)
- Migrants (to augment the domestic workforce where there is real need or advantage)
New entrants into the workforce
A number of people enter the region’s workforce for the first time each year. This includes about 40% of our 6,000 school leavers. Of those that leave school between 77% and 89% of them have at least NCEA Level 2. As shown in the table below, there are clear and concerning regional and ethnicity variances in achievement rates. This is important because early education, training and employment experiences have long lasting effects on wages later in life, adult employment and life satisfaction. The data below is taken from 2019 to exclude distorting effects from COVID.
Ministry of Education: Education Counts(external link)
| All leavers | Female | Male | Māori | Pacific | Asian | MELAA | Other | European Pākeha | |
|---|---|---|---|---|---|---|---|---|---|
| Kapiti Coast District | 87.6 | 90 | 85.2 | 80.9 | 90.9 | 94.9 | 90 | x | 87.6 |
| Porirua City | 77.2 | 78 | 76.5 | 71.3 | 79.1 | 86.7 | 76.9 | x | 79.3 |
| Upper Hutt City | 84.9 | 82.6 | 86.1 | 77.8 | 83 | 84.1 | 77.8 | x | 86 |
| Lower Hutt City | 80.5 | 84.6 | 75.1 | 68.5 | 72.9 | 84.6 | 86.5 | 85.7 | 83.4 |
| Wellington City | 89.7 | 91.5 | 88 | 81.1 | 85.3 | 91.5 | 74 | 68.4 | 92 |
| Masterton District | 81.1 | 87.4 | 74.2 | 67 | 92.9 | 91.7 | 100 | x | 82.7 |
| Carterton District | 84.6 | x | 80 | x | n | x | n | n | 82.5 |
| South Wairarapa District | 79.8 | 70.6 | 85 | 65 | x | x | x | n | 82.5 |
| New Zealand Total | 78.8 | 81.3 | 76.3 | 64.7 | 73.7 | 89.7 | 83.6 | 79.8 | 82 |
Table 3: School leavers with NCEA Level 2 or above 2019 (Source: Ministry of Education, Education Counts, Indicators)
Recent data shows that, of our region’s school leavers who go on to tertiary study, around 75% stay in the region to study. Of these, the largest proportion (almost half) enrolled at university, about a quarter at a polytechnic, about 20% at a private training institution, and only about 10% train as apprentices.
Most enrolments were for Level 7 (degree) courses, with less than a third studying at level 3 or 4 (usually certificate level), and very few at levels 5 and 6 (usually diploma level).
Ministry of Education: Education Counts(external link)
There appears to be a mismatch between what people are studying and the skill requirements for roles in the region (Infometrics 2021: Regional Skills Outlook: Tertiary Education). This indicates a potential lack of awareness of people going into study about the types of roles and skills requirements that are actually on offer in the region.
Re-entrants to the workforce
Each year a number of people re-enter the workforce. This is usually from an extended time out of the labour market, for reasons such as unemployment, health issues and caring responsibilities. We have about 114,000 people who are not in the labour force. Many of these will be retired and may have no plans for employment; others may be interested in employment. The figure represents a potential group of people who could be utilised to meet current and future labour and skill needs.
This includes about 17,000 people across the region who receive Jobseeker Support benefits (Ministry of Social Development, Characteristics of working-age recipients of main benefits, December 2022). Around 9,000 of our benefit recipients have been on a main benefit for more than one year, which suggests that they are a group that would need more support to be reintroduced to the labour market.
We need to ensure that these people are supported to retrain or upskill, if required, to help them to find work. We also need to make sure that they are aware of what opportunities are on offer in the region and how to best access them. This means that education and employment initiatives should focus on learners from all stages, rather than just school leavers.
Qualification completions (2019-27)
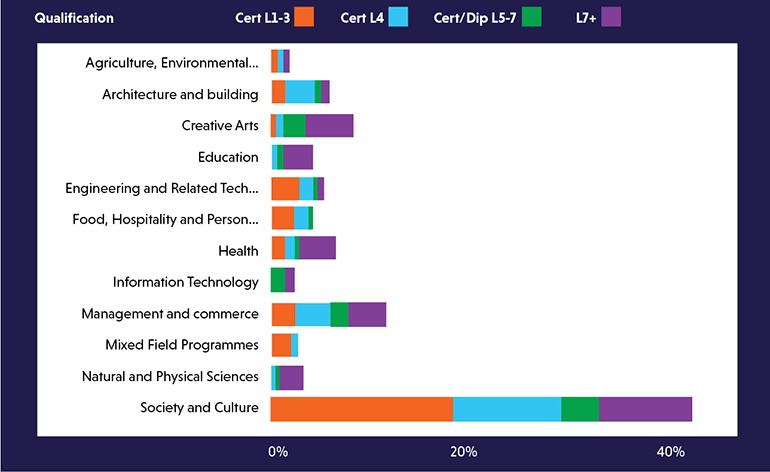
Text description of image
Job openings by qualification completions (2020-21)
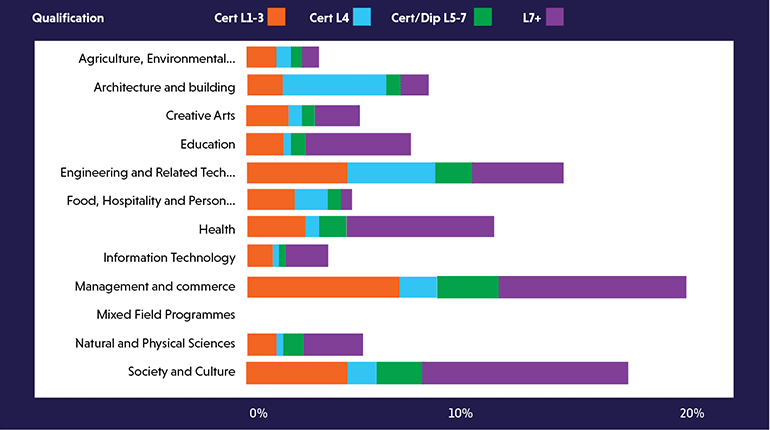
Text description of image
The existing workforce
In our region we have about 14,000 who are underemployed and in addition, people who are already working 30 hours and would like to work more hours. We know that certain groups of the population are overrepresented in these figures, and have generally poorer labour market outcomes, including income, mobility and educational or training access and achievement.
We need to look at how we better utilise our workforce, especially those who are skilled. This could include job shaping to offer jobs that fit around school hours or offering flexible working arrangements for people with disabilities. Work design and employers’ policies and practices around retention are key here.
Better utilisation of our workforce would also see people have the opportunity to progress within their careers such as moving off the tools into management or more senior roles. There need to be clear pathways and training to support this.
Within the existing workforce, a large number of people change careers each year, which often requires them to upskill. These people often need to earn and learn. As mentioned above we need to make our education and employment system work for people at every stage of their life.
Migrants
In July 2021 there were about 25,000 migrant workers, across all visa types in the region. This represents about 9% of workforce (down from 10% pre-pandemic). Some of our sectors have strong reliance on migrant labour, including (MBIE, Migrant Employment Data. Figures as at July 2021):
- Accommodation – 23% of the workforce were migrant workers
- Food and beverage services – 20% of the workforce were migrant workers
- Residential care services – 19.1% of the workforce were migrant workers
- Computer system design – 14.9% of the workforce were migrant workers
- Heavy and civil engineering – 14.3% of the workforce were migrant workers
Looking to the future, as the border reopens and government immigration policy shifts, some roles and sectors will continue to need immigration for highly skilled roles. However, we are likely to see fewer immigrants available for less skilled roles, particularly in the visitor sector (where there is the highest reliance on migrant labour).
Our priority communities include former refugees, new migrants and ethnic communities, but note this does not include workers on temporary work visas.
Other factors affecting our future workforce
In addition to growth (and contraction) in sectors, a range of other factors will influence the shape of the future Wellington workforce.
These factors include:
A growing population: Wellington’s population is set to grow significantly, with some estimates at around 50,000 by 2038, while the Wellington Regional Growth Framework is working of a scenario of 200,000 more people in 30 years. An important part of the framework is to plan for and manage housing availability and cost, both of which are currently issues across the region, affecting where people live and work.
Wellington Regional Growth Framework(external link)
Population growth is also driving demand for residential construction, as well as commercial construction and infrastructure, in particular for transport and water. This in turn is driving even higher demand for workers in construction and infrastructure sector.
An ageing population: The region’s population is ageing, and some occupations are due to see a lot of experienced people retire over the next few years. On the flipside, for a range of reasons, we’ll see more older workers staying in the workforce. For some this will be a choice, for others it will be an economic necessity. There are opportunities for utilising their experience to boost mentoring and provide training and supervision. Making the most of these experienced people may require more mid-career reskilling, and suitable ways to do this. Employers will need to make work attractive, manageable and flexible to retain these workers and their skills and experience in their firms.
A changing demographic: We’re going to see more Māori and Pacific peoples make up the working age population. We need to ensure they have access to the skills and training they need to fully participate in the workforce. Employers and industry also need to be ready to play their part as partners in a country of two peoples, and many cultures with workplaces that walk the walk in being inclusive, healthy, and productive, and where workers know who they are, and that they belong.
Workplaces need to change to reflect the workforce, and the population. A multi-cultural workplace is one that inclusively brings together and values people with different approaches, attitudes and experiences. This includes not only gender, ethnicity and religion but also things such as age, education, sexuality and disability.
Photo: WellingtonNZ