Country
The commentary below presents the national context at the country level for tourism in the year ending September 2019 (and for the September 2019 quarter where available). Key findings are below:
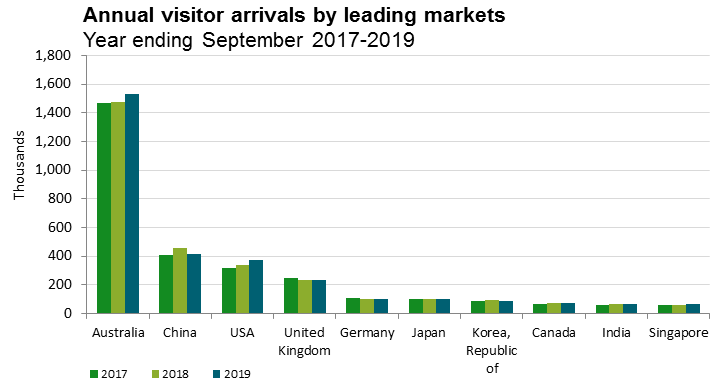
Arrivals from Australian and North American residents drive growth in visitor arrival statistics
Overseas visitor arrivals increased by 94,300 (2.5 per cent) to reach 3.9 million for the year ended September 2019, compared with the year prior. The biggest changes in visitor arrivals were from the Australian market, up 55,700; the United States market, up 28,600; and the Chinese market, down 39,900.
Source: International Travel, StatsNZ
Annual visitor arrivals by leading markets - data table
| Country |
2017 |
2018 |
2019 |
| Australia |
1,466,624 |
1,474,464 |
1,530,197 |
| China, People's Republic of |
407,744 |
452,944 |
413,037 |
| United States of America |
319,520 |
340,864 |
369,493 |
| United Kingdom |
246,032 |
233,440 |
233,732 |
| Germany |
104,128 |
101,456 |
100,876 |
| Japan |
101,664 |
101,424 |
97,810 |
| Korea, Republic of |
85,520 |
91,824 |
86,608 |
| Canada |
65,376 |
69,312 |
73,804 |
| India |
57,776 |
68,512 |
65,018 |
| Singapore |
57,520 |
60,848 |
63,764 |
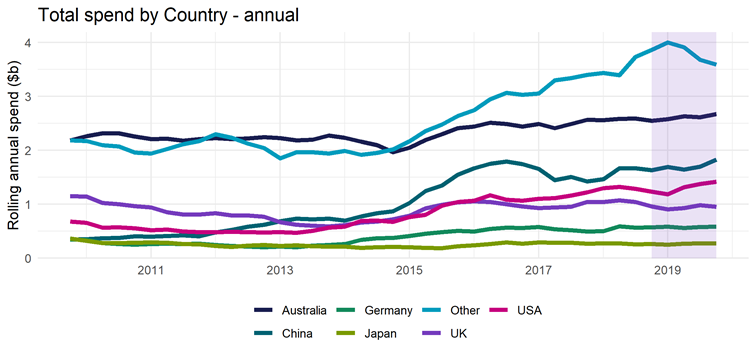
Strong growth in tourism spend for North American visitors
New Zealand experienced strong growth in expenditure for visitors from the United States, with total visitor expenditure up 15 per cent on last year (to $1.42 billion). Canada also showed strong growth in visitor spend, up 21 per cent (to $309 million), although this result was not statistically significant.
Source: International Visitor Survey, MBIE
Total spend by country - annual - data table
| Date |
Annual spend (billions) |
Country |
| 1/10/2009 |
2.185815325 |
Australia |
| 1/01/2010 |
2.263209206 |
Australia |
| 2/04/2010 |
2.312693728 |
Australia |
| 2/07/2010 |
2.315331447 |
Australia |
| 1/10/2010 |
2.254525468 |
Australia |
| 1/01/2011 |
2.210313592 |
Australia |
| 2/04/2011 |
2.215862611 |
Australia |
| 2/07/2011 |
2.177924942 |
Australia |
| 1/10/2011 |
2.205131479 |
Australia |
| 1/01/2012 |
2.224531053 |
Australia |
| 1/04/2012 |
2.209283413 |
Australia |
| 2/07/2012 |
2.222038498 |
Australia |
| 1/10/2012 |
2.245122314 |
Australia |
| 1/01/2013 |
2.223735026 |
Australia |
| 2/04/2013 |
2.18418794 |
Australia |
| 2/07/2013 |
2.194808557 |
Australia |
| 1/10/2013 |
2.270730512 |
Australia |
| 1/01/2014 |
2.231689104 |
Australia |
| 2/04/2014 |
2.160074157 |
Australia |
| 2/07/2014 |
2.096323131 |
Australia |
| 1/10/2014 |
1.965766473 |
Australia |
| 1/01/2015 |
2.044170003 |
Australia |
| 2/04/2015 |
2.191016165 |
Australia |
| 2/07/2015 |
2.294773447 |
Australia |
| 1/10/2015 |
2.411333314 |
Australia |
| 1/01/2016 |
2.439594974 |
Australia |
| 1/04/2016 |
2.512924327 |
Australia |
| 2/07/2016 |
2.485785881 |
Australia |
| 1/10/2016 |
2.441307576 |
Australia |
| 1/01/2017 |
2.487486722 |
Australia |
| 2/04/2017 |
2.412503692 |
Australia |
| 2/07/2017 |
2.487876616 |
Australia |
| 1/10/2017 |
2.562455166 |
Australia |
| 1/01/2018 |
2.55720579 |
Australia |
| 2/04/2018 |
2.585384925 |
Australia |
| 2/07/2018 |
2.589891863 |
Australia |
| 1/10/2018 |
2.548112304 |
Australia |
| 1/01/2019 |
2.577584692 |
Australia |
| 2/04/2019 |
2.633402758 |
Australia |
| 2/07/2019 |
2.613855351 |
Australia |
| 1/10/2019 |
2.670723494 |
Australia |
| 1/10/2009 |
0.342277236 |
China |
| 1/01/2010 |
0.351549815 |
China |
| 2/04/2010 |
0.365209423 |
China |
| 2/07/2010 |
0.371179899 |
China |
| 1/10/2010 |
0.40524293 |
China |
| 1/01/2011 |
0.397379495 |
China |
| 2/04/2011 |
0.410727104 |
China |
| 2/07/2011 |
0.421720741 |
China |
| 1/10/2011 |
0.4053532 |
China |
| 1/01/2012 |
0.475143448 |
China |
| 1/04/2012 |
0.519716675 |
China |
| 2/07/2012 |
0.579298752 |
China |
| 1/10/2012 |
0.620500905 |
China |
| 1/01/2013 |
0.685768139 |
China |
| 2/04/2013 |
0.730443638 |
China |
| 2/07/2013 |
0.721482954 |
China |
| 1/10/2013 |
0.732310521 |
China |
| 1/01/2014 |
0.693577916 |
China |
| 2/04/2014 |
0.770756393 |
China |
| 2/07/2014 |
0.833546528 |
China |
| 1/10/2014 |
0.869532618 |
China |
| 1/01/2015 |
1.025321636 |
China |
| 2/04/2015 |
1.242700266 |
China |
| 2/07/2015 |
1.344060132 |
China |
| 1/10/2015 |
1.5487639 |
China |
| 1/01/2016 |
1.667717166 |
China |
| 1/04/2016 |
1.749026355 |
China |
| 2/07/2016 |
1.790807531 |
China |
| 1/10/2016 |
1.740484751 |
China |
| 1/01/2017 |
1.653203637 |
China |
| 2/04/2017 |
1.447741741 |
China |
| 2/07/2017 |
1.50346521 |
China |
| 1/10/2017 |
1.42453718 |
China |
| 1/01/2018 |
1.464194256 |
China |
| 2/04/2018 |
1.663129266 |
China |
| 2/07/2018 |
1.663485802 |
China |
| 1/10/2018 |
1.630362245 |
China |
| 1/01/2019 |
1.68709765 |
China |
| 2/04/2019 |
1.641729065 |
China |
| 2/07/2019 |
1.693614828 |
China |
| 1/10/2019 |
1.828689773 |
China |
| 1/10/2009 |
0.343307647 |
Germany |
| 1/01/2010 |
0.336478183 |
Germany |
| 2/04/2010 |
0.279217511 |
Germany |
| 2/07/2010 |
0.258743925 |
Germany |
| 1/10/2010 |
0.248334486 |
Germany |
| 1/01/2011 |
0.262807827 |
Germany |
| 2/04/2011 |
0.263262474 |
Germany |
| 2/07/2011 |
0.26311778 |
Germany |
| 1/10/2011 |
0.266280262 |
Germany |
| 1/01/2012 |
0.24274948 |
Germany |
| 1/04/2012 |
0.223774883 |
Germany |
| 2/07/2012 |
0.215320659 |
Germany |
| 1/10/2012 |
0.203374252 |
Germany |
| 1/01/2013 |
0.215270983 |
Germany |
| 2/04/2013 |
0.200539441 |
Germany |
| 2/07/2013 |
0.229327562 |
Germany |
| 1/10/2013 |
0.243642102 |
Germany |
| 1/01/2014 |
0.258883798 |
Germany |
| 2/04/2014 |
0.336639351 |
Germany |
| 2/07/2014 |
0.364491851 |
Germany |
| 1/10/2014 |
0.374662815 |
Germany |
| 1/01/2015 |
0.407919299 |
Germany |
| 2/04/2015 |
0.453129774 |
Germany |
| 2/07/2015 |
0.481962684 |
Germany |
| 1/10/2015 |
0.504599516 |
Germany |
| 1/01/2016 |
0.492069352 |
Germany |
| 1/04/2016 |
0.537302656 |
Germany |
| 2/07/2016 |
0.565340241 |
Germany |
| 1/10/2016 |
0.557471863 |
Germany |
| 1/01/2017 |
0.575656338 |
Germany |
| 2/04/2017 |
0.531823488 |
Germany |
| 2/07/2017 |
0.51780477 |
Germany |
| 1/10/2017 |
0.49521449 |
Germany |
| 1/01/2018 |
0.500481485 |
Germany |
| 2/04/2018 |
0.587563974 |
Germany |
| 2/07/2018 |
0.56258292 |
Germany |
| 1/10/2018 |
0.572210642 |
Germany |
| 1/01/2019 |
0.580834541 |
Germany |
| 2/04/2019 |
0.56012936 |
Germany |
| 2/07/2019 |
0.575481135 |
Germany |
| 1/10/2019 |
0.583814533 |
Germany |
| 1/10/2009 |
0.359603123 |
Japan |
| 1/01/2010 |
0.322275132 |
Japan |
| 2/04/2010 |
0.278462383 |
Japan |
| 2/07/2010 |
0.279925808 |
Japan |
| 1/10/2010 |
0.284783667 |
Japan |
| 1/01/2011 |
0.288811845 |
Japan |
| 2/04/2011 |
0.28335272 |
Japan |
| 2/07/2011 |
0.259683205 |
Japan |
| 1/10/2011 |
0.254049508 |
Japan |
| 1/01/2012 |
0.221995507 |
Japan |
| 1/04/2012 |
0.206981174 |
Japan |
| 2/07/2012 |
0.231626439 |
Japan |
| 1/10/2012 |
0.240778795 |
Japan |
| 1/01/2013 |
0.226713771 |
Japan |
| 2/04/2013 |
0.236159301 |
Japan |
| 2/07/2013 |
0.217988353 |
Japan |
| 1/10/2013 |
0.209552114 |
Japan |
| 1/01/2014 |
0.214154879 |
Japan |
| 2/04/2014 |
0.188252067 |
Japan |
| 2/07/2014 |
0.201856539 |
Japan |
| 1/10/2014 |
0.205542979 |
Japan |
| 1/01/2015 |
0.199351973 |
Japan |
| 2/04/2015 |
0.191220838 |
Japan |
| 2/07/2015 |
0.183168153 |
Japan |
| 1/10/2015 |
0.216163008 |
Japan |
| 1/01/2016 |
0.233848452 |
Japan |
| 1/04/2016 |
0.258802888 |
Japan |
| 2/07/2016 |
0.287010267 |
Japan |
| 1/10/2016 |
0.266345769 |
Japan |
| 1/01/2017 |
0.287449094 |
Japan |
| 2/04/2017 |
0.2846918 |
Japan |
| 2/07/2017 |
0.286290733 |
Japan |
| 1/10/2017 |
0.268488244 |
Japan |
| 1/01/2018 |
0.271011525 |
Japan |
| 2/04/2018 |
0.274650971 |
Japan |
| 2/07/2018 |
0.252748831 |
Japan |
| 1/10/2018 |
0.263060188 |
Japan |
| 1/01/2019 |
0.246643997 |
Japan |
| 2/04/2019 |
0.266996449 |
Japan |
| 2/07/2019 |
0.273222737 |
Japan |
| 1/10/2019 |
0.271325859 |
Japan |
| 1/10/2009 |
2.18114941 |
Other |
| 1/01/2010 |
2.172042016 |
Other |
| 2/04/2010 |
2.092027679 |
Other |
| 2/07/2010 |
2.06939309 |
Other |
| 1/10/2010 |
1.95673691 |
Other |
| 1/01/2011 |
1.939887751 |
Other |
| 2/04/2011 |
2.022019247 |
Other |
| 2/07/2011 |
2.110339168 |
Other |
| 1/10/2011 |
2.173347176 |
Other |
| 1/01/2012 |
2.299541963 |
Other |
| 1/04/2012 |
2.232807205 |
Other |
| 2/07/2012 |
2.126671467 |
Other |
| 1/10/2012 |
2.041559667 |
Other |
| 1/01/2013 |
1.850253834 |
Other |
| 2/04/2013 |
1.961976131 |
Other |
| 2/07/2013 |
1.962196131 |
Other |
| 1/10/2013 |
1.938764668 |
Other |
| 1/01/2014 |
1.98700565 |
Other |
| 2/04/2014 |
1.914708775 |
Other |
| 2/07/2014 |
1.951252524 |
Other |
| 1/10/2014 |
2.015059911 |
Other |
| 1/01/2015 |
2.164787236 |
Other |
| 2/04/2015 |
2.356537126 |
Other |
| 2/07/2015 |
2.474130551 |
Other |
| 1/10/2015 |
2.635403158 |
Other |
| 1/01/2016 |
2.74441238 |
Other |
| 1/04/2016 |
2.945773083 |
Other |
| 2/07/2016 |
3.06847497 |
Other |
| 1/10/2016 |
3.031345458 |
Other |
| 1/01/2017 |
3.052971475 |
Other |
| 2/04/2017 |
3.298340729 |
Other |
| 2/07/2017 |
3.342297557 |
Other |
| 1/10/2017 |
3.400395303 |
Other |
| 1/01/2018 |
3.436558277 |
Other |
| 2/04/2018 |
3.390304186 |
Other |
| 2/07/2018 |
3.73347228 |
Other |
| 1/10/2018 |
3.864388332 |
Other |
| 1/01/2019 |
3.999555132 |
Other |
| 2/04/2019 |
3.911479635 |
Other |
| 2/07/2019 |
3.680436785 |
Other |
| 1/10/2019 |
3.587866799 |
Other |
| 1/10/2009 |
1.149442107 |
UK |
| 1/01/2010 |
1.142780669 |
UK |
| 2/04/2010 |
1.021942617 |
UK |
| 2/07/2010 |
0.999991728 |
UK |
| 1/10/2010 |
0.962498342 |
UK |
| 1/01/2011 |
0.93904834 |
UK |
| 2/04/2011 |
0.852001964 |
UK |
| 2/07/2011 |
0.807298859 |
UK |
| 1/10/2011 |
0.807431244 |
UK |
| 1/01/2012 |
0.834408756 |
UK |
| 1/04/2012 |
0.789537889 |
UK |
| 2/07/2012 |
0.789519215 |
UK |
| 1/10/2012 |
0.765692399 |
UK |
| 1/01/2013 |
0.662751217 |
UK |
| 2/04/2013 |
0.614992037 |
UK |
| 2/07/2013 |
0.600536444 |
UK |
| 1/10/2013 |
0.586750274 |
UK |
| 1/01/2014 |
0.611881891 |
UK |
| 2/04/2014 |
0.661031994 |
UK |
| 2/07/2014 |
0.677707096 |
UK |
| 1/10/2014 |
0.72005452 |
UK |
| 1/01/2015 |
0.78412925 |
UK |
| 2/04/2015 |
0.919509806 |
UK |
| 2/07/2015 |
0.989051513 |
UK |
| 1/10/2015 |
1.032910826 |
UK |
| 1/01/2016 |
1.0548986 |
UK |
| 1/04/2016 |
1.038723643 |
UK |
| 2/07/2016 |
0.997734902 |
UK |
| 1/10/2016 |
0.957783023 |
UK |
| 1/01/2017 |
0.927921439 |
UK |
| 2/04/2017 |
0.938341528 |
UK |
| 2/07/2017 |
0.949849552 |
UK |
| 1/10/2017 |
1.04211205 |
UK |
| 1/01/2018 |
1.039359945 |
UK |
| 2/04/2018 |
1.070008966 |
UK |
| 2/07/2018 |
1.040422057 |
UK |
| 1/10/2018 |
0.954426311 |
UK |
| 1/01/2019 |
0.905508867 |
UK |
| 2/04/2019 |
0.92553833 |
UK |
| 2/07/2019 |
0.9786369 |
UK |
| 1/10/2019 |
0.952534895 |
UK |
| 1/10/2009 |
0.677742932 |
USA |
| 1/01/2010 |
0.654069676 |
USA |
| 2/04/2010 |
0.566593823 |
USA |
| 2/07/2010 |
0.572163691 |
USA |
| 1/10/2010 |
0.55046888 |
USA |
| 1/01/2011 |
0.517833326 |
USA |
| 2/04/2011 |
0.526123208 |
USA |
| 2/07/2011 |
0.495145694 |
USA |
| 1/10/2011 |
0.480285311 |
USA |
| 1/01/2012 |
0.481958763 |
USA |
| 1/04/2012 |
0.487664026 |
USA |
| 2/07/2012 |
0.481348502 |
USA |
| 1/10/2012 |
0.473506901 |
USA |
| 1/01/2013 |
0.477643192 |
USA |
| 2/04/2013 |
0.470044928 |
USA |
| 2/07/2013 |
0.504787995 |
USA |
| 1/10/2013 |
0.562223135 |
USA |
| 1/01/2014 |
0.582368935 |
USA |
| 2/04/2014 |
0.688540828 |
USA |
| 2/07/2014 |
0.697575349 |
USA |
| 1/10/2014 |
0.673614068 |
USA |
| 1/01/2015 |
0.762492223 |
USA |
| 2/04/2015 |
0.800654483 |
USA |
| 2/07/2015 |
0.966577848 |
USA |
| 1/10/2015 |
1.043139264 |
USA |
| 1/01/2016 |
1.06500314 |
USA |
| 1/04/2016 |
1.167300799 |
USA |
| 2/07/2016 |
1.080351131 |
USA |
| 1/10/2016 |
1.063525168 |
USA |
| 1/01/2017 |
1.101127783 |
USA |
| 2/04/2017 |
1.110419273 |
USA |
| 2/07/2017 |
1.162005378 |
USA |
| 1/10/2017 |
1.217107841 |
USA |
| 1/01/2018 |
1.294202797 |
USA |
| 2/04/2018 |
1.319420103 |
USA |
| 2/07/2018 |
1.285985498 |
USA |
| 1/10/2018 |
1.229957174 |
USA |
| 1/01/2019 |
1.184052891 |
USA |
| 2/04/2019 |
1.313308386 |
USA |
| 2/07/2019 |
1.375067318 |
USA |
| 1/10/2019 |
1.414635888 |
USA |
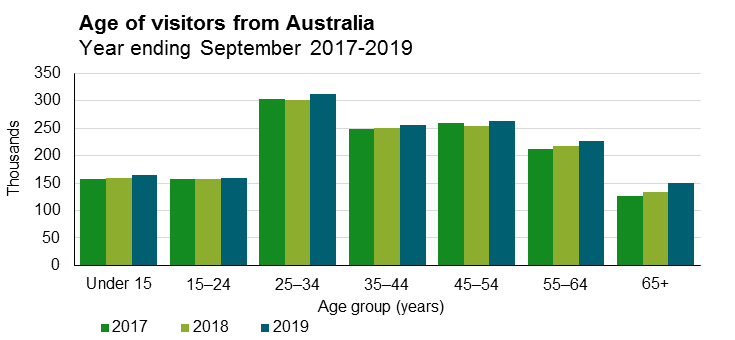
Over 1.53 million Australian residents visited New Zealand in the year ending September 2019, up 3.8 per cent on last year. Annual visitor arrivals from Australia increased across all age groups compared with the September 2018 year. The largest increases were in the 65+, 25–34, and 55–64 year age groups. This represents an increase of more than 9,000 visitor arrivals from each age group.
Source: International Travel, StatsNZ
Age of visitors from Australia - data table
| Year ended September |
| Age group (years) |
2017 |
2018 |
2019 |
| Under 15 |
156,544 |
158,992 |
164,117 |
| 15–24 |
157,648 |
157,968 |
159,294 |
| 25–34 |
302,912 |
302,160 |
311,764 |
| 35–44 |
249,408 |
249,584 |
256,157 |
| 45–54 |
260,256 |
254,528 |
262,296 |
| 55–64 |
212,800 |
217,264 |
226,670 |
| 65+ |
127,056 |
133,968 |
149,899 |
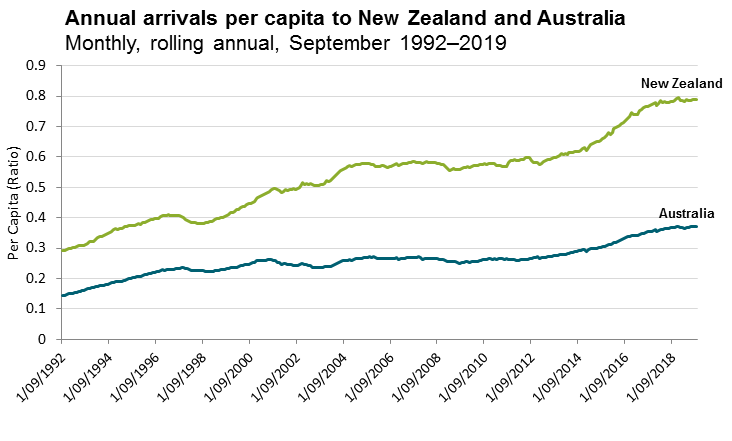
Comparison of visitor arrivals to New Zealand with visitor arrivals to Australia
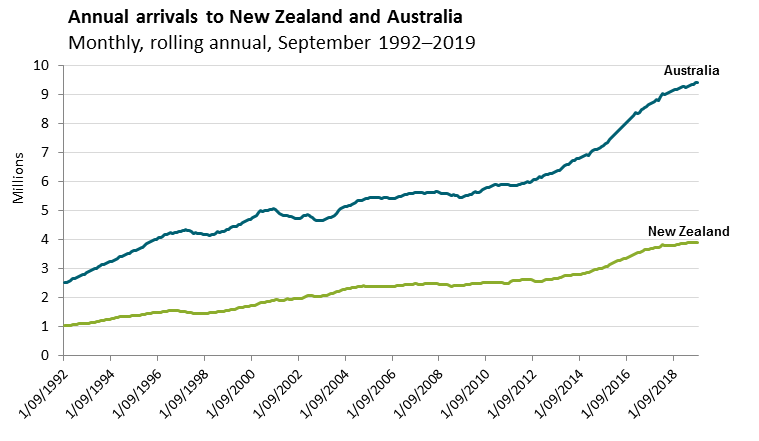
In absolute terms, Australia sees twice as many visitors as New Zealand. However, on a per capita basis, New Zealand welcomes far more visitors, and has supported a slightly higher rate of growth over time.
Source: Australian Bureau of Statistics & International Travel, StatsNZ
Source: Australian Bureau of Statistics & International Travel, StatsNZ
Over the 27 year period from the year ending September 1992 to 2019, annual visitor arrivals more than tripled in both New Zealand and Australia. The percentage increase was similar between both countries, with New Zealand recording 3.77 times as many visitor arrivals in 2019 than in 1992, while for Australia the comparable figure was 3.73. New Zealand used to be Australia's main source of visitor arrivals, up until late 2017, when arrivals to Australia from New Zealand were surpassed by the Chinese market.
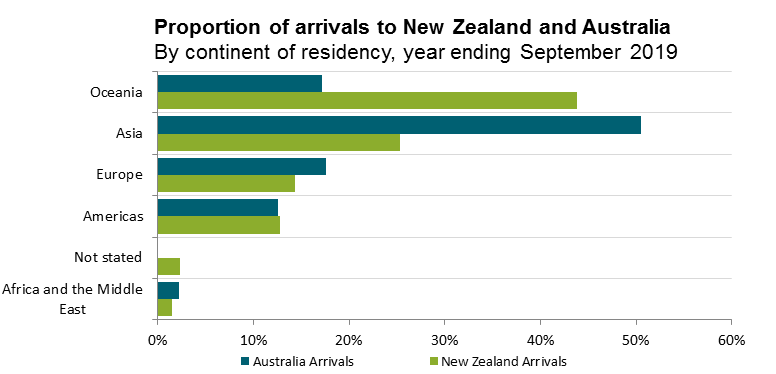
Countries in Asia contributed 50.5 per cent of all visitors to Australia in the September 2019 year, but only 25.4 per cent of visitors to New Zealand.
Source: Australian Bureau of Statistics & International Travel, StatsNZ
Proportion of arrivals to New Zealand and Australia - data table
| |
New Zealand Arrivals |
Australia Arrivals |
| Oceania |
43.8% |
17.2% |
| Asia |
25.4% |
50.5% |
| Europe |
14.3% |
17.6% |
| Americas |
12.8% |
12.5% |
| Africa and the Middle East |
1.4% |
2.3% |
| Not stated |
2.3% |
0.0% |
Visitors from Europe accounted for 14.3 per cent of arrivals to New Zealand in the year ended September 2019, compared with 17.6 per cent of arrivals to Australia. The comparable figures for visitors from the Americas were 12.8 per cent and 12.3 per cent, respectively.
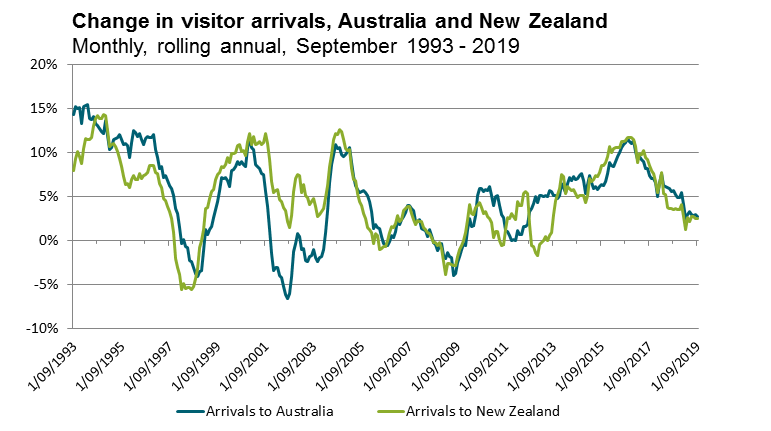
Changes in monthly arrival statistics are strongly related for arrivals into New Zealand and Australia from September 1993-2019. Since 2016, growth in arrivals has eased for both countries, slowing to around two and a half percent in the year to September 2019.
Source: Australian Bureau of Statistics & International Travel, StatsNZ
Change in visitor arrivals, Australia and New Zealand - data table
| |
Arrivals to Australia |
Arrivals to New Zealand |
| 1/09/1993 |
14.4% |
8.0% |
| 1/10/1993 |
15.3% |
9.3% |
| 1/11/1993 |
15.1% |
10.2% |
| 1/12/1993 |
15.1% |
9.6% |
| 1/01/1994 |
13.4% |
8.8% |
| 1/02/1994 |
15.3% |
10.5% |
| 1/03/1994 |
15.4% |
11.7% |
| 1/04/1994 |
15.5% |
11.6% |
| 1/05/1994 |
13.9% |
11.5% |
| 1/06/1994 |
13.8% |
11.8% |
| 1/07/1994 |
14.1% |
13.1% |
| 1/08/1994 |
13.3% |
13.9% |
| 1/09/1994 |
13.0% |
14.3% |
| 1/10/1994 |
12.8% |
14.0% |
| 1/11/1994 |
12.4% |
13.9% |
| 1/12/1994 |
12.2% |
14.3% |
| 1/01/1995 |
13.7% |
14.2% |
| 1/02/1995 |
12.0% |
12.5% |
| 1/03/1995 |
10.4% |
10.7% |
| 1/04/1995 |
10.6% |
11.0% |
| 1/05/1995 |
11.5% |
11.0% |
| 1/06/1995 |
11.6% |
10.7% |
| 1/07/1995 |
11.7% |
10.2% |
| 1/08/1995 |
12.1% |
9.3% |
| 1/09/1995 |
11.5% |
8.4% |
| 1/10/1995 |
10.9% |
7.3% |
| 1/11/1995 |
11.0% |
6.4% |
| 1/12/1995 |
10.8% |
6.5% |
| 1/01/1996 |
9.5% |
6.0% |
| 1/02/1996 |
11.2% |
7.0% |
| 1/03/1996 |
12.5% |
7.4% |
| 1/04/1996 |
12.3% |
7.0% |
| 1/05/1996 |
11.9% |
6.9% |
| 1/06/1996 |
12.2% |
7.6% |
| 1/07/1996 |
11.5% |
7.1% |
| 1/08/1996 |
11.0% |
7.4% |
| 1/09/1996 |
11.6% |
7.6% |
| 1/10/1996 |
11.9% |
7.7% |
| 1/11/1996 |
11.8% |
8.5% |
| 1/12/1996 |
11.8% |
8.5% |
| 1/01/1997 |
12.1% |
8.6% |
| 1/02/1997 |
10.3% |
7.7% |
| 1/03/1997 |
9.5% |
7.6% |
| 1/04/1997 |
8.2% |
6.4% |
| 1/05/1997 |
8.4% |
6.1% |
| 1/06/1997 |
7.2% |
4.8% |
| 1/07/1997 |
7.4% |
4.6% |
| 1/08/1997 |
6.8% |
3.9% |
| 1/09/1997 |
6.3% |
3.3% |
| 1/10/1997 |
5.9% |
2.5% |
| 1/11/1997 |
5.2% |
1.0% |
| 1/12/1997 |
3.7% |
-2.1% |
| 1/01/1998 |
3.1% |
-3.0% |
| 1/02/1998 |
1.5% |
-3.9% |
| 1/03/1998 |
-0.4% |
-5.6% |
| 1/04/1998 |
0.1% |
-4.9% |
| 1/05/1998 |
-0.6% |
-5.4% |
| 1/06/1998 |
-0.8% |
-5.4% |
| 1/07/1998 |
-2.3% |
-5.4% |
| 1/08/1998 |
-2.4% |
-5.6% |
| 1/09/1998 |
-3.1% |
-5.2% |
| 1/10/1998 |
-3.7% |
-4.4% |
| 1/11/1998 |
-4.1% |
-3.2% |
| 1/12/1998 |
-3.5% |
-0.8% |
| 1/01/1999 |
-3.5% |
0.0% |
| 1/02/1999 |
-1.2% |
1.3% |
| 1/03/1999 |
1.3% |
3.6% |
| 1/04/1999 |
0.7% |
3.8% |
| 1/05/1999 |
1.2% |
4.8% |
| 1/06/1999 |
1.6% |
5.5% |
| 1/07/1999 |
2.6% |
5.9% |
| 1/08/1999 |
3.5% |
7.0% |
| 1/09/1999 |
4.4% |
7.5% |
| 1/10/1999 |
5.7% |
7.8% |
| 1/11/1999 |
7.2% |
8.4% |
| 1/12/1999 |
7.0% |
8.3% |
| 1/01/2000 |
7.1% |
8.6% |
| 1/02/2000 |
6.8% |
9.4% |
| 1/03/2000 |
6.1% |
8.9% |
| 1/04/2000 |
8.0% |
9.9% |
| 1/05/2000 |
8.1% |
9.9% |
| 1/06/2000 |
8.5% |
10.0% |
| 1/07/2000 |
9.0% |
10.9% |
| 1/08/2000 |
8.6% |
11.0% |
| 1/09/2000 |
9.0% |
10.1% |
| 1/10/2000 |
8.7% |
10.2% |
| 1/11/2000 |
8.4% |
9.6% |
| 1/12/2000 |
10.6% |
11.3% |
| 1/01/2001 |
11.6% |
12.2% |
| 1/02/2001 |
10.6% |
11.0% |
| 1/03/2001 |
10.4% |
11.9% |
| 1/04/2001 |
8.7% |
11.0% |
| 1/05/2001 |
8.4% |
11.1% |
| 1/06/2001 |
8.2% |
11.3% |
| 1/07/2001 |
7.6% |
10.9% |
| 1/08/2001 |
7.5% |
11.2% |
| 1/09/2001 |
5.6% |
12.2% |
| 1/10/2001 |
3.9% |
11.1% |
| 1/11/2001 |
1.2% |
9.2% |
| 1/12/2001 |
-1.5% |
6.7% |
| 1/01/2002 |
-3.4% |
5.5% |
| 1/02/2002 |
-3.1% |
5.7% |
| 1/03/2002 |
-3.1% |
5.8% |
| 1/04/2002 |
-4.0% |
4.7% |
| 1/05/2002 |
-4.2% |
4.4% |
| 1/06/2002 |
-5.2% |
3.8% |
| 1/07/2002 |
-6.1% |
3.4% |
| 1/08/2002 |
-6.6% |
2.2% |
| 1/09/2002 |
-6.1% |
1.5% |
| 1/10/2002 |
-4.2% |
2.8% |
| 1/11/2002 |
-1.3% |
5.5% |
| 1/12/2002 |
-0.3% |
7.1% |
| 1/01/2003 |
0.8% |
7.5% |
| 1/02/2003 |
0.5% |
7.4% |
| 1/03/2003 |
-1.0% |
5.5% |
| 1/04/2003 |
-0.9% |
6.3% |
| 1/05/2003 |
-2.3% |
5.2% |
| 1/06/2003 |
-2.4% |
4.8% |
| 1/07/2003 |
-1.8% |
4.1% |
| 1/08/2003 |
-1.8% |
4.4% |
| 1/09/2003 |
-1.0% |
4.8% |
| 1/10/2003 |
-1.9% |
3.9% |
| 1/11/2003 |
-2.4% |
2.8% |
| 1/12/2003 |
-2.0% |
3.0% |
| 1/01/2004 |
-1.8% |
3.3% |
| 1/02/2004 |
-1.1% |
3.6% |
| 1/03/2004 |
0.9% |
4.9% |
| 1/04/2004 |
3.4% |
6.2% |
| 1/05/2004 |
6.6% |
8.5% |
| 1/06/2004 |
8.6% |
9.7% |
| 1/07/2004 |
9.8% |
11.5% |
| 1/08/2004 |
10.9% |
12.2% |
| 1/09/2004 |
10.4% |
12.1% |
| 1/10/2004 |
10.5% |
12.7% |
| 1/11/2004 |
9.8% |
12.4% |
| 1/12/2004 |
9.6% |
11.5% |
| 1/01/2005 |
9.8% |
10.5% |
| 1/02/2005 |
10.1% |
10.2% |
| 1/03/2005 |
10.6% |
10.4% |
| 1/04/2005 |
8.9% |
8.2% |
| 1/05/2005 |
7.3% |
6.9% |
| 1/06/2005 |
6.3% |
6.8% |
| 1/07/2005 |
5.8% |
5.3% |
| 1/08/2005 |
5.4% |
4.5% |
| 1/09/2005 |
5.6% |
4.0% |
| 1/10/2005 |
5.7% |
3.1% |
| 1/11/2005 |
5.4% |
2.4% |
| 1/12/2005 |
5.1% |
1.5% |
| 1/01/2006 |
4.4% |
1.3% |
| 1/02/2006 |
3.3% |
0.9% |
| 1/03/2006 |
1.4% |
-0.4% |
| 1/04/2006 |
1.9% |
0.7% |
| 1/05/2006 |
1.5% |
0.6% |
| 1/06/2006 |
1.4% |
-1.1% |
| 1/07/2006 |
0.5% |
-0.9% |
| 1/08/2006 |
-0.4% |
-0.7% |
| 1/09/2006 |
-0.5% |
-0.7% |
| 1/10/2006 |
-0.6% |
0.0% |
| 1/11/2006 |
-0.1% |
0.9% |
| 1/12/2006 |
0.6% |
1.6% |
| 1/01/2007 |
0.3% |
1.4% |
| 1/02/2007 |
1.0% |
2.0% |
| 1/03/2007 |
2.4% |
2.8% |
| 1/04/2007 |
1.9% |
2.1% |
| 1/05/2007 |
2.4% |
2.4% |
| 1/06/2007 |
2.7% |
3.4% |
| 1/07/2007 |
3.1% |
3.7% |
| 1/08/2007 |
4.0% |
3.9% |
| 1/09/2007 |
3.9% |
3.8% |
| 1/10/2007 |
3.6% |
3.1% |
| 1/11/2007 |
3.4% |
2.4% |
| 1/12/2007 |
2.2% |
1.8% |
| 1/01/2008 |
2.2% |
2.3% |
| 1/02/2008 |
2.4% |
2.2% |
| 1/03/2008 |
1.4% |
2.1% |
| 1/04/2008 |
1.2% |
1.5% |
| 1/05/2008 |
1.1% |
1.3% |
| 1/06/2008 |
0.5% |
0.9% |
| 1/07/2008 |
1.3% |
0.8% |
| 1/08/2008 |
0.5% |
0.3% |
| 1/09/2008 |
-0.3% |
-0.3% |
| 1/10/2008 |
-0.4% |
-0.2% |
| 1/11/2008 |
-1.1% |
-0.6% |
| 1/12/2008 |
-0.7% |
-0.3% |
| 1/01/2009 |
-0.3% |
-0.9% |
| 1/02/2009 |
-1.7% |
-2.4% |
| 1/03/2009 |
-2.1% |
-3.9% |
| 1/04/2009 |
-1.4% |
-2.7% |
| 1/05/2009 |
-1.8% |
-2.6% |
| 1/06/2009 |
-1.9% |
-2.8% |
| 1/07/2009 |
-4.0% |
-2.8% |
| 1/08/2009 |
-3.8% |
-2.8% |
| 1/09/2009 |
-2.6% |
-1.8% |
| 1/10/2009 |
-1.8% |
-1.0% |
| 1/11/2009 |
-1.0% |
-0.6% |
| 1/12/2009 |
-0.3% |
0.0% |
| 1/01/2010 |
-0.6% |
0.9% |
| 1/02/2010 |
1.3% |
2.4% |
| 1/03/2010 |
2.5% |
4.1% |
| 1/04/2010 |
1.5% |
3.1% |
| 1/05/2010 |
1.7% |
3.0% |
| 1/06/2010 |
2.8% |
3.7% |
| 1/07/2010 |
5.1% |
4.0% |
| 1/08/2010 |
5.9% |
4.3% |
| 1/09/2010 |
5.9% |
3.8% |
| 1/10/2010 |
5.5% |
3.1% |
| 1/11/2010 |
5.8% |
3.3% |
| 1/12/2010 |
5.7% |
2.7% |
| 1/01/2011 |
6.2% |
2.5% |
| 1/02/2011 |
5.2% |
2.1% |
| 1/03/2011 |
4.0% |
0.3% |
| 1/04/2011 |
5.0% |
1.0% |
| 1/05/2011 |
5.1% |
1.0% |
| 1/06/2011 |
4.0% |
0.0% |
| 1/07/2011 |
3.0% |
-0.5% |
| 1/08/2011 |
2.6% |
-0.5% |
| 1/09/2011 |
1.1% |
1.2% |
| 1/10/2011 |
1.1% |
2.6% |
| 1/11/2011 |
0.6% |
2.5% |
| 1/12/2011 |
0.0% |
3.0% |
| 1/01/2012 |
0.1% |
2.7% |
| 1/02/2012 |
0.0% |
2.3% |
| 1/03/2012 |
1.2% |
4.4% |
| 1/04/2012 |
0.7% |
3.9% |
| 1/05/2012 |
0.7% |
4.0% |
| 1/06/2012 |
1.5% |
5.4% |
| 1/07/2012 |
1.5% |
5.6% |
| 1/08/2012 |
1.8% |
5.3% |
| 1/09/2012 |
3.3% |
1.8% |
| 1/10/2012 |
3.6% |
-0.6% |
| 1/11/2012 |
4.2% |
-0.7% |
| 1/12/2012 |
5.0% |
-1.4% |
| 1/01/2013 |
4.3% |
-1.7% |
| 1/02/2013 |
5.2% |
-0.5% |
| 1/03/2013 |
5.1% |
-0.3% |
| 1/04/2013 |
5.0% |
0.0% |
| 1/05/2013 |
5.2% |
0.5% |
| 1/06/2013 |
5.0% |
0.0% |
| 1/07/2013 |
5.7% |
0.5% |
| 1/08/2013 |
5.6% |
0.9% |
| 1/09/2013 |
5.1% |
2.9% |
| 1/10/2013 |
5.1% |
4.6% |
| 1/11/2013 |
4.8% |
5.3% |
| 1/12/2013 |
5.1% |
6.0% |
| 1/01/2014 |
6.5% |
7.5% |
| 1/02/2014 |
6.0% |
7.3% |
| 1/03/2014 |
5.4% |
5.4% |
| 1/04/2014 |
6.5% |
6.1% |
| 1/05/2014 |
7.2% |
5.9% |
| 1/06/2014 |
6.9% |
5.7% |
| 1/07/2014 |
7.3% |
5.8% |
| 1/08/2014 |
6.9% |
5.3% |
| 1/09/2014 |
7.1% |
4.9% |
| 1/10/2014 |
7.4% |
5.1% |
| 1/11/2014 |
7.6% |
5.1% |
| 1/12/2014 |
6.8% |
5.1% |
| 1/01/2015 |
5.4% |
4.3% |
| 1/02/2015 |
6.4% |
5.1% |
| 1/03/2015 |
7.4% |
7.1% |
| 1/04/2015 |
6.6% |
6.7% |
| 1/05/2015 |
5.9% |
6.9% |
| 1/06/2015 |
6.2% |
7.4% |
| 1/07/2015 |
5.8% |
7.3% |
| 1/08/2015 |
6.1% |
7.8% |
| 1/09/2015 |
6.4% |
8.5% |
| 1/10/2015 |
6.3% |
8.6% |
| 1/11/2015 |
6.7% |
8.9% |
| 1/12/2015 |
7.6% |
9.6% |
| 1/01/2016 |
8.9% |
10.7% |
| 1/02/2016 |
8.5% |
10.1% |
| 1/03/2016 |
8.4% |
10.4% |
| 1/04/2016 |
9.0% |
10.6% |
| 1/05/2016 |
9.5% |
10.6% |
| 1/06/2016 |
10.0% |
10.6% |
| 1/07/2016 |
10.6% |
11.2% |
| 1/08/2016 |
10.9% |
11.3% |
| 1/09/2016 |
11.2% |
11.4% |
| 1/10/2016 |
11.6% |
11.7% |
| 1/11/2016 |
11.3% |
11.7% |
| 1/12/2016 |
11.0% |
11.8% |
| 1/01/2017 |
11.4% |
11.5% |
| 1/02/2017 |
10.2% |
10.7% |
| 1/03/2017 |
9.2% |
8.9% |
| 1/04/2017 |
9.5% |
9.9% |
| 1/05/2017 |
9.2% |
9.8% |
| 1/06/2017 |
9.0% |
10.2% |
| 1/07/2017 |
8.2% |
9.5% |
| 1/08/2017 |
8.3% |
9.3% |
| 1/09/2017 |
7.5% |
8.6% |
| 1/10/2017 |
7.1% |
7.9% |
| 1/11/2017 |
7.1% |
7.6% |
| 1/12/2017 |
6.6% |
6.7% |
| 1/01/2018 |
5.0% |
5.5% |
| 1/02/2018 |
6.7% |
6.5% |
| 1/03/2018 |
7.7% |
7.8% |
| 1/04/2018 |
6.3% |
5.4% |
| 1/05/2018 |
6.2% |
5.3% |
| 1/06/2018 |
6.0% |
3.8% |
| 1/07/2018 |
6.0% |
3.6% |
| 1/08/2018 |
5.5% |
3.6% |
| 1/09/2018 |
5.6% |
3.6% |
| 1/10/2018 |
5.2% |
3.6% |
| 1/11/2018 |
4.9% |
3.6% |
| 1/12/2018 |
4.9% |
3.5% |
| 1/01/2019 |
5.5% |
4.1% |
| 1/02/2019 |
4.1% |
2.7% |
| 1/03/2019 |
2.5% |
1.3% |
| 1/04/2019 |
3.0% |
2.6% |
| 1/05/2019 |
3.3% |
2.2% |
| 1/06/2019 |
3.0% |
2.7% |
| 1/07/2019 |
2.9% |
2.8% |
| 1/08/2019 |
2.9% |
2.5% |
| 1/09/2019 |
2.7% |
2.5% |
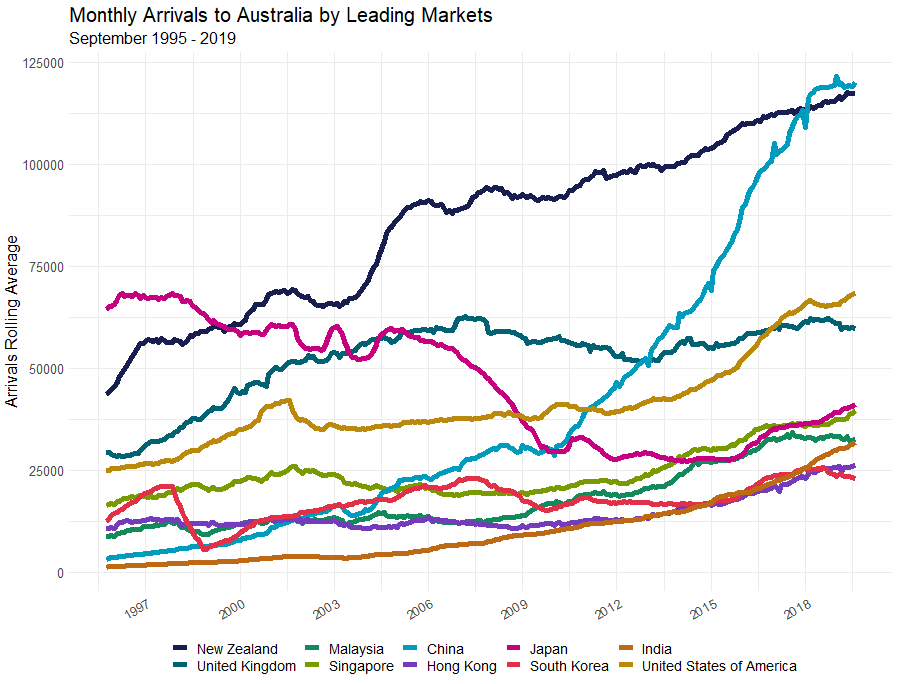
The leading ten arrival markets to New Zealand accounted for 77.7 per cent of arrivals, while in Australia the 10 leading markets accounted for 71.4 per cent of arrivals (for the year ending September 2019).
Source: Australian Bureau of Statistics
Monthly arrivals to Australia by leading markets - data table
| Date proper |
Rolling annual |
Variable |
| 1/09/1997 |
56527.08 |
New Zealand |
| 1/09/1998 |
57081.94 |
New Zealand |
| 1/09/1999 |
59632.64 |
New Zealand |
| 1/09/2000 |
62832.64 |
New Zealand |
| 1/09/2001 |
68231.94 |
New Zealand |
| 1/09/2002 |
66834.72 |
New Zealand |
| 1/09/2003 |
66153.47 |
New Zealand |
| 1/09/2004 |
74355.56 |
New Zealand |
| 1/09/2005 |
87837.5 |
New Zealand |
| 1/09/2006 |
90004.86 |
New Zealand |
| 1/09/2007 |
90271.53 |
New Zealand |
| 1/09/2008 |
93522.22 |
New Zealand |
| 1/09/2009 |
91893.06 |
New Zealand |
| 1/09/2010 |
92348.61 |
New Zealand |
| 1/09/2011 |
96756.25 |
New Zealand |
| 1/09/2012 |
97865.97 |
New Zealand |
| 1/09/2013 |
99457.64 |
New Zealand |
| 1/09/2014 |
101056.3 |
New Zealand |
| 1/09/2015 |
105181.9 |
New Zealand |
| 1/09/2016 |
109933.3 |
New Zealand |
| 1/09/2017 |
112399.3 |
New Zealand |
| 1/09/2018 |
113963.9 |
New Zealand |
| 1/09/1996 |
28792.36 |
United Kingdom |
| 1/09/1997 |
31537.5 |
United Kingdom |
| 1/09/1998 |
35837.5 |
United Kingdom |
| 1/09/1999 |
39988.19 |
United Kingdom |
| 1/09/2000 |
45204.17 |
United Kingdom |
| 1/09/2001 |
49455.56 |
United Kingdom |
| 1/09/2002 |
52072.92 |
United Kingdom |
| 1/09/2003 |
53480.56 |
United Kingdom |
| 1/09/2004 |
56618.75 |
United Kingdom |
| 1/09/2005 |
58136.11 |
United Kingdom |
| 1/09/2006 |
59453.47 |
United Kingdom |
| 1/09/2007 |
61785.42 |
United Kingdom |
| 1/09/2008 |
59365.28 |
United Kingdom |
| 1/09/2009 |
57072.22 |
United Kingdom |
| 1/09/2010 |
56796.53 |
United Kingdom |
| 1/09/2011 |
55326.39 |
United Kingdom |
| 1/09/2012 |
52813.89 |
United Kingdom |
| 1/09/2013 |
52536.81 |
United Kingdom |
| 1/09/2014 |
55921.53 |
United Kingdom |
| 1/09/2015 |
55572.22 |
United Kingdom |
| 1/09/2016 |
58018.06 |
United Kingdom |
| 1/09/2017 |
60015.97 |
United Kingdom |
| 1/09/2018 |
61448.61 |
United Kingdom |
| 1/09/1996 |
9661.806 |
Malaysia |
| 1/09/1997 |
11364.58 |
Malaysia |
| 1/09/1998 |
11124.31 |
Malaysia |
| 1/09/1999 |
10150 |
Malaysia |
| 1/09/2000 |
11967.36 |
Malaysia |
| 1/09/2001 |
12479.17 |
Malaysia |
| 1/09/2002 |
12629.86 |
Malaysia |
| 1/09/2003 |
12700 |
Malaysia |
| 1/09/2004 |
13690.28 |
Malaysia |
| 1/09/2005 |
13702.78 |
Malaysia |
| 1/09/2006 |
12982.64 |
Malaysia |
| 1/09/2007 |
12379.17 |
Malaysia |
| 1/09/2008 |
13061.11 |
Malaysia |
| 1/09/2009 |
14850 |
Malaysia |
| 1/09/2010 |
17118.75 |
Malaysia |
| 1/09/2011 |
19143.75 |
Malaysia |
| 1/09/2012 |
19089.58 |
Malaysia |
| 1/09/2013 |
20901.39 |
Malaysia |
| 1/09/2014 |
24872.22 |
Malaysia |
| 1/09/2015 |
27352.08 |
Malaysia |
| 1/09/2016 |
29395.83 |
Malaysia |
| 1/09/2017 |
32962.5 |
Malaysia |
| 1/09/2018 |
33000.69 |
Malaysia |
| 1/09/1996 |
17566.67 |
Singapore |
| 1/09/1997 |
18701.39 |
Singapore |
| 1/09/1998 |
20682.64 |
Singapore |
| 1/09/1999 |
20654.17 |
Singapore |
| 1/09/2000 |
22638.89 |
Singapore |
| 1/09/2001 |
24245.83 |
Singapore |
| 1/09/2002 |
24702.08 |
Singapore |
| 1/09/2003 |
22870.83 |
Singapore |
| 1/09/2004 |
20950 |
Singapore |
| 1/09/2005 |
20663.19 |
Singapore |
| 1/09/2006 |
20081.94 |
Singapore |
| 1/09/2007 |
19292.36 |
Singapore |
| 1/09/2008 |
19381.25 |
Singapore |
| 1/09/2009 |
19545.14 |
Singapore |
| 1/09/2010 |
20707.64 |
Singapore |
| 1/09/2011 |
22244.44 |
Singapore |
| 1/09/2012 |
22209.03 |
Singapore |
| 1/09/2013 |
24724.31 |
Singapore |
| 1/09/2014 |
28700.69 |
Singapore |
| 1/09/2015 |
30423.61 |
Singapore |
| 1/09/2016 |
33525.69 |
Singapore |
| 1/09/2017 |
35938.19 |
Singapore |
| 1/09/2018 |
36240.97 |
Singapore |
| 1/09/1996 |
3853.472 |
China |
| 1/09/1997 |
4802.778 |
China |
| 1/09/1998 |
5854.861 |
China |
| 1/09/1999 |
6667.361 |
China |
| 1/09/2000 |
8390.972 |
China |
| 1/09/2001 |
11292.36 |
China |
| 1/09/2002 |
13892.36 |
China |
| 1/09/2003 |
15298.61 |
China |
| 1/09/2004 |
16661.11 |
China |
| 1/09/2005 |
22138.19 |
China |
| 1/09/2006 |
23743.75 |
China |
| 1/09/2007 |
26997.92 |
China |
| 1/09/2008 |
30311.81 |
China |
| 1/09/2009 |
29913.89 |
China |
| 1/09/2010 |
31813.19 |
China |
| 1/09/2011 |
40127.78 |
China |
| 1/09/2012 |
47215.97 |
China |
| 1/09/2013 |
55395.14 |
China |
| 1/09/2014 |
63354.17 |
China |
| 1/09/2015 |
74829.17 |
China |
| 1/09/2016 |
91871.53 |
China |
| 1/09/2017 |
104201.4 |
China |
| 1/09/2018 |
115805.6 |
China |
| 1/09/1996 |
11819.44 |
Hong Kong |
| 1/09/1997 |
12855.56 |
Hong Kong |
| 1/09/1998 |
12237.5 |
Hong Kong |
| 1/09/1999 |
11795.14 |
Hong Kong |
| 1/09/2000 |
12090.28 |
Hong Kong |
| 1/09/2001 |
12874.31 |
Hong Kong |
| 1/09/2002 |
12627.78 |
Hong Kong |
| 1/09/2003 |
11920.14 |
Hong Kong |
| 1/09/2004 |
10981.25 |
Hong Kong |
| 1/09/2005 |
11846.53 |
Hong Kong |
| 1/09/2006 |
12827.78 |
Hong Kong |
| 1/09/2007 |
12165.97 |
Hong Kong |
| 1/09/2008 |
11356.94 |
Hong Kong |
| 1/09/2009 |
11320.83 |
Hong Kong |
| 1/09/2010 |
11936.81 |
Hong Kong |
| 1/09/2011 |
12800 |
Hong Kong |
| 1/09/2012 |
12901.39 |
Hong Kong |
| 1/09/2013 |
13916.67 |
Hong Kong |
| 1/09/2014 |
15858.33 |
Hong Kong |
| 1/09/2015 |
16908.33 |
Hong Kong |
| 1/09/2016 |
19050 |
Hong Kong |
| 1/09/2017 |
21195.14 |
Hong Kong |
| 1/09/2018 |
24311.11 |
Hong Kong |
| 1/09/1996 |
66894.44 |
Japan |
| 1/09/1997 |
67371.53 |
Japan |
| 1/09/1998 |
66654.17 |
Japan |
| 1/09/1999 |
61361.11 |
Japan |
| 1/09/2000 |
58784.72 |
Japan |
| 1/09/2001 |
60181.94 |
Japan |
| 1/09/2002 |
55550.69 |
Japan |
| 1/09/2003 |
56908.33 |
Japan |
| 1/09/2004 |
54864.58 |
Japan |
| 1/09/2005 |
58693.75 |
Japan |
| 1/09/2006 |
56020.14 |
Japan |
| 1/09/2007 |
51814.58 |
Japan |
| 1/09/2008 |
44915.28 |
Japan |
| 1/09/2009 |
35212.5 |
Japan |
| 1/09/2010 |
30384.72 |
Japan |
| 1/09/2011 |
31290.97 |
Japan |
| 1/09/2012 |
28311.81 |
Japan |
| 1/09/2013 |
28653.47 |
Japan |
| 1/09/2014 |
27554.17 |
Japan |
| 1/09/2015 |
27748.61 |
Japan |
| 1/09/2016 |
30539.58 |
Japan |
| 1/09/2017 |
35315.97 |
Japan |
| 1/09/2018 |
36684.72 |
Japan |
| 1/09/1996 |
15270.14 |
South Korea |
| 1/09/1997 |
19942.36 |
South Korea |
| 1/09/1998 |
14406.94 |
South Korea |
| 1/09/1999 |
6829.167 |
South Korea |
| 1/09/2000 |
10634.03 |
South Korea |
| 1/09/2001 |
13402.08 |
South Korea |
| 1/09/2002 |
14811.81 |
South Korea |
| 1/09/2003 |
16340.97 |
South Korea |
| 1/09/2004 |
17556.25 |
South Korea |
| 1/09/2005 |
19187.5 |
South Korea |
| 1/09/2006 |
20848.61 |
South Korea |
| 1/09/2007 |
22618.75 |
South Korea |
| 1/09/2008 |
20884.03 |
South Korea |
| 1/09/2009 |
17243.06 |
South Korea |
| 1/09/2010 |
16163.19 |
South Korea |
| 1/09/2011 |
17826.39 |
South Korea |
| 1/09/2012 |
17101.39 |
South Korea |
| 1/09/2013 |
16870.83 |
South Korea |
| 1/09/2014 |
16688.89 |
South Korea |
| 1/09/2015 |
17350.69 |
South Korea |
| 1/09/2016 |
20345.83 |
South Korea |
| 1/09/2017 |
23785.42 |
South Korea |
| 1/09/2018 |
25263.19 |
South Korea |
| 1/09/1996 |
1520.833 |
India |
| 1/09/1997 |
1896.528 |
India |
| 1/09/1998 |
2260.417 |
India |
| 1/09/1999 |
2557.639 |
India |
| 1/09/2000 |
3008.333 |
India |
| 1/09/2001 |
3669.444 |
India |
| 1/09/2002 |
3912.5 |
India |
| 1/09/2003 |
3665.972 |
India |
| 1/09/2004 |
4120.833 |
India |
| 1/09/2005 |
4722.917 |
India |
| 1/09/2006 |
5915.972 |
India |
| 1/09/2007 |
6887.5 |
India |
| 1/09/2008 |
8055.556 |
India |
| 1/09/2009 |
9284.722 |
India |
| 1/09/2010 |
10370.14 |
India |
| 1/09/2011 |
11822.22 |
India |
| 1/09/2012 |
12634.72 |
India |
| 1/09/2013 |
13960.42 |
India |
| 1/09/2014 |
15279.86 |
India |
| 1/09/2015 |
17899.31 |
India |
| 1/09/2016 |
19917.36 |
India |
| 1/09/2017 |
22718.75 |
India |
| 1/09/2018 |
26704.86 |
India |
| 1/09/1996 |
25585.42 |
United States of America |
| 1/09/1997 |
26731.94 |
United States of America |
| 1/09/1998 |
28695.14 |
United States of America |
| 1/09/1999 |
32138.89 |
United States of America |
| 1/09/2000 |
35752.78 |
United States of America |
| 1/09/2001 |
41114.58 |
United States of America |
| 1/09/2002 |
36431.94 |
United States of America |
| 1/09/2003 |
35609.03 |
United States of America |
| 1/09/2004 |
35493.06 |
United States of America |
| 1/09/2005 |
36456.94 |
United States of America |
| 1/09/2006 |
37104.86 |
United States of America |
| 1/09/2007 |
37663.19 |
United States of America |
| 1/09/2008 |
38606.25 |
United States of America |
| 1/09/2009 |
38063.89 |
United States of America |
| 1/09/2010 |
40615.97 |
United States of America |
| 1/09/2011 |
39808.33 |
United States of America |
| 1/09/2012 |
39800 |
United States of America |
| 1/09/2013 |
42121.53 |
United States of America |
| 1/09/2014 |
44010.42 |
United States of America |
| 1/09/2015 |
47827.08 |
United States of America |
| 1/09/2016 |
53830.56 |
United States of America |
| 1/09/2017 |
61522.22 |
United States of America |
| 1/09/2018 |
65537.5 |
United States of America |
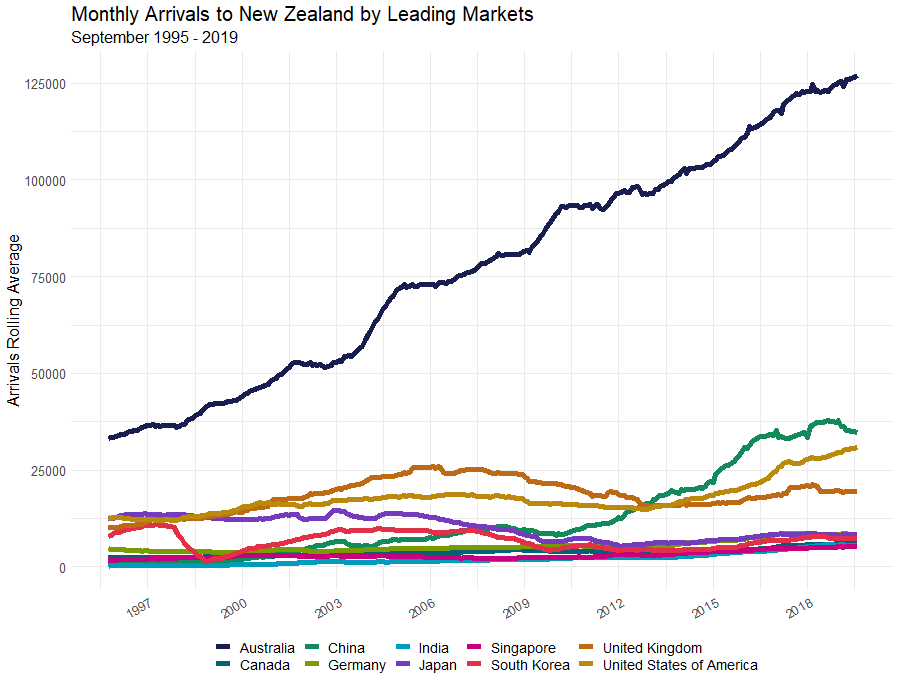
Annual arrivals from China to Australia increased rapidly since 2010, from around 428 thousand to 1.44 million in 2018. Annual arrivals from China to New Zealand increased slightly faster, from 115 thousand to 413 thousand, but from a much lower base.
Source: Statistics New Zealand
Monthly arrivals to New Zealand by leading markets - data table
| Date proper |
Rolling annual |
Variable |
| 1/09/1997 |
36366.62 |
Australia |
| 1/09/1998 |
37592.98 |
Australia |
| 1/09/1999 |
42014.26 |
Australia |
| 1/09/2000 |
44872.1 |
Australia |
| 1/09/2001 |
49657.74 |
Australia |
| 1/09/2002 |
52322.33 |
Australia |
| 1/09/2003 |
53723 |
Australia |
| 1/09/2004 |
62520.58 |
Australia |
| 1/09/2005 |
71940.22 |
Australia |
| 1/09/2006 |
73209.26 |
Australia |
| 1/09/2007 |
76215.45 |
Australia |
| 1/09/2008 |
80088.71 |
Australia |
| 1/09/2009 |
82995.49 |
Australia |
| 1/09/2010 |
91937.51 |
Australia |
| 1/09/2011 |
93094.73 |
Australia |
| 1/09/2012 |
96884.81 |
Australia |
| 1/09/2013 |
97700.78 |
Australia |
| 1/09/2014 |
102376.8 |
Australia |
| 1/09/2015 |
105923.8 |
Australia |
| 1/09/2016 |
112593 |
Australia |
| 1/09/2017 |
119026.1 |
Australia |
| 1/09/2018 |
122965.8 |
Australia |
| 1/09/1996 |
842.2431 |
China |
| 1/09/1997 |
1284.757 |
China |
| 1/09/1998 |
1421.965 |
China |
| 1/09/1999 |
1439.118 |
China |
| 1/09/2000 |
2210.917 |
China |
| 1/09/2001 |
3318.729 |
China |
| 1/09/2002 |
5012.521 |
China |
| 1/09/2003 |
6113.465 |
China |
| 1/09/2004 |
5835.347 |
China |
| 1/09/2005 |
6993.451 |
China |
| 1/09/2006 |
7725.076 |
China |
| 1/09/2007 |
9358.785 |
China |
| 1/09/2008 |
10167.15 |
China |
| 1/09/2009 |
9187.375 |
China |
| 1/09/2010 |
8738.181 |
China |
| 1/09/2011 |
10703.1 |
China |
| 1/09/2012 |
13557.12 |
China |
| 1/09/2013 |
17682.22 |
China |
| 1/09/2014 |
19883.44 |
China |
| 1/09/2015 |
24333.11 |
China |
| 1/09/2016 |
31582.56 |
China |
| 1/09/2017 |
33794.11 |
China |
| 1/09/2018 |
36205.67 |
China |
| 1/09/1996 |
293.4236 |
India |
| 1/09/1997 |
364.8472 |
India |
| 1/09/1998 |
411.8333 |
India |
| 1/09/1999 |
465.9861 |
India |
| 1/09/2000 |
595.1319 |
India |
| 1/09/2001 |
804.2569 |
India |
| 1/09/2002 |
1177.847 |
India |
| 1/09/2003 |
1345.201 |
India |
| 1/09/2004 |
1254.278 |
India |
| 1/09/2005 |
1362.465 |
India |
| 1/09/2006 |
1537.583 |
India |
| 1/09/2007 |
1725.181 |
India |
| 1/09/2008 |
1890.792 |
India |
| 1/09/2009 |
1998.118 |
India |
| 1/09/2010 |
2194.896 |
India |
| 1/09/2011 |
2443.354 |
India |
| 1/09/2012 |
2417.167 |
India |
| 1/09/2013 |
2493.889 |
India |
| 1/09/2014 |
2710.778 |
India |
| 1/09/2015 |
3376.889 |
India |
| 1/09/2016 |
3919.444 |
India |
| 1/09/2017 |
4499.111 |
India |
| 1/09/2018 |
5338.667 |
India |
| 1/09/1996 |
13130.06 |
Japan |
| 1/09/1997 |
13530.49 |
Japan |
| 1/09/1998 |
13299.9 |
Japan |
| 1/09/1999 |
12524.75 |
Japan |
| 1/09/2000 |
12251.14 |
Japan |
| 1/09/2001 |
13081.86 |
Japan |
| 1/09/2002 |
12587.69 |
Japan |
| 1/09/2003 |
13850.63 |
Japan |
| 1/09/2004 |
12977.08 |
Japan |
| 1/09/2005 |
13635.54 |
Japan |
| 1/09/2006 |
12525.9 |
Japan |
| 1/09/2007 |
10908.54 |
Japan |
| 1/09/2008 |
9794.271 |
Japan |
| 1/09/2009 |
7866.847 |
Japan |
| 1/09/2010 |
6814.16 |
Japan |
| 1/09/2011 |
6902.056 |
Japan |
| 1/09/2012 |
5654.563 |
Japan |
| 1/09/2013 |
6128.889 |
Japan |
| 1/09/2014 |
6264.889 |
Japan |
| 1/09/2015 |
6903.222 |
Japan |
| 1/09/2016 |
7621.333 |
Japan |
| 1/09/2017 |
8411.889 |
Japan |
| 1/09/2018 |
8480.333 |
Japan |
| 1/09/1996 |
9220.917 |
South Korea |
| 1/09/1997 |
10665.34 |
South Korea |
| 1/09/1998 |
6202.271 |
South Korea |
| 1/09/1999 |
2144.729 |
South Korea |
| 1/09/2000 |
4411.514 |
South Korea |
| 1/09/2001 |
6001.493 |
South Korea |
| 1/09/2002 |
7776.542 |
South Korea |
| 1/09/2003 |
9300.875 |
South Korea |
| 1/09/2004 |
9574.611 |
South Korea |
| 1/09/2005 |
9467.861 |
South Korea |
| 1/09/2006 |
9082.236 |
South Korea |
| 1/09/2007 |
9251.757 |
South Korea |
| 1/09/2008 |
7800.514 |
South Korea |
| 1/09/2009 |
5759.167 |
South Korea |
| 1/09/2010 |
4821.076 |
South Korea |
| 1/09/2011 |
5253.34 |
South Korea |
| 1/09/2012 |
4411.91 |
South Korea |
| 1/09/2013 |
4290.111 |
South Korea |
| 1/09/2014 |
4373.444 |
South Korea |
| 1/09/2015 |
4867.111 |
South Korea |
| 1/09/2016 |
5937.111 |
South Korea |
| 1/09/2017 |
6909.778 |
South Korea |
| 1/09/2018 |
7691 |
South Korea |
| 1/09/1996 |
1841.333 |
Singapore |
| 1/09/1997 |
2057.799 |
Singapore |
| 1/09/1998 |
2318.958 |
Singapore |
| 1/09/1999 |
2359.958 |
Singapore |
| 1/09/2000 |
2893.382 |
Singapore |
| 1/09/2001 |
2952.674 |
Singapore |
| 1/09/2002 |
2730.75 |
Singapore |
| 1/09/2003 |
2748.667 |
Singapore |
| 1/09/2004 |
2753.097 |
Singapore |
| 1/09/2005 |
2705 |
Singapore |
| 1/09/2006 |
2466.979 |
Singapore |
| 1/09/2007 |
2319.722 |
Singapore |
| 1/09/2008 |
2241.125 |
Singapore |
| 1/09/2009 |
2400.757 |
Singapore |
| 1/09/2010 |
2489.722 |
Singapore |
| 1/09/2011 |
2629.014 |
Singapore |
| 1/09/2012 |
3200.951 |
Singapore |
| 1/09/2013 |
3090.778 |
Singapore |
| 1/09/2014 |
3599.556 |
Singapore |
| 1/09/2015 |
3920.111 |
Singapore |
| 1/09/2016 |
4301.556 |
Singapore |
| 1/09/2017 |
4776.222 |
Singapore |
| 1/09/2018 |
4951.889 |
Singapore |
| 1/09/1996 |
4430.021 |
Germany |
| 1/09/1997 |
4054.66 |
Germany |
| 1/09/1998 |
3952.076 |
Germany |
| 1/09/1999 |
3764.167 |
Germany |
| 1/09/2000 |
3997.806 |
Germany |
| 1/09/2001 |
4406.285 |
Germany |
| 1/09/2002 |
4173.215 |
Germany |
| 1/09/2003 |
4196.59 |
Germany |
| 1/09/2004 |
4499.833 |
Germany |
| 1/09/2005 |
4741.861 |
Germany |
| 1/09/2006 |
4826.542 |
Germany |
| 1/09/2007 |
4926.889 |
Germany |
| 1/09/2008 |
5029.611 |
Germany |
| 1/09/2009 |
5215.688 |
Germany |
| 1/09/2010 |
5416.007 |
Germany |
| 1/09/2011 |
5413.535 |
Germany |
| 1/09/2012 |
5268.965 |
Germany |
| 1/09/2013 |
5370.667 |
Germany |
| 1/09/2014 |
6110.889 |
Germany |
| 1/09/2015 |
6666.444 |
Germany |
| 1/09/2016 |
7397.778 |
Germany |
| 1/09/2017 |
8439.111 |
Germany |
| 1/09/2018 |
8576 |
Germany |
| 1/09/1996 |
10507.78 |
United Kingdom |
| 1/09/1997 |
11910.19 |
United Kingdom |
| 1/09/1998 |
12412.21 |
United Kingdom |
| 1/09/1999 |
13250.6 |
United Kingdom |
| 1/09/2000 |
14750.11 |
United Kingdom |
| 1/09/2001 |
17088.81 |
United Kingdom |
| 1/09/2002 |
18478.6 |
United Kingdom |
| 1/09/2003 |
20349.74 |
United Kingdom |
| 1/09/2004 |
22683.84 |
United Kingdom |
| 1/09/2005 |
24495.21 |
United Kingdom |
| 1/09/2006 |
25208.72 |
United Kingdom |
| 1/09/2007 |
24921.6 |
United Kingdom |
| 1/09/2008 |
24344.25 |
United Kingdom |
| 1/09/2009 |
22559.78 |
United Kingdom |
| 1/09/2010 |
21040.53 |
United Kingdom |
| 1/09/2011 |
18913.77 |
United Kingdom |
| 1/09/2012 |
18276.67 |
United Kingdom |
| 1/09/2013 |
15814.33 |
United Kingdom |
| 1/09/2014 |
16114.22 |
United Kingdom |
| 1/09/2015 |
16426.78 |
United Kingdom |
| 1/09/2016 |
17498.44 |
United Kingdom |
| 1/09/2017 |
19196.22 |
United Kingdom |
| 1/09/2018 |
20393.89 |
United Kingdom |
| 1/09/1996 |
2419.792 |
Canada |
| 1/09/1997 |
2461.444 |
Canada |
| 1/09/1998 |
2502.611 |
Canada |
| 1/09/1999 |
2646.785 |
Canada |
| 1/09/2000 |
2729.424 |
Canada |
| 1/09/2001 |
2902.257 |
Canada |
| 1/09/2002 |
3168.722 |
Canada |
| 1/09/2003 |
3300.958 |
Canada |
| 1/09/2004 |
3341.486 |
Canada |
| 1/09/2005 |
3453.826 |
Canada |
| 1/09/2006 |
3601.903 |
Canada |
| 1/09/2007 |
3868.729 |
Canada |
| 1/09/2008 |
4214.701 |
Canada |
| 1/09/2009 |
4237.174 |
Canada |
| 1/09/2010 |
4058.972 |
Canada |
| 1/09/2011 |
4074.257 |
Canada |
| 1/09/2012 |
4077.375 |
Canada |
| 1/09/2013 |
3898 |
Canada |
| 1/09/2014 |
4014.889 |
Canada |
| 1/09/2015 |
4155.222 |
Canada |
| 1/09/2016 |
4532.889 |
Canada |
| 1/09/2017 |
5252.444 |
Canada |
| 1/09/2018 |
5692.222 |
Canada |
| 1/09/1996 |
12577.39 |
United States of America |
| 1/09/1997 |
12187.37 |
United States of America |
| 1/09/1998 |
12585.77 |
United States of America |
| 1/09/1999 |
13796.58 |
United States of America |
| 1/09/2000 |
15629.38 |
United States of America |
| 1/09/2001 |
16243.92 |
United States of America |
| 1/09/2002 |
16096.36 |
United States of America |
| 1/09/2003 |
17126.13 |
United States of America |
| 1/09/2004 |
17672.27 |
United States of America |
| 1/09/2005 |
18251.06 |
United States of America |
| 1/09/2006 |
18310.93 |
United States of America |
| 1/09/2007 |
18534.85 |
United States of America |
| 1/09/2008 |
18168.35 |
United States of America |
| 1/09/2009 |
16841.22 |
United States of America |
| 1/09/2010 |
16267.19 |
United States of America |
| 1/09/2011 |
15740.72 |
United States of America |
| 1/09/2012 |
15284.78 |
United States of America |
| 1/09/2013 |
15460.22 |
United States of America |
| 1/09/2014 |
17181.11 |
United States of America |
| 1/09/2015 |
18980.44 |
United States of America |
| 1/09/2016 |
21078.33 |
United States of America |
| 1/09/2017 |
25684.56 |
United States of America |
| 1/09/2018 |
27902.67 |
United States of America |
Due to its proximity, Australia is New Zealand's main source of visitors, contributing over 39 per cent of all visitor arrivals to New Zealand in the year ending September 2019. About one-quarter of visitor arrivals from Australia were also New Zealand citizens.
Last updated: 11 February 2020