New Zealand’s migrant worker population is diverse and well educated
This section outlines the composition of the migrant worker sample, as well as some high-level survey results.
On this page I tēnei whārangi
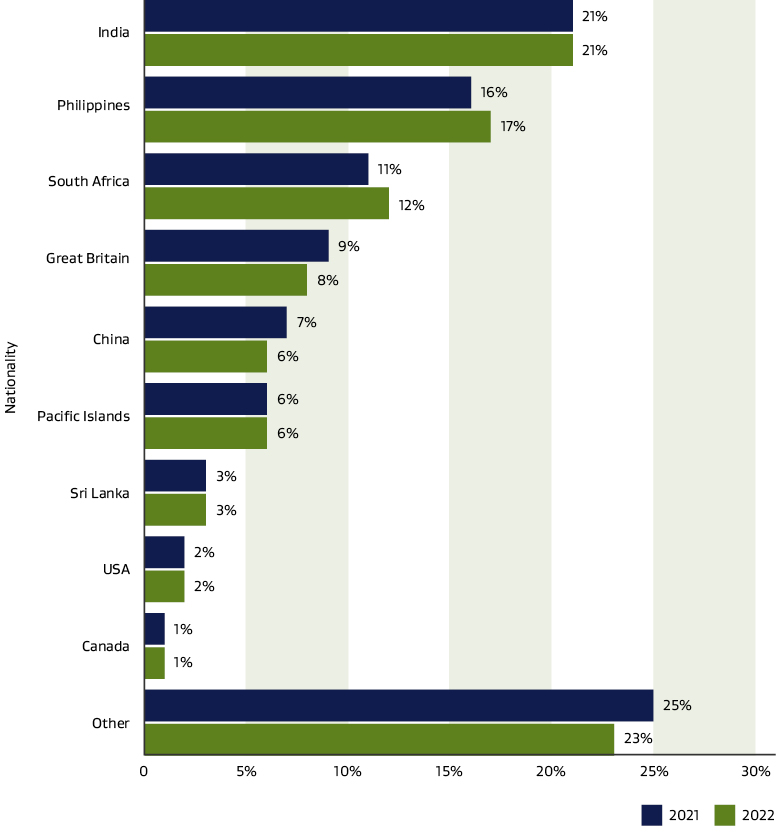
For both 2021 and 2022, the top nationalities of migrant employees were people from India (21% both years) and the Philippines (16% in 2021, 17% in 2022). About two-thirds of migrant employees had at least a Bachelor’s degree (63% in 2021, 66% in 2022) and almost all reported speaking English ‘well’ or ‘very well’ (92% in 2021, 93% in 2022).
Figure 1: Nationalities of migrant employees, 2021 and 2022

Text description of figure 1
Gender plays a part in the occupations and industries worked in
Despite an overall even distribution of male and female workers in the New Zealand migrant population, the ‘construction’ (85% male in 2021, 86% in 2022) and ‘manufacturing’ (74% male in 2021, 65% in 2022) industries were male-dominated, as were the occupations ‘technicians and trades workers’ (85% male in 2021, 80% in 2022), ‘managers’ (60% male in 2021), ‘labourers’ (58% male in 2021, 57% in 2022), and ‘machinery operators and drivers’ (89% male in 2021, 77% in 2022).
Female-dominated industries included ‘healthcare and social assistance’ (71% female in 2021, 73% in 2022), ‘education and training’ (78% female in both years). Female-dominated occupations included ‘community and personal support workers’ (66% female in 2021, 69% in 2022), ‘clerical and administration’ (79% female in 2021, 74% in 2022), and ‘sales workers’ (60% female in 2021, 69% in 2022).
While most migrant employees held work visas in 2021, in 2022 it was more likely for migrant employees to be on resident visas
In 2021, 70% of migrant employees were on work visas, and 30% were on resident visas. In 2022, this reversed to 39% of migrants on work visas, and 61% on resident visas. This significant increase in resident visas was driven by the introduction of the one-off 2021 Resident Visa pathway for ‘settled’, ‘scarce’, and ‘skilled’ work visa holders.
This visa was introduced due to the impact of COVID-19 on migrant workers (2021 Resident Visa(external link) — Immigration New Zealand
Applications for this pathway to residence were open to work visa holders in New Zealand between 30 September 2021 and 31 July 2022.
The most common industry of work for migrant employees was healthcare and social assistance
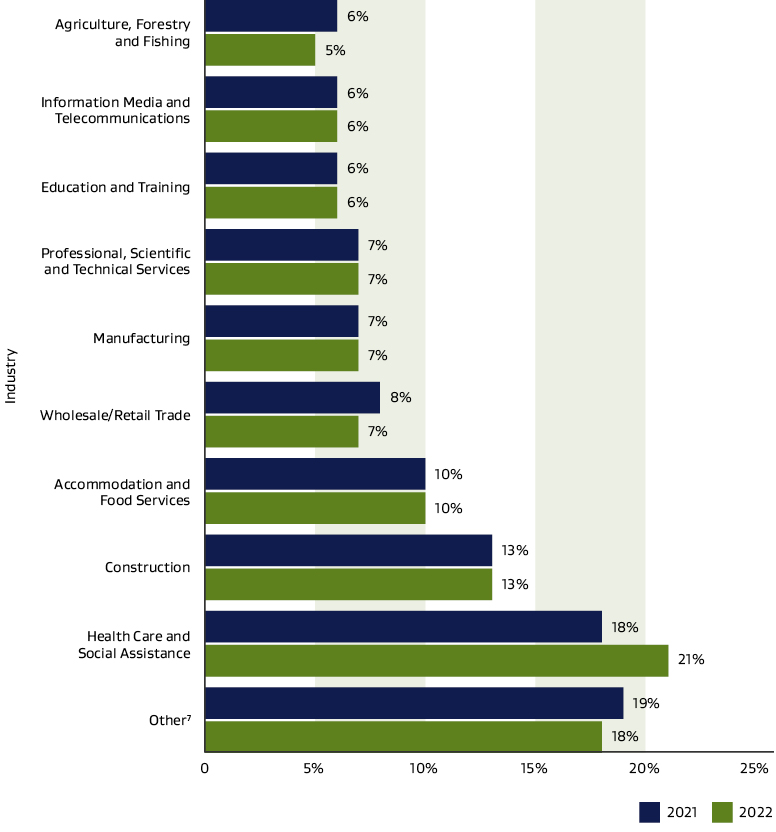
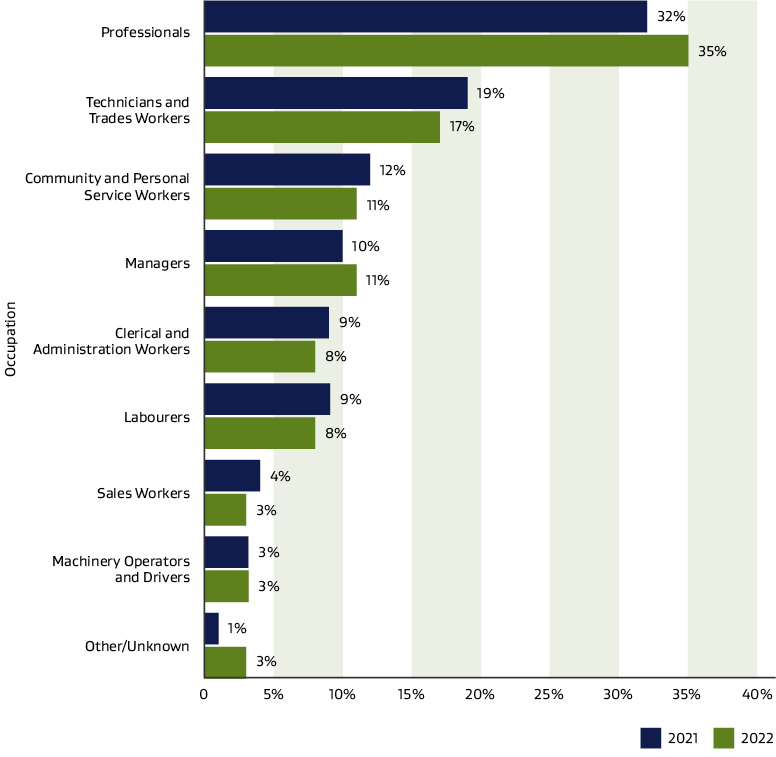
In both years, migrant employees most commonly worked in the ‘healthcare and social assistance’ (18% in 2021 and 21% in 2022) and ‘construction’ (13% in 2021 and 2022) industries and in ‘professional’ occupations (32% in 2021 and 35% in 2022) or as ‘technicians and trades workers’ (19% in 2021 and 17% in 2022). See Figures 2 and 3 below.
Figure 2: Industries worked in by migrant employees, 2021 and 2022

Note: Industry data were categorised using the Australian and New Zealand Standard Industrial Classification 2006, V1.0.0. When multiple or ambiguous responses were provided, these were categorised based on the information available.
Note: ‘Other’ is comprised of the 8 least common industries for migrant employees.
Text description of figure 2
Figure 3: Occupations of migrant employees, 2021 and 2022

Note: Occupations were classified using the Australian and New Zealand Standard Classification of Occupations, 2022 Australian Update, V1.0.0.
Text description of figure 3
Migrant workers with better English language proficiency also had higher educational attainment
Self-reported English language proficiency of migrant employees was linked to educational attainment, with higher proficiency reported among those whose highest educational qualification was a Bachelor’s degree or higher.
In 2021, 93% of those with a Bachelor’s degree or higher spoke English well/very well compared to 89% of those without a Bachelor’s degree and in 2022, 95% of those with a Bachelor’s degree spoke English well/very well compared with 88% without a Bachelor’s degree. There was also an increase in English language capability among those with a Bachelor’s degree or higher in 2022 compared to 2021.
Indian migrant employees were among the most likely to have postgraduate qualifications
Indian (46% in 2021, 49% in 2022) and Chinese migrants in 2021 (45% in 2021) were the nationalities most likely to have postgraduate qualifications. In contrast, Pacific migrant employees were the most likely to report that their highest educational qualification was below a Bachelor’s degree (81% in 2021 and 65% in 2022).
- The 2021 survey included resident visa holders approved under the Pacific Access Category (PAC) and Samoan Quota (SQ) schemes, which were not included in the 2022 survey. These schemes do not require applicants to meet the English language, financial or same employment criteria of most pathways to residence.
Many Sri Lankan and American migrant workers also had postgraduate qualifications, with 30% or more having postgraduate qualification in each survey year. In 2022, the proportion of Chinese migrants with postgraduate qualifications (at 36%) was lower than for Sri Lankan (41%) and American (42%) migrants.
Few migrant employees had felt unsafe because of their current employer’s behaviour
In both years, 4% of migrant workers reported that they had felt unsafe because of their current employer’s behaviour.
Migrant employees who sought help with their working conditions most often contacted their union
In 2022, 5% of migrant workers contacted someone (who wasn’t a family member or friend) for help with problems about their working conditions. It was most common for these workers to have contacted a union (20%) or a solicitor/lawyer (14%) for help. See Table 1 below.
Table 1: Migrants who sought help with problems to do with working conditions, 2022
|
Contacted for help (2022 only) Weighted count (2022) |
2022 N = 107,414 |
| No | 92 |
| Yes | 5 |
| Don't know/Prefer not to answer | 2 |
| (If yes) Who did you contact for help? Please select all that apply | |
| Solicitor/lawyer | 14 |
| Citizens Advice Bureau (CAB) | 9 |
| Migrant Workers Association NZ | 4 |
| Church or religious group/spokesperson | 8 |
| Ethnic community group, network, or association | 4 |
| Union | 20 |
| Employment New Zealand’s Migrant Exploitation Helpline | 9 |
Migrants who felt their job didn’t match their skills and qualifications had often chosen to pursue a different career/job in New Zealand or could not find a job in their area of qualifications/skills
A similar proportion each year (20% in 2021, 18% in 2022) reported their job did not match their skills and qualifications, with a further 11% each year saying their job partially matched their skills and qualifications.
Of those without a job that matched their skills and qualifications, more were over-qualified (20% in 2021, 23% in 2022) than under-qualified (2% in 2021, 1% in 2022). In 2022 the most common reported reason for a mismatch was by choice (43% in 2022), followed by difficulty finding a job that matched skills and qualifications in New Zealand (34% in 2022). In 2021, similar proportions of those with a skills mismatch had chosen to pursue a different career/job in New Zealand (38% in 2021) and had been unable to get a job in their field (37% in 2021). See Table 2 below.
Across the 2 survey years, migrants working as ‘professionals’ were the most likely of all occupation groups to report that their job matched their skills and qualifications, at 86% in 2021 and 89% in 2022. In addition, women were less likely than men to have a job that matched their skills and qualifications (74% of men in both years, 62% of women in 2021 and 66% of women in 2022). In both years, migrants working in ‘accommodation/food services’ (38% in 2021, 31% in 2022) and ‘agriculture, forestry and fishing’ (43% in 2021, 33% in 2022) were the most likely to report that their job did not match their skills and qualifications, and in 2022 this also included migrants working in the ‘wholesale/retail trade’ industry (35% in 2022).
Table 2: How well migrants jobs match their skills and qualifications, 2021 and 2022
|
Does your current role in your main job match the skills and qualifications you have? Weighted count (2021 and 2022) |
2021 N = 149,167 |
2022 N = 107,414 |
| No | 20 | 18 |
| Yes | 68 | 70 |
| Partly | 11 | 11 |
| Don't know/Prefer not to answer | 1 | 2 |
| (If yes) What are the reasons why your job does not match your skills and qualifications? Please select all that apply. | ||
| I am over-qualified for my current job | 20 | 23 |
| I am under-qualified in my current job | 2 | 1 |
| My qualifications are not recognised in New Zealand | 17 | 20 |
| I chose to pursue a different career/job in New Zealand | 38 | 43 |
| I couldn't get a job in the area of my qualifications/skills | 37 | 34 |
| My previous work experience is not recognised by New Zealand employers | 14 | 15 |
| Visa restrictions i.e. on a WHV, don't have residence, visa expired | 0 | 1 |
| Language difficulties/English is my second language | 1 | 1 |
< Survey questions used in this analysis | Most migrant workers receive their minimum employment entitlements and have good working conditions, but some groups are more vulnerable in their jobs >

