Most migrant workers receive their minimum employment entitlements and have good working conditions, but some groups are more vulnerable in their jobs
This section presents survey results by demographic group, highlighting groups who are more or less likely to experience adverse working conditions.
On this page I tēnei whārangi
Minimum rights and responsibilities set out in law apply to all employees, including migrant workers
Under New Zealand law, the adult minimum wage was $20.00 from April 2021, and $21.20 from April 2022. Employers are also required to provide workers with a written employment agreement, 4 weeks paid annual holidays per year, and 10 days’ paid sick leave per annum after 6 months of continuous employment. Further information about these and other basic employment entitlements is listed on the MBIE’s ‘Employment New Zealand’ website.
Minimum rights of employees(external link) — Employment New Zealand
About a quarter of migrant employees feel they don't understand their employment rights well
About a quarter of migrant employees felt they didn’t understand their employment rights well – ‘not that well’ or ‘not at all well’ – (25% in 2021 and 23% in 2022), with a higher proportion of women than men reporting this in both years (28% of women in 2021 and 25% of women in 2022, 22% of men in 2021 and 21% of men in 2022).
Migrants in the ‘education and training’ industry were more likely to report that they did not understand their employment rights well than the overall average for all migrant workers at 33% in 2021 and 34% in 2022. This 2022 result for ‘education and training’ was significantly higher than almost all other major industry groups.
Filipino workers, men, and those with lower qualification levels and English language proficiency were more likely to have had their entitlements withheld
In 2021, 7% of migrant workers reported that their employer had withheld, or said they would withhold, entitlements such as holiday pay or sick leave. This proportion reduced slightly in 2022 to 5%.
Migrant employees from the Philippines more commonly reported that their employer had withheld, or said they would withhold, entitlements compared with all migrant workers. In 2021, 21% of Filipino migrant workers reported that that their entitlements were withheld/their employer had threatened to withhold entitlements. However, in 2022 this proportion had reduced to 12% of Filipino migrant workers.
In both years, migrant workers in ‘construction’ (16% in 2021 and 10% in 2022), ‘agriculture, forestry and fishing’ (13% in 2021 and 8% in 2022), and ‘manufacturing’ (13% in 2021 and 7% in 2022) were the most likely to report that their employer had withheld/threatened to withhold entitlements. Men were also more likely to have experienced this breach of their rights than women, at 9% of men compared to 5% of women in 2021, and 6% of men and 3% of women in 2022. As men were more likely to work in labour intensive industries, this trend may be industry rather than gender-related.
The occupational groups most likely to have their entitlements withheld or have had their employer threaten to withhold entitlements were ‘technicians/trade workers’ (14% in 2021 and 10% in 2022), ‘machinery operators/drivers’ (17% in 2021 and 9% in 2022), and labourers (13% in 2021 and 12% in 2022). Migrant employees who were among the least likely to report that their employer had withheld or threatened to withhold entitlements were those who worked in ‘professional’ occupations (2% each year), as ‘clerical and administration workers’ (3% in 2021 and 2% in 2022), and as ‘managers’ in 2021 (4%).
In 2021, migrant workers on temporary visas were more likely to report that their employer had withheld or threatened to withhold entitlements (9%) than migrants who were resident visa holders (3%). In 2022, there was no significant difference between the 2 groups. However, the makeup of the 2022 Resident Visa cohort was probably more similar to the 2021 work visa cohort due to the large number of work visa holders becoming residents under the one-off 2021 Resident Visa pathway.
Both years, those with a Bachelor’s degree or higher were less likely to have their entitlements held back (6% in 2021 and 4% in 2022) compared to those without a Bachelor’s degree (9% in 2021 and 7% in 2022). This demonstrates an improvement for both groups from 2021 to 2022, but the disparity between those with and without a degree has remained.
In 2021, migrant workers with lower levels of English language proficiency were more likely to report that their employer had withheld or threatened to withhold entitlements than those with higher levels of English proficiency. This difference was not observed in 2022. Only 7% of migrants who spoke English ‘very well’ or ‘well’ reported that their entitlements had been withheld/their employer had threatened to withhold entitlements compared to 12% of those who spoke English ‘neither well nor not well’ and 13% who spoke English ‘not very well/not at all well’.
Figure 4: Prevalence of entitlements being held back by English conversational ability, 2021
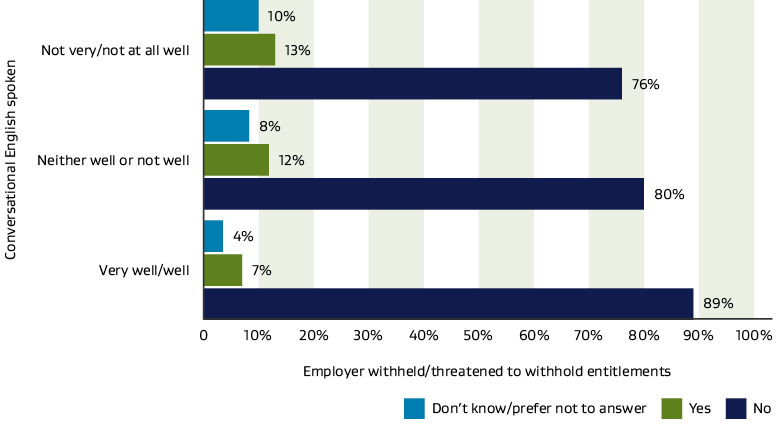
Text description of figure 4
Being paid less than the minimum wage was more common for those without a university qualification, Pacific and Filipino migrants, and manual or machine labourers
3% of migrant workers reported that they were being paid less than the adult minimum wage in 2021 and this was similar in 2022, at 2%, while 93% of migrant employees were being paid at least the legal adult minimum wage in their current main job.
For both years, the occupations with the highest proportions of migrant workers being paid less than minimum wage were ‘machinery operators/drivers’ (6% in 2021 and 5% in 2022) and ‘labourers’ (6% in 2021 and 7% in 2022). Migrant employees who were the least likely to be paid less than the minimum wage worked in ‘professional’ occupations (1% for both years), ‘clerical and administration’ in 2022 (less than 1%), and as ‘managers’ in 2022 (1%). Despite the occupational variations in this result, there were no clear statistically significant differences by industry for either year.
Migrant workers from the Pacific Islands and the Philippines were over-represented among those who reported that they were being paid below minimum wage, in both survey years. In 2021, 7% of Pacific and 5% of Filipino migrant employees were being paid less than minimum wage. The most common nationalities were similar in 2022, with 4% of Pacific and 7% of Filipino migrants being paid less than the minimum wage.
While the overall proportion of migrant workers being paid less than the minimum wage was low, this proportion was lowest for those with a Bachelor’s degree or higher (2% in 2021, 1% in 2022), compared to those without a Bachelor’s degree (4% each year).
Migrants on temporary work visas were more likely to have been asked/expected to pay to get or keep their job, as were Filipino and Indian migrants
In both years, 4% of migrant workers had been asked or expected to pay their employer to get or keep their job. The small proportion who had been asked/expected to pay to get or keep their job were more likely to be working as ‘machinery operators and drivers’ (11% in 2021 and 7% in 2022), ‘technicians and trade workers’ (8% in 2021 and 6% in 2022), and ‘labourers’ in 2022 (7%).
In both years, temporary migrants were more likely to report that they had been asked/expected to pay to get or keep their job (5% both years) than resident visa holders (3% both years).
Again, in both years, those whose highest qualification was below a Bachelor’s degree were significantly more likely to be asked/expected by their employer to pay to get or keep their job (6% in 2021 and 5% in 2022) than those with a Bachelor’s degree or higher (4% in 2021 and 3% in 2022).
Migrants from the Philippines (7% in both years) and India (5% in both years) were also more likely to have been asked/expected to pay to get or keep their job.
Migrants with low levels of English proficiency were less likely to have written employment agreements
In both years, most migrant employees reported having written employment agreements for their main job (97% in 2021, 98% in 2022). Only 2% of migrant workers in 2021 and 1% in 2022 did not have a written employment agreement.
Migrants who spoke English ‘not very well’ or ‘not at all well’ were less likely to have written employment agreements (7% without an agreement in 2021 and 5% in 2022) than those who could speak English ‘well’ or ‘very well’ (1% in both years).
In 2021, the occupation with the highest proportion of migrant workers without a written employment agreement was ‘community and personal service workers’ (4%) while in 2022 this was ‘other’ occupations (4%) and ‘labourers’ (3%).
In 2021, Chinese migrants were the least likely group by nationality to have written employment agreements (4%). In contrast to some of the other findings from this analysis, in 2021, migrant employees from the Philippines were among those most likely to have a written employment agreement with only 1% of Filipino migrants reporting not having agreements.
Chinese migrant employees also had the lowest self-reported ability with conversational English (with only 58% speaking English at least ‘well’ in 2021 and 53% in 2022) compared with all other nationalities (where between 94% and 100% each year reported speaking English at least ‘well’). This may indicate that English language proficiency is one of the stronger indicators of whether a migrant worker has a written agreement rather than nationality. Although it is a legal requirement to provide a written employment agreement to every employee, the results suggest that employers may be overlooking this more often when they suspect the employee may not have the English language competency to read it. In 2022, no particular nationality group was more likely to have written employment agreements.
Figure 5: Prevalence of having a written employment agreement by English conversational ability, 2021
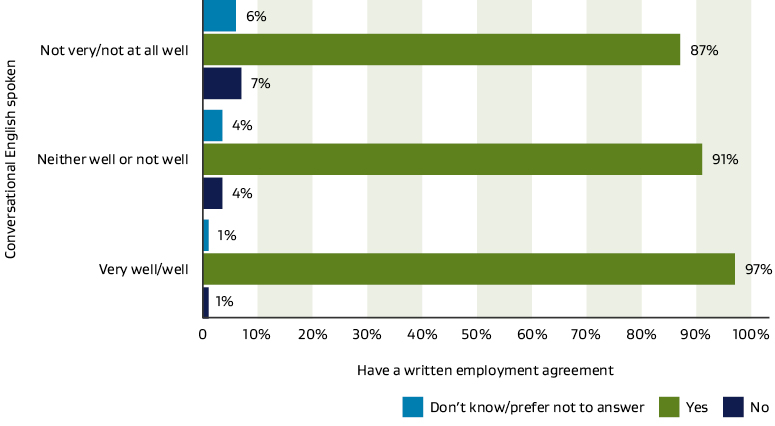
Text description of figure 5
More than half of migrant workers felt they had been treated unfairly because they came from overseas, and many of these experiences were related to employment
Over half of all migrant employees reported that they had been treated unfairly since coming to New Zealand because they came from overseas on one or more occasions (57% in 2021 and 58% of in 2022). Of those who were treated unfairly, 29% experienced this while working with external clients or customers in each survey year, 31% in 2021 and 28% in 2022 experienced this when applying for a job, and 34% in 2021 and 37% in 2022 were treated unfairly when they were working with a manager or supervisor.
Of those who were treated unfairly, ‘sales workers’ most commonly experienced this while dealing with a client or customer (49% in 2021, 44% in 2022). ‘Managers’ (37% in 2021, 34% in 2022) and ‘community and personal service workers’ (36% in 2021, 34% in 2022) also experienced unfair treatment from clients and customers at higher rates than those in other common occupations.
‘Labourers’ (40% in 2021, 46% in 2022) were more likely to experience unfair treatment from their manager, supervisor, or work colleagues. This type of unfair treatment was also prevalent for ‘technicians and trades workers’ (42% in 2021, 44% in 2022), ‘machinery operators and drivers’ (43% in 2021, 54% in 2022), and ‘community and personal service workers’ in 2021 (40%).
‘Labourers’ were less likely to receive information/support on health and safety at work than those in ‘professional’ occupations
Approximately 75% of migrant employees were provided with information or support from their employer on health and safety at work. Support or information ‘welcoming you to the workplace’ was the second most common type of support provided in both years, followed by information or support on ‘your employment rights and obligations’. About 40% each year did not receive information on their employment rights and obligations. See Table 3 below for the breakdown of these results by year.
Across the occupational groups, at least 70% of migrants received information or support about health and safety at work. Both years, the reported prevalence of this was slightly lower for ‘labourers’ (72% in 2021, 70% in 2022) than for migrant workers in several other more sedentary occupations, despite this being an occupation with physical injury risk.
Those in ‘professional’ (80% in 2021, 79% in 2022), ‘clerical and administration’ (77% in 2021, 75% in 2022) and ‘manager’ in 2022 (75%) occupations were among the most likely to be provided with information or support from their employer welcoming them to the workplace.
‘Technicians and trades workers’ (30% in 2021, 45% in 2022), ‘sales workers’ in 2022 (50%) and ‘labourers’ (24% in 2021, 41% in 2022) were among the least likely occupations to receive support and information from their employers about joining KiwiSaver, and ‘technicians and trades workers’ were also significantly less likely to have received information about joining a union than those in other occupations (at 12% in 2021 and 13% in 2022). This is similar to the proportion of managers getting information or support about joining a union (11% in 2021, 13% in 2022), despite managers being less likely to be eligible to join unions than workers in lower skilled jobs.
In 2022, employees were also asked if they had been provided with information or support on bullying and unfair treatment at work. Again, this support was less commonly received by those working as ‘technicians and trades workers’ (29%), ‘labourers’ (30%), ‘machinery operators and drivers’ (33%) and those working as ‘sales workers’ (35%).
Women were more likely than men to receive information from their employer about ‘KiwiSaver’ (46% of women and 39% of men in 2021, 58% of women and 54% of men in 2022). The increase in information provided about ‘KiwiSaver’ in 2022 may reflect the higher number of permanent migrants in the survey population in 2022 due to the introduction of the one-off 2021 Resident Visa scheme.
Men were more likely than women to receive information ‘supporting you or your family to settle in New Zealand’ (30% of men, 18% of women in 2021, 28% of men, 19% of women in 2022) and on ‘New Zealand work styles and communicating in the New Zealand workplace’ (42% of men, 36% of women in 2021, 41% of men, 34% of women in 2022). In 2022, a higher proportion of male than female employees were offered information or support with ‘improving your English language skills’ (17% of men, 13% of women), and with ‘supporting you or your family to settle in New Zealand’ (28% of men, 19% of women), and on ‘New Zealand work styles and communicating in the New Zealand workplace’ (41% of men, 34% of women). Women, however, were more likely than men to receive information on ‘joining a union’ (24% of women and 17% of men in 2021, 30% of women and 20% of men in 2022).
Table 3: Types of support and information provided by employers, 2021 and 2022
|
Has your current employer provided you with information on, or support with, the following areas? Please select all that apply. |
2021 N = 149,167 |
2022 N = 107,414 |
| Welcoming you to the workplace | 71 | 72 |
| Improving your English language skills | 16 | 25 |
| Supporting you or your family to settle in New Zealand | 24 | 23 |
| New Zealand work styles and communicating in the New Zealand workplace | 39 | 37 |
| Your employment rights and obligations | 58 | 59 |
| Health and safety at work (including mental health) | 77 | 75 |
| New Zealand tax system | 38 | 39 |
| KiwiSaver | 43 | 56 |
| Joining a union (if there is a union representing your workplace) | 20 | 25 |
| Bullying and unfair treatment at work | NA | 39 |
| No – none of the above | 4 | 3 |
< NZ’s migrant worker population is diverse and well educated | Survey results inform work to prevent migrant exploitation >