Overview of Māori employment outcomes in Aotearoa New Zealand
This overview provides a snapshot of key statistics indicating Māori employment outcomes in Aotearoa New Zealand.
Employment and unemployment
Source: Household labour force survey, Stats NZ, September 2021
Text description
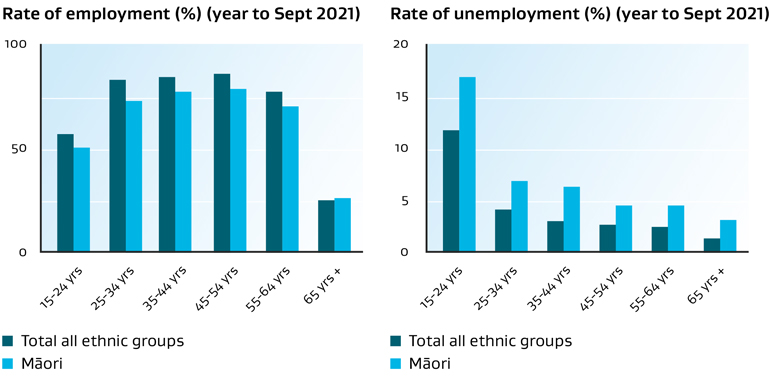
This graph compares the employment and unemployment rates for Māori with all ethnic groups (including Māori) for the year ending September 2021. The gaps between employment and unemployment rates are consistent across all age groups.
Data table:
|
Unemployment Rate (%) |
Unemployment Rate (%) |
Employment Rate (%) |
Employment Rate (%) |
| Age Group |
Māori |
Total all ethnic groups |
Māori |
Total all ethnic groups |
| Aged 15-24 |
16.9 |
11.8 |
50.3 |
56.8 |
| Aged 25-34 |
6.9 |
4.1 |
72.8 |
82.7 |
| Aged 35-44 |
6.3 |
2.9 |
77.3 |
84.6 |
| Aged 45-54 |
4.5 |
2.6 |
78.1 |
85.7 |
| Aged 55-64 |
4.5 |
2.4 |
70.4 |
77.6 |
| Aged 65 and over |
3.1 |
1.4 |
26.0 |
24.7 |
| Source: Household Labour Force Survey, StatsNZ, September 2021. |
Underutilisation in the labour market
Source: Household Labour Force Survey, StatsNZ, September 2021.
Text description
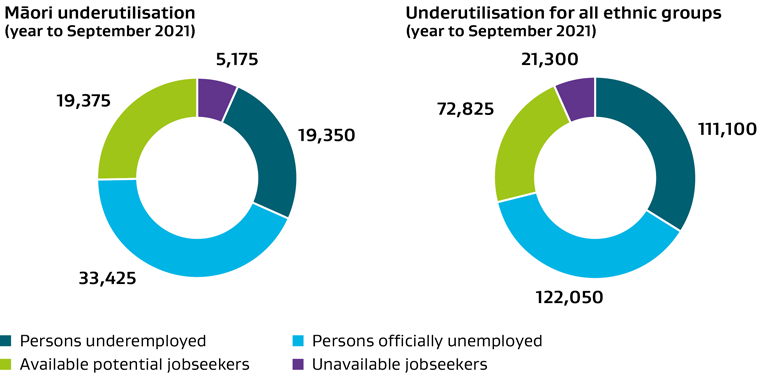
This graph compares underutilisation in the labour market for Māori with all ethnic groups (including Māori) for the year ending September 2021. Underutilisation is a broad measure of spare capacity in the labour market. Māori are more likely to be unemployed or available potential jobseekers (meaning they are able to start work but are not actively seeking a job), while other ethnicities are more likely to be underemployed (meaning they are employed in part-time but wanting more hours).
Data table:
| |
Māori |
Total all ethnic groups |
| Persons underemployed |
19,350 |
111,100 |
| Persons officially unemployed |
33,425 |
122,050 |
| Available potential jobseekers |
19,375 |
72,825 |
| Unavailable jobseekers |
5,175 |
21,300 |
| Total potential labour force |
24,550 |
94,125 |
| Source: Household Labour Force Survey, StatsNZ, September 2021. |
Employment in Māori-owned businesses
43% of employees of Māori-owned businesses are Māori
14% of employees of non Māori-owned businesses are Māori
Source: Te Matapaeroa 2019, average, with data from the Integrated Data Infrastructure (IDI) =, Longitudinal Business Database (LBD) and Linked Employer-Employee Data (LEED).
Industries
Proportion of Māori and all ethnicities employed in industries,* September 2021
* Access to the data used in this study was provided by Stats NZ under conditions designed to give effect to the security and confidentiality provisions of the Statistics Act 1975. The results presented in this study are the work of the author, not Stats NZ or individual data suppliers.
Source: Data from the Intergrated Data Infrastructure (IDI), Stats NZ, September 2021.
Industries
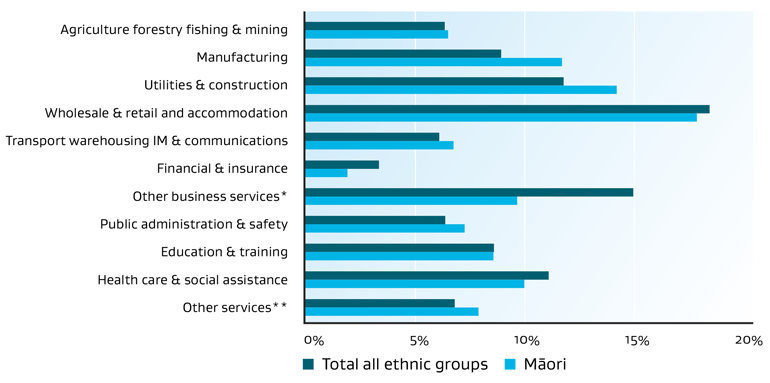
This graph shows the proportion of Māori employed in each industry. As a comparison, the graph also has the percentage of all ethnic groups (including Māori) employed in each industry. Māori are more likely to be working in manufacturing and utilities and construction. They are less likely to be working in other business services.
Data table:
| Industry |
Māori |
Total all ethnic groups |
| Agriculture, forestry, fishing and mining |
6 |
6 |
| Manufacturing |
11 |
9 |
| Utilities and construction |
14 |
11 |
| Wholesale and retail and accommodation |
17 |
18 |
| Transport, postal and warehousing and information media and telecommunications |
7 |
6 |
| Financial and insurance |
2 |
3 |
| Other business services |
9 |
15 |
| Public administration and safety |
7 |
6 |
| Education and training |
8 |
8 |
| Health care & social assistance |
10 |
11 |
| Other services |
8 |
7 |
Source: data from the Integrated Data Infrastructure (IDI), Stats NZ, September 2021.
Access to the data used in this study was provided by Stats NZ under conditions designed to give effect to the security and confidentiality provisions of the Statistics Act 1975. The results presented in this study are the work of the author, not Stats NZ or individual data suppliers. |
Occupations
Proportion of Māori and all peoples employed by occupation*, September 2021
* Access to the data used in this study was provided by Stats NZ under conditions designed to give effect to the security and confidentiality provisions of the Statistics Act 1975. The results presented in this study are the work of the author, not Stats NZ or individual data suppliers.
Source: Data from the Intergrated Data Infrastructure (IDI), Stats NZ, September 2021.
Text description
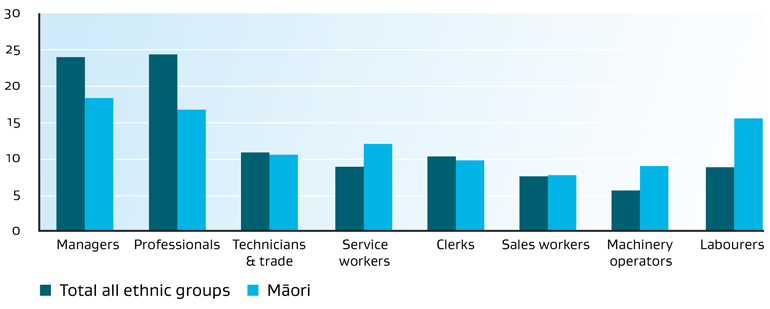
This graph shows the percentage of Māori employed in each occupational group for September 2021. As a comparison, the graph also has the percentage of all ethnic groups (including Māori) employed in each occupational group. Māori are more likely to be service workers, machinery operators and labourers. They are less likely to be managers or in the professionals occupational group.
Data table:
| Occupational group |
Māori |
Total all ethnic groups |
| Managers |
19 |
24 |
| Professionals |
17 |
24 |
| Technicians & Trade |
10 |
11 |
| Service workers |
12 |
9 |
| Clerks |
10 |
10 |
| Sales workers |
8 |
8 |
| Machinery operators |
9 |
5 |
| Labourers |
16 |
9 |
Source: data from the Integrated Data Infrastructure (IDI), Stats NZ, September 2021.
Access to the data used in this study was provided by Stats NZ under conditions designed to give effect to the security and confidentiality provisions of the Statistics Act 1975. The results presented in this study are the work of the author, not Stats NZ or individual data suppliers. |
Volunteering
| Volunteer rate |
Maori |
All ethnic groups |
| All volunteer work |
23.3% (116,000 workers) |
21.5% (834,000 workers) |
| Organisation based |
13.1% (65,000 workers) |
12.4% (480,000 workers) |
| Direct volunteer |
13.6% (68,000 workers) |
11.8% (460,000 workers) |
Source: Household Labour Force Survey, StatsNZ, June 2018, StatsNZ
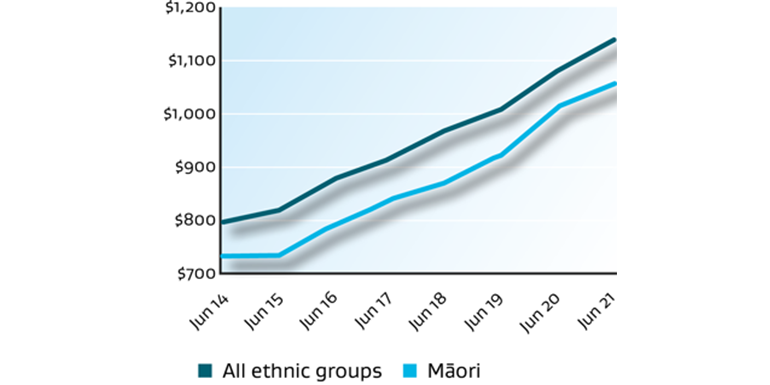
Māori incomes increased by 3.6% from June 2020 to June 2021, and by 30.1%, between June 2016 and June 2021. The median weekly income for Māori is $1,020, which is less than the median weekly income for all ethnic groups.
Source: Income Survey adjusted by the Consumer Price Index, StatsNZ, June 2021. Individual median income from the main wage and salary is used to measure income.
Text description
This graph shows how Māori incomes have increased from June 2014 to June 2021. As a comparison, it also has the increases in income for all ethnic groups (including Māori). Incomes are increasing for all groups. The gap between Māori and all ethnic groups remains steady.
Data table:
| Ethnicity |
June years |
| 2014 |
2015 |
2016 |
2017 |
2018 |
2019 |
2020 |
2021 |
| All ethnic groups |
786 |
809 |
862 |
895 |
944 |
979 |
1042 |
1093 |
| Māori |
729 |
733 |
785 |
823 |
852 |
903 |
985 |
1020 |
| Source: Income Survey adjusted by the Consumer Price Index, Stats NZ, June 2021. Individual median income from the main wage and salary is used to measure income. |
School leavers with NCEA Level 2 or above
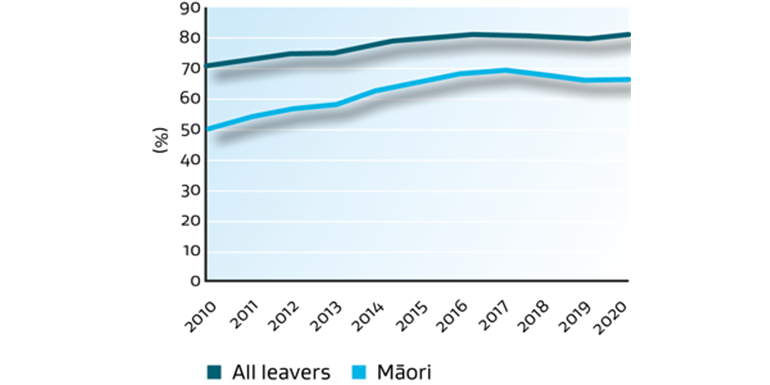
There was an increase in Māori school leavers with NCEA level 2 or above over the past 5 years to 2020 (up 1.0 percentage points) and a slight increase in the most recent year to 2020 (up 0.1 percentage points).
Source: Household Labour Force Survey, Stats NZ and Education Counts, 2010 to 2020.
Text description
This graph shows the increases in Māori school leavers with NCEA level 2 or above from 2010 to 2020. As a comparison, the graph also shows the percentage of all school leavers (including Māori school leavers) with NCEA level 2 or above over the same period. There was an increase in Māori school leavers with NCEA level 2 or above over the past five years to 2020. The gaps between Māori school leavers and all school leavers remains.
Data table:
| Ethnic group |
2010 |
2011 |
2012 |
2013 |
2014 |
2015 |
2016 |
2017 |
2018 |
2019 |
2020 |
| Māori |
49.8 |
53.0 |
56.8 |
57.7 |
62.4 |
65.1 |
68.1 |
68.9 |
67.6 |
66.0 |
66.1 |
| All Leavers |
70.2 |
72.5 |
74.8 |
74.9 |
78.2 |
79.8 |
81.0 |
81.4 |
80.6 |
79.5 |
80.8 |
| Source: Household Labour Force Survey, Stats NZ and Education Counts |
Bachelors degree or higher qualifications
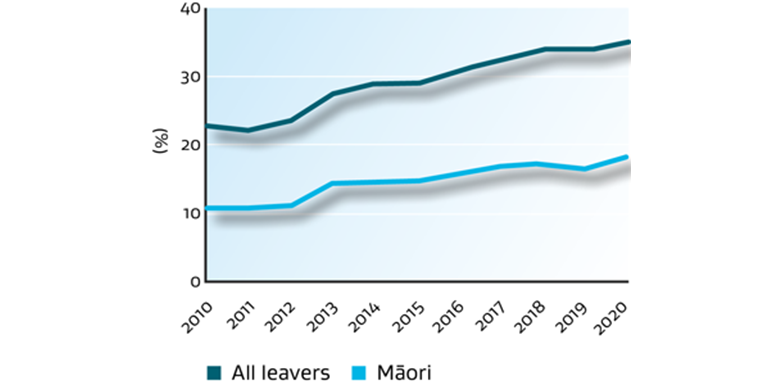
The number of Māori aged 25 to 64 years gaining a Bachelors degree or higher qualification increased by 3.3 percentage points between 2015 and 2020, but this is a smaller increase than for all ethnic groups (up 5.6pp).
Source: Household Labour Force Survey, Stats NZ, 2010 to 2020
Text description
This graph shows the increases in the percentage of Māori aged 25 to 64 years with a Bachelors degree or higher qualification from 2010 to 2020. As a comparison, the graph also shows the percentage of all school leavers (including Māori) aged 25-64 years with a Bachelors degree or higher qualification for the same period. The number of Māori aged 25 to 64 years with a Bachelors degree or higher qualification increased between 2015 and 2020, but this is a smaller increase than for all ethnic groups.
Data table:
| Ethnicity |
2010 |
2011 |
2012 |
2013 |
2014 |
2015 |
2016 |
2017 |
2018 |
2019 |
2020 |
| Māori |
11 |
11 |
11 |
15 |
15 |
15 |
16 |
17 |
17 |
17 |
18 |
| All ethnic groups |
23 |
23 |
24 |
28 |
29 |
30 |
31 |
33 |
34 |
34 |
35 |
Source: Household Labour Force Survey, Stats NZ.
Notes:
- Qualification level data prior to 2013 is not completely comparable with that from 2013 due to changes made to the qualification question in the survey in 2013.
- Values represent an average of the March, June, September and December quarters.
|