Financial commentary
This section of the annual report provides a commentary on MBIE’s 2021/22 financial results and a view of our forecast financial plans for 2022/23.
On this page
This commentary compares financial performance for the year with:
- The previous financial year, 2020/21
- The 2021/22 budget set in May 2021 as part of the Government’s Budget. This is referred to as Unaudited Budget
- The 2022/23 budget set in May 2022 as part of the Government’s Budget. This is referred to as Unaudited Forecast
Information is also provided in this commentary on non-departmental operations, where MBIE administer activities on behalf of the Crown.
2021/22 departmental results
MBIE’s 2021/22 departmental activities are funded through 52 appropriations across 3 votes. In 2021/22 our revenue was $1,230 million and our expenditure $1,261 million. Across all our departmental activities we have incurred a net deficit of $31 million (2021: $61 million).
Crown revenue has increased from the prior year, largely due to funding the on-going COVID-19 and future pandemic response, namely the future of MIQ and the resettlement of Afghan nationals. Third party revenue has slowly started to increase in the financial year, aligning with the staged re-opening of the New Zealand border from February 2022 onwards, and is expected to grow with borders fully re-opening to the rest of the world, contributing to the improvement in MBIE’s prior year net deficit.
2021/22 operating results
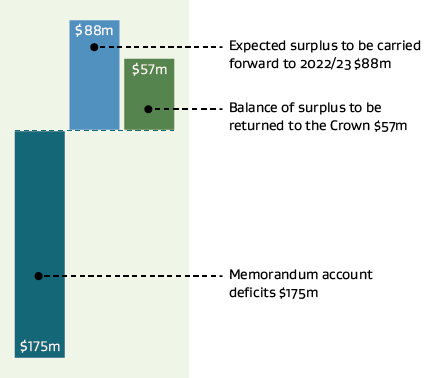
For activities that have been funded from the Crown, we have a surplus of $145 million. A significant amount of this surplus is expected to be carried forward to the next financial year to match the timing of the activities which have also rolled over into 2022/23. Some surplus is expected because appropriations are treated as upper limits and spending is therefore likely to be less than those limits.
Just under a quarter of MBIE’s revenue is third party revenue reported through our memorandum accounts. Across our memorandum accounts in 2021/22, we incurred a net deficit of $175 million. This is mainly due to lower levels of immigration visa fees with the tighter border restrictions in place for COVID-19 control. This decline was not matched with corresponding movements in expenditure which are relatively fixed in nature.
Text version of 2021/22 operating results chart
The money we receive to fund our departmental operations
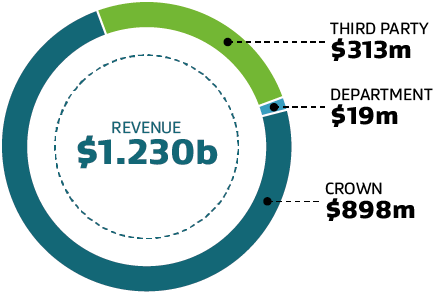
MBIE receives funding to deliver services and functions on behalf of the Government. The majority of our funding comes from the Crown and from fees and levies charged to third parties for our services.
Text version of the money we receive to fund our departmental operations
| Actual 2018 $000 |
Actual 2019 $000 |
Actual 2020 $000 |
Actual 2021 $000 |
Actual 2022 $000 |
Unaudited Budget 2022 $000 |
Unaudited Forecasts 2023 $000 |
|
|---|---|---|---|---|---|---|---|
| Crown revenue | 365,888 | 404,190 | 461,548 | 735,937 | 897,618 | 782,869 | 942,720 |
| Third party revenue | 376,501 | 408,472 | 408,399 | 287,965 | 313,538 | 292,598 | 404,366 |
| Department revenue | 14,533 | 25,502 | 16,696 | 19,959 | 18,807 | 30,659 | 23,793 |
| Total revenue | 756,922 | 838,164 | 886,643 | 1,043,861 | 1,229,963 | 1,106,126 | 1,370,879 |
In 2021/22 our departmental revenue was $186 million more than 2020/21 and $124 million higher than the 2021/22 Budget.
Crown revenue was $162 million more than 2020/21 and $115 million higher than 2021/22 Budget. New funding was provided, and existing funding moved from MBIE’s non-departmental operations to support the quarantine and isolation arrangements and to determine the future of New Zealand’s response to the on-going COVID-19 as well as potential future pandemics. Additional funding was also provided to the settlement and integration of refugees and other migrants, the fair pay agreement system, as well as additional funding for policy advice and related services.
Third party and department revenue was $24 million more than 2020/21 and $8 million higher than the 2021/22 Budget. The increase from 2020/21 was due to the uptake in immigration services as a result of the staged re- opening of the New Zealand border from February 2022 onwards, and is expected to grow with borders fully re-opening to the rest of the world.

Text version of revenue sources by year chart
How we spent the funding we received for our departmental operations
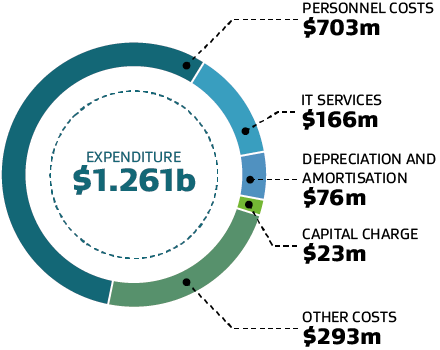
Almost two thirds of our total costs relate to personnel costs and IT services.
Text version of how we spent the funding for our departmental operations
| Actual 2018 $000 |
Actual 2019 $000 |
Actual 2020 $000 |
Actual 2021 $000 |
Actual 2022 $000 |
Unaudited Budget 2022 $000 |
Unaudited Forecasts 2023 $000 |
|
|---|---|---|---|---|---|---|---|
| Personnel costs | 433,634 | 456,787 | 540,255 | 590,455 | 703,127 | 776,908 | 724,752 |
| IT costs | 98,222 | 115,806 | 136,590 | 142,902 | 166,243 | 184,218 | 192,253 |
| Depreciation, amortisation and impairment | 45,264 | 50,490 | 54,822 | 86,116 | 75,720 | 65,052 | 53,215 |
| Capital charge | 12,566 | 16,580 | 20,418 | 23,258 | 23,216 | 20,373 | 26,478 |
| Other operating costs | 160,839 | 174,542 | 178,826 | 262,222 | 292,726 | 234,118 | 328,795 |
| Total expenditure | 750,525 | 814,205 | 930,911 | 1,104,953 | 1,261,032 | 1,280,669 | 1,325,493 |
In 2021/22 we spent $1,261 million as a department, $156 million more than 2020/21 and $20 million lower than the 2021/22 Budget. This is mainly due to the costs related to MIQ operational support, including personnel and security costs.
Depreciation, amortisation, and impairment is $10 million less than 2020/21 at $76 million, due to the change in the accounting policy for Software-as-a-Service (“SaaS”) arrangements resulting from the implementation of agenda decisions issued by the International Financial Reporting Interpretations Committee clarifying its interpretation of how current accounting standards apply. The change in the accounting policy was applied retrospectively, effectively reducing the amount of intangible assets subject to amortisation in 2021/22.
The memorandum accounts we administer
| Actual 2018 $000 |
Actual 2019 $000 |
Actual 2020 $000 |
Actual 2021 $000 |
Actual 2022 $000 |
Unaudited Budget 2022 $000 |
Unaudited Forecasts 2023 $000 |
|
|---|---|---|---|---|---|---|---|
| Immigration visa | (45,724) | (65,123) | (127,137) | (79,226) | (182,823) | (210,083) | (271,993) |
| Building controls | 43,015 | 55,548 | 56,327 | 57,019 | 66,184 | 49,647 | 58,901 |
| Registration and granting of intellectual property rights | 29,804 | 31,181 | 30,060 | 28,762 | 26,510 | 19,212 | 15,272 |
| Other memorandum accounts | 41,623 | 45,645 | 32,806 | 36,800 | 25,450 | (1,437) | (10,111) |
| Memorandum account balance at 30 June | 68,718 | 67,251 | (7,944) | 43,355 | (64,679) | (142,661) | (207,931) |
Memorandum accounts record the cumulative surplus or deficit of MBIE services that are intended to be fully cost recovered from third parties through fees, levies or other charges. Memorandum accounts provide transparency around these services, and in the long term, the balance of each memorandum account is expected to trend towards zero.
In 2021/22 MBIE administered 14 (2020/21: 14) memorandum accounts.
The overall memorandum account balance at 30 June 2022 was a $65 million deficit, decreasing by $108 million from the prior year. The year’s deficit was mainly due to the $168 million (2020/21: $172 million) deficit in the immigration visa memorandum account reflecting the impact of COVID-19 related border restrictions on revenue. However, with the staged re-opening of the New Zealand border from February 2022 onwards, revenue is expected to grow.
The overall deficit includes $67 million of capital injections to the immigration- related memorandum accounts to bring the account balances back to pre-COVID-19 levels as at 29 February 2020.
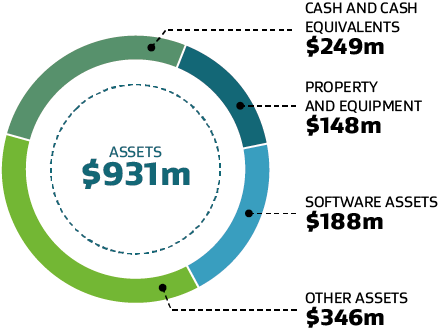
The departmental assets we manage to support our operations
Text version of the departmental assets we manage to support our operations
| Actual 2018 $000 |
Actual 2019 $000 |
Actual 2020 $000 |
Actual 2021 $000 |
Actual 2022 $000 |
Unaudited Budget 2022 $000 |
Unaudited Forecasts 2023 $000 |
|
|---|---|---|---|---|---|---|---|
| Cash and cash equivalents | 97,171 | 115,285 | 140,710 | 178,512 | 249,284 | 107,762 | 120,596 |
| Property and equipment | 96,710 | 110,977 | 134,941 | 139,475 | 147,396 | 171,969 | 147,154 |
| Software assets | 203,189 | 216,880 | 233,329 | 191,603 | 188,191 | 246,002 | 107,005 |
| Other assets | 106,821 | 111,480 | 83,362 | 237,287 | 345,769 | 100,031 | 387,287 |
| Total assets | 503,891 | 554,622 | 592,342 | 746,877 | 930,640 | 625,764 | 762,042 |
| Capital Expenditure | 71,269 | 74,484 | 98,562 | 78,206 | 77,658 | 81,252 | 72,978 |
MBIE manages $931 million of departmental assets. Software assets and property and equipment represent almost half of our assets. Software assets are the systems used to support the operation of MBIE and the services provided. Most of the software is developed internally rather than purchased. Our property and equipment are the land, buildings, leasehold improvements, furniture and fittings, vehicles and computer hardware we use in our daily operations. Most of the other assets we control relate to debtors and other receivables due to us.
In 2021/22 our software assets decreased by $34 million compared to 2020/21 and was $58 million lower than the 2021/22 Budget due to the change in the accounting policy for Software-as-a-Service (“SaaS”) arrangements. Please refer to note 2 and 9 of the departmental financial statements for additional details.
Cash and cash equivalents are $71 million higher than the prior year and $142 million higher than the 2021/22 Budget due to the timing of returning unused cash back to the Crown. This is reflected in the increase in other assets which is mainly due to Crown funding not yet drawn down. Due to holding sufficient cash, reductions in discretionary expenditure and timing of expenditure, less funds have been required to be drawn down.
The non-departmental revenue we received on behalf of the Crown
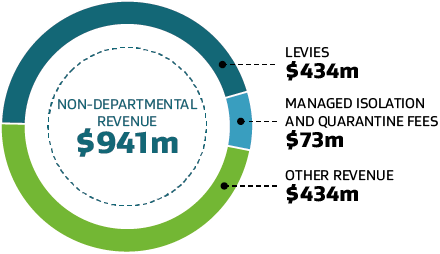
Text version of the non-departmental revenue we received on behalf of the Crown
| Actual 2018 $000 |
Actual 2019 $000 |
Actual 2020 $000 |
Actual 2021 $000 |
Actual 2022 $000 |
Unaudited Budget 2022 $000 |
Unaudited Forecasts 2023 $000 |
|
|---|---|---|---|---|---|---|---|
| Levies | 332,316 | 459,719 | 374,444 | 348,155 | 434,069 | 418,507 | 451,937 |
| Managed Isolation and Quarantine fees | - | - | - | 123,812 | 72,658 | 68,511 | - |
| Other revenue | 331,801 | 357,188 | 300,965 | 273,435 | 434,016 | 334,091 | 252,603 |
| Total non-departmental revenue | 664,117 | 816,907 | 675,409 | 745,402 | 940,743 | 821,109 | 704,540 |
Non-departmental revenue for 2021/22 was $195 million more than 2020/21 and $120 million higher than the 2021/22 Budget. Levies are higher compared to 2020/21 due to increased Health and Safety at work levies and Immigration and Migrant levies. Other revenue is higher than both 2020/21 and the 2021/22 Budget mainly due to large one-off receipts of Criminal proceeds (recovery) during 2021/22.
The non-departmental expenditure we administer on behalf of the Crown
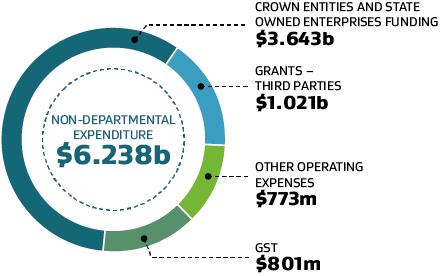
MBIE administers non-departmental activities on behalf of the Crown via 137 non-departmental appropriations. Funding is distributed to third parties, state- owned enterprises and Crown entities to support their operations and the grants they administer.
Text version of the non-departmental expenditure we administer on behalf of the crown
| Actual 2018 $000 |
Actual 2019 $000 |
Actual 2020 $000 |
Actual 2021 $000 |
Actual 2022 $000 |
Unaudited Budget 2022 $000 |
Unaudited Forecasts 2023 $000 |
|
|---|---|---|---|---|---|---|---|
| Grants and operating expenses – Crown entities and state-owned enterprises | 2,780,254 | 2,927,341 | 3,179,681 | 3,814,852 | 3,642,609 | 3,612,951 | 3,825,364 |
| Grants – third parties | 471,464 | 584,986 | 771,504 | 1,302,717 | 1,021,509 | 1,529,382 | 1,143,911 |
| Other operating expenses | 96,542 | 272,182 | 251,783 | 811,928 | 772,552 | 1,118,217 | 389,647 |
| GST | 466,018 | 501,378 | 586,383 | 822,527 | 800,909 | 596,369 | 723,454 |
| Total non-departmental expenditure | 3,814,278 | 4,285,887 | 4,789,351 | 6,752,024 | 6,237,579 | 6,856,919 | 6,082,376 |
Our non-departmental expenditure was $514 million lower than 2020/21 and $619m lower that the 2021/22 Budget, which is largely due to expenditure related to recognising the costs for the decommissioning of the Tui oil field as a provision in 2020/21 which was offset by increased expenditure for the delivery of MIQ.
The drop in grant expenditure is due to one-off funding in 2020/21 for COVID-19 related appropriations in the tourism sector, research and supporting regional sectors.