Financial commentary
This section of the annual report provides a commentary on MBIE’s 2019/20 financial results, including the impact of COVID-19, and a view of our forecast financial plans for 2020/21.
On this page I tēnei whārangi
This commentary compares financial performance for the year with:
- The previous financial year, 2018/19
- The 2019/20 budget set in May 2019 as part of the Government’s Budget. This is referred to as Main Estimates
- The 2020/21 budget set in May 2020 as part of the Government’s Budget. This is referred to as Forecast
Information is also provided in this commentary on non-departmental operations, where MBIE administer activities on behalf of the Crown.
2019/20 departmental results
MBIE’s 2019/20 departmental activities are funded through 41 appropriations across 16 ministerial portfolios. In 2019/20 our revenue was $886.643 million and our expenditure $930.911 million. Across all our departmental activities we incurred a net deficit of $44.268 million.
The deficit was largely driven by a significant fall in third party revenue at the end of the year as the border closures resulted in a sudden fall in visa fees. The following table breaks down this deficit by source of funding:
2019/20 operating results
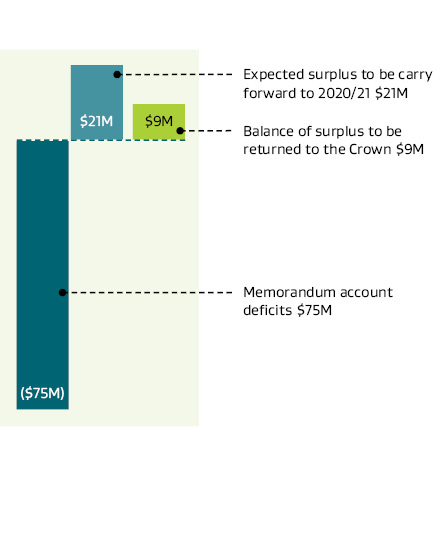
For activities that have been funded from the Crown, we have a surplus of $30.175 million. $21.164 million of this surplus is expected to be carried forward to the next financial year to match the timing of the activities which have also rolled over into 2020/21. An element of the Crown revenue surplus generated is due to our obligation in the Public Finance Act 1989 to manage our budgets and not spend above our appropriated funding.
About half of MBIE's revenue is third party revenue reported through our memorandum accounts. Across our memorandum accounts in 2019/20 we incurred a net deficit of $75.195 million. This was due to a reduction in the last quarter of the year, particularly immigration visa fees as the border closed which were not matched by a corresponding fall in expenses which are relatively fixed.
Text version of 2019/20 operating results chart
Discussion on the impact of COVID-19 on the coming financial year can be found in the PDF version of this annual report.
The money we receive to fund our departmental operations
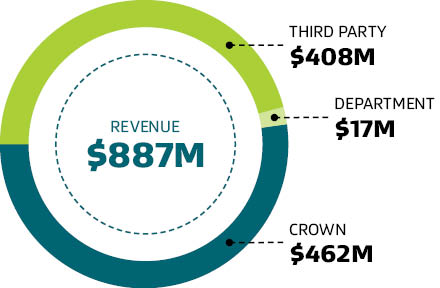
MBIE receives funding to deliver services and functions on behalf of the Government. The majority of our funding comes from the Crown and from fees and levies charged to third parties for our services.
Text version of the money we receive to fund our departmental operations
| Actual 2016 $000 |
Actual 2017 $000 |
Actual 2018 $000 |
Actual 2019 $000 |
Actual 2020 $000 |
Unaudited Main Estimates 2020 $000 |
Unaudited Forecast 2021 $000 |
|
|---|---|---|---|---|---|---|---|
| Crown revenue | 302,461 | 328,998 | 365,888 | 404,190 | 461,548 | 384,659 | 476,390 |
| Third party revenue | 368,833 | 370,537 | 376,501 | 408,472 | 408,399 | 401,845 | 198,302 |
| Department revenue | 7,386 | 8,148 | 14,533 | 25,502 | 16,696 | 19,709 | 27,689 |
| Total revenue | 678,680 | 707,683 | 756,922 | 838,164 | 886,643 | 806,213 | 702,381 |
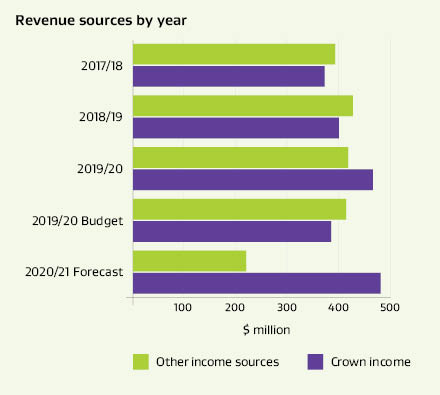
In 2019/20 our departmental revenue was $886.643 million, $48.479 million more than 2018/19 and $80.430 million higher than the 2019/20 Main Estimates.
Crown revenue was $57.358 million more than 2018/19 and $76.889 million higher than 2019/20 Main Estimates. New funding was provided for a broad range of programmes with the highest proportion going towards the operations of the PDU ($37.739 million), the new remuneration framework ($7.000 million) and funding for the Electronic Travel Authority work visa reforms ($3.649 million).
Third party and department revenue was $425.095 million in 2019/20, $8.879 million less than 2018/19 and $3.541 million higher than the 2019/20 Main Estimates. A significant amount of this revenue relates to visa applications. This reduction from 2018/19 was due to the drop in third party revenue in the last quarter of the year. This decline in revenue is expected to continue with only $225.991 million of other revenue forecast for 2020/21.
How we spent the funding we received for our departmental operations
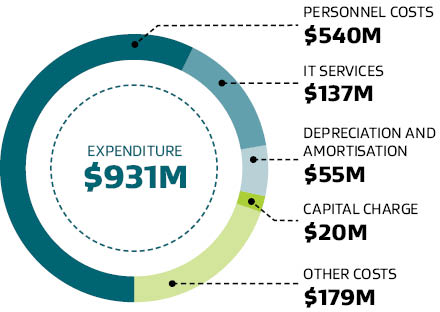
Over two thirds of our total costs relate to personnel costs and IT services.
Text version of how we spent the funding for our departmental operations
| Actual 2016 $000 |
Actual 2017 $000 |
Actual 2018 $000 |
Actual 2019 $000 |
Actual 2020 $000 |
Unaudited Main Estimates 2020 $000 |
Unaudited Forecast 2021 $000 |
|
|---|---|---|---|---|---|---|---|
| Personnel costs | 321,657 | 399,971 | 433,634 | 456,787 | 540,255 | 460,731 | 519,315 |
| IT costs | 111,956 | 94,310 | 98,222 | 115,806 | 136,590 | 109,649 | 126,532 |
| Depreciation, amortisation and impairment | 32,689 | 40,541 | 45,264 | 50,490 | 54,822 | 48,208 | 57,785 |
| Capital charge | 16,122 | 14,095 | 12,566 | 16,580 | 20,418 | 20,082 | 24,748 |
| Other operating costs | 136,228 | 145,631 | 160,839 | 174,542 | 178,826 | 167,543 | 201,969 |
| Total expenditure | 618,652 | 694,548 | 750,525 | 814,205 | 930,911 | 806,213 | 930,349 |
In 2019/20 we spent $930.911 million as a department, $116.706 million more than 2018/19 and $124.698 million higher than the 2019/20 Main Estimates. This increase is mainly due to the costs incurred for the additional activities from increased funding as discussed above. Plus as third party revenue has not increased as expected, the fixed cost nature of these activities means that there has not been a corresponding fall in expenditure. While MBIE did incur some additional departmental costs in addressing the impact of COVID-19 (e.g. IT support and related costs to support working from home arrangements during the lockdown) these costs were not significant. MBIE’s overall response to COVID-19 is discussed in detail in MBIE's COVID response.
The memorandum accounts we administer
| Actual 2016 $000 |
Actual 2017 $000 |
Actual 2018 $000 |
Actual 2019 $000 |
Actual 2020 $000 |
Unaudited Main Estimates 2020 $000 |
Unaudited Forecast 2021 $000 |
|
|---|---|---|---|---|---|---|---|
| Immigration visa | (4,697) | (11,709) | (45,724) | (65,123) | (127,137) | (43,432) | (115,490) |
| Building controls | 25,288 | 32,010 | 43,015 | 55,548 | 56,327 | 55,841 | 58,386 |
| Registration and granting of intellectual property rights | 22,389 | 27,510 | 29,804 | 31,181 | 30,060 | 33,110 | 31,857 |
| Other memorandum accounts | 20,604 | 34,925 | 41,623 | 45,645 | 32,806 | 46,193 | 20,355 |
| Memorandum account balance at 30 June | 63,584 | 82,736 | 68,718 | 67,251 | (7,944) | 91,712 | (4,892) |
Memorandum accounts record the cumulative surplus or deficit of MBIE services that are intended to be fully cost recovered from third parties through fees, levies or other charges. Memorandum accounts provide transparency around these services, and in the long term, the balance of each memorandum account is expected to trend towards zero.
In 2019/20 MBIE administered 15 (2018/19: 14) memorandum accounts. MBIE introduced the Electronic Travel Authority memorandum account during 2019/20. This programme screens travellers for border and immigration risks while making the border entry as seamless as possible. It is funded by fees paid by international visitors.
The overall memorandum account balance at 30 June 2020 was a $7.944 million deficit, decreasing by $75.195 million from the prior year. This decline was mainly due to this year’s $62.014 million (2018/19: $19.399 million) deficit in the Immigration visa memorandum account reflecting the impact of COVID-19 related border restrictions and fixed costs not correspondingly decreasing.
The departmental assets we manage to support our operations
Text version of the departmental assets we manage to support our operations
| Actual 2016 $000 |
Actual 2017 $000 |
Actual 2018 $000 |
Actual 2019 $000 |
Actual 2020 $000 |
Unaudited Main Estimates 2020 $000 |
Unaudited Forecast 2021 $000 |
|
|---|---|---|---|---|---|---|---|
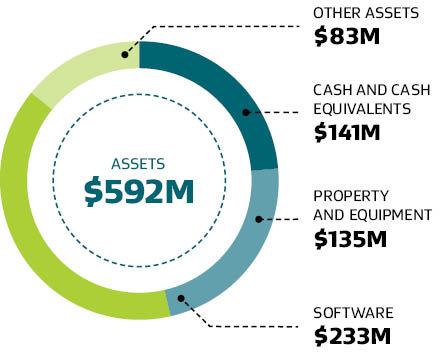
| Cash and cash equivalents | 61,480 | 61,362 | 27,342 | 97,171 | 115,285 | 48,493 | 51,776 |
| Property and equipment | 52,042 | 69,668 | 88,463 | 96,710 | 110,977 | 99,153 | 134,377 |
| Software assets | 146,461 | 168,466 | 185,349 | 203,189 | 216,880 | 230,780 | 229,349 |
| Other assets | 81,960 | 118,627 | 105,079 | 106,821 | 111,480 | 88,742 | 127,755 |
| Total assets | 341,943 | 418,123 | 406,233 | 503,891 | 554,622 | 467,168 | 543,257 |
| Capital Expenditure | 68,636 | 68,334 | 76,999 | 71,269 | 74,484 | 68,728 | 81,252 |
MBIE manages $592.342 million of departmental assets. Software assets and property and equipment represent over half of our assets. The software assets are the systems run to support the operation of MBIE and the services provided. Most of the software is developed internally rather than purchased. Our property and equipment are the land, buildings, leasehold improvements, furniture and fittings, vehicles and computer hardware we use in our daily operations. Most of the other assets we control relate to debtors and other receivables due to us.
In 2019/20 our capital expenditure increased by $24.078 million compared to the prior year and was $17.310 million higher than the 2019/20 Main Estimates. This increase is largely due to the work carried out in relation to the new leased cross-government office space in Pastoral House, and the development of MBIE’s new payroll system. MBIE forecast it will spend $18.535 million less in 2020/21 than in 2019/20, with the completion of the Pastoral House project.
Cash and cash equivalents and other assets are $2.693 million lower than the prior year and $44.541 million higher than the 2019/20 Mains Estimates. The increase from the Main Estimates reflects the cash injection secured to ensure liquidity was maintained despite the fall in cash receipts due to the impact of COVID-19, particularly immigration visa fees. Our 2021 forecast a decrease in cash and cash equivalents balances due to these reduced cash receipts. However, capital injections from the Government have been secured to ensure MBIE is able to meet its obligations as they fall due.
The non-departmental expenditure we administer on behalf of the crown
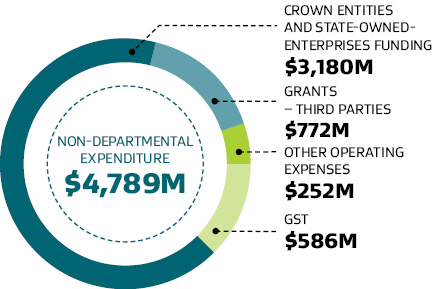
MBIE administers non-departmental activities on behalf of the Crown via 102 non-departmental appropriations. Funding is distributed to third-parties, state-owned enterprises and 26 Crown entities to support their operations and the grants they administer.
Text version of the non-departmental expenditure we administer on behalf of the Crown
| Actual 2016 $000 |
Actual 2017 $000 |
Actual 2018 $000 |
Actual 2019 $000 |
Actual 2020 $000 |
Unaudited Main Estimates 2020 $000 |
Unaudited Forecast 2021 $000 |
|
|---|---|---|---|---|---|---|---|
| Crown entities and state-owned enterprises funding | 2,420,151 | 2,608,988 | 2,780,254 | 2,927,341 | 3,179,681 | 3,147,923 | 3,462,997 |
| Grants – third parties | 407,886 | 411,331 | 471,464 | 584,986 | 771,504 | 1,422,699 | 775,606 |
| Other operating expenses | 65,457 | 93,520 | 96,542 | 272,182 | 251,783 | 473,981 | 178,948 |
| GST | 394,806 | 422,218 | 466,018 | 501,378 | 586,383 | 646,896 | 596,369 |
| Total non-departmental expenditure | 3,288,300 | 3,536,057 | 3,814,278 | 4,285,887 | 4,789,351 | 5,691,499 | 5,013,920 |
Non-departmental revenue for 2019/20 was $675.409 million, $141.498 million less than 2018/19, and $57.720 million higher than the 2019/20 Main Estimates. The higher revenue than the 2019/20 Main Estimates is mainly due to higher than forecast Crown mineral royalties, offset by less than expected Electronic Travel Authority levies due to the COVID-19 related border closure.
Our non-departmental expenditure was $902.148 million lower than the 2019/20 Main Estimates which is largely attributable to timing differences in the PGF grants we administer. When the Main Estimates were set, the form and timing of PGF grants was unknown. As the fund is making milestone grant payments later than initially forecast, there were fewer payments in the financial year.
The later timing of PGF grants was partially offset by the provision for costs associated with the decommissioning of an oil field ($151.841 million) and increased costs that were incurred in response to the COVID-19 pandemic including:
- $8.037 million for temporary accommodation services provided to those who needed assistance to self-isolate
- $11.000 million for addressing the impacts on the tourism sector
- $89.350 million for the Worker Redeployment programme
- $45.100 million of funding for Crown Research Institutes to cover shortfalls in commercial revenue
- $25.000 million to support small and medium sized enterprises.
Updated forecast for the pre-election economic and fiscal update
The Unaudited Main Forecast 2021 was approved on 15 April 2020 by the Chief Executive and incorporated the financial implications of the early decisions made in responding to the COVID-19 pandemic. Since that time, additional workstreams focusing on the recovery and rebuild phase of the COVID-19 response have been funded by the COVID-19 Response and Recovery Fund (CRRF). The Pre-election Economic and Fiscal Update (PREFU) was published by the Treasury on 16 September 2020 and has incorporated these and other decisions with financial implications up to 20 July 2020.
There remains considerable uncertainty in relation to these forecasts, particularly the ongoing impact on MBIE’s third party revenue. In addition, the costs associated with operating the Managed Isolation and Quarantine (MIQ) programme have not yet been fully incorporated into MBIE’s baselines.
Departmental
| Net (deficit) | (121,138) | (227,968) |
| Unaudited PREFU Forecast 2021 $000 |
Unaudited Main Forecast 2021 $000 |
|
|---|---|---|
| Revenue | ||
| Crown revenue | 570,558 | 476,390 |
| Third party revenue | 313,013 | 198,302 |
| Department revenue | 15,233 | 27,689 |
| Total revenue | 898,804 | 702,381 |
| Expenditure | ||
| Personnel costs | 587,894 | 519,315 |
| Operating costs | 349,222 | 328,501 |
| Other costs | 82,826 | 82,533 |
| Total expenditure | 1,019,942 | 930,349 |
| Unaudited PREFU Forecast 2021 $000 |
Unaudited Main Forecast 2021 $000 |
|
|---|---|---|
| Assets | ||
| Cash and cash equivalents | 114,548 | – |
| Debtors and other receivables | 79,579 | 117,277 |
| Property and equipment and intangible assets | 387,664 | 389,200 |
| Total assets | 581,791 | 506,477 |
| Liabilities | ||
| Cash and cash equivalents | – | 143,663 |
| Creditors and other payables | 111,962 | 78,387 |
| Employee entitlements | 46,310 | 42,294 |
| Provisions | 10,717 | 12,314 |
| Total liabilities | 168,989 | 276,658 |
| Net Assets | 412,802 | 229,819 |
The recent PREFU forecasts revenue in 2020/21 to be $196.423 million more than the Main Forecast. This is a result of an increase in Crown funding of $93.818 million provided in response to the impacts of COVID-19 and a revised impact on estimated third party revenue including the impact of border closures on Immigration Services upward by around $138 million. In line with the increase in Crown funding, MBIE’s departmental 2020/21 expenses are expected to increase by $89.031 million compared to 2019/20.
The increase in funding, and associated costs mainly come from:
- $20.000 million for initial operational support of the MIQ programme
- $11.500 million for 15 regional skills leadership groups to facilitate local dialogue to ascertain regional labour market needs, and develop Regional Workforce Plans
- $23.700 million for additional policy advice and support to ministers
- $9.800 million for employment relation services
- $7.300 million for a job and skills hub.
An operating deficit of $121.138 million was forecast in the PREFU as a result of expected increased third party revenue, primarily for immigration visas and Electronic Travel Authority.
The 2020/21 PREFU forecasts include approved capital injections that have been given to support MBIE's liquidity.
Non-departmental
| Unaudited PREFU Forecast 2021 $000 |
Unaudited Main Forecast 2021 $000 |
|
|---|---|---|
| Non-departmental revenue | 582,154 | 597,844 |
| Non-departmental expenditure | ||
| Grants and operating expenses – Crown entities and state-owned enterprises | 3,807,686 | 3,462,997 |
| Grants – third parties | 1,403,853 | 775,606 |
| Other expenses | 323,685 | 178,948 |
| GST | 747,268 | 596,369 |
| Total non-departmental expenditure | 6,282,492 | 5,013,920 |
The 2020/21 PREFU forecasts a reduction in non-departmental revenue of $93.255 million compared to 2019/20, largely attributable to the reduction in International Visitor Conservation and Tourism levies which have declined while the border is closed.
Non-departmental expenses are forecast to increase by $1,268.572 million in the PREFU. The increase in expenditure for 2020/21 is mainly due to costs responding to COVID-19, including:
- $100.000 million for the MIQ programme which was transferred to MBIE in 2020/21
- $105.000 million for the Strategic Tourism Assets Protection programme
- $300.000 million for delivering the 'Shovel Ready' infrastructure projects
- $129.845 million for provision of support to the research and development sector and facilitating the science sector’s response to COVID-19, in particular the development of a vaccine strategy
- $29.500 million for Regional Skills Leadership Groups and Māori apprenticeship programmes
- $40.000 million for NZTE support services for small businesses
- $231.908 million for other initiatives responding to COVID-19.
The remaining $332.319 million relates to additional GST expenditure and other appropriation changes that were not attributable to the COVID-19 response and were primarily the result of transferring underspent funding from 2019/20 into 2020/21.

