Financial commentary
This section of the annual report provides a commentary on MBIE’s 2020/21 financial results and a view of our forecast financial plans for 2021/22.
On this page
This commentary compares financial performance for the year with:
- The previous financial year, 2019/20
- The 2020/21 budget set in May 2020 as part of the Government’s Budget. This is referred to as Main Estimates
- The 2021/22 budget set in May 2021 as part of the Government’s Budget. This is referred to as Forecast
Information is also provided in this commentary on non-departmental operations, where MBIE administer activities on behalf of the Crown.
2020/21 departmental results
MBIE’s 2020/21 departmental activities are funded through 48 appropriations across 17 Ministerial portfolios. In 2020/21 our revenue was $1,044 million and our expenditure was $1,095 million. Across all our departmental activities we have incurred a net deficit of $51 million (2020: $44 million).
Third-party revenue decreased significantly from the previous financial year due to COVID-19 border restrictions resulting in immigration visa fees reducing by $109 million. Border restrictions were introduced in March 2020 and with limited variations, the collection of visa fees has dramatically decreased from the prior year. Though this was countered by increased Crown revenue to support the Government’s COVID-19 response and reduced discretionary expenditure, the deficit has increased from the prior year. This is mainly due to accelerated amortisation of Immigration New Zealand’s Immigration Global Management System, which will be replaced in the 2021/22 financial year (see the section ‘How we spent the funding’ for more details).
2020/21 operating results
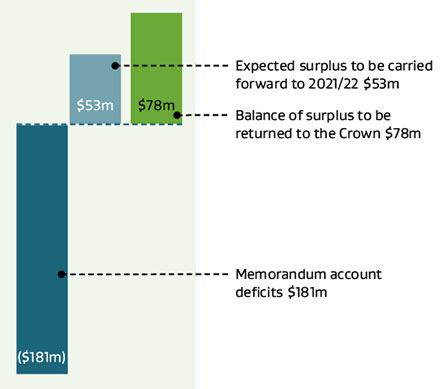
For activities that have been funded from the Crown, we have a surplus of $131 million. A significant amount of this surplus is expected to be carried forward to the next financial year to match the timing of expenditure that has rolled over into 2021/22. Some surplus is expected because appropriations are treated as upper limits and spending is therefore likely to be less than those limits.
About a quarter of MBIE’s revenue is third-party revenue reported through our memorandum accounts. Across our memorandum accounts in 2020/21, we incurred a net deficit of $181 million. This is mainly due to a 56% drop in immigration visa fees with the tighter border restrictions in place for COVID-19 control. This decline was not matched with corresponding reductions in expenditure which are relatively fixed in nature.
Text version of 2020/21 operating results chart
The money we receive to fund our departmental operations
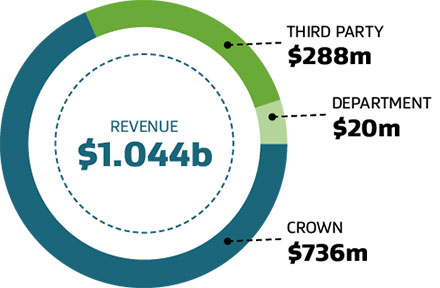
MBIE receives funding to deliver services and functions on behalf of the Government. The majority of our funding comes from the Crown and from fees and levies charged to third parties for our services.
Text version of the money we receive to fund our departmental operations
| Actual 2017 $000 |
Actual 2018 $000 |
Actual 2019 $000 |
Actual 2020 $000 |
Actual 2021 $000 |
Unaudited Main Estimates 2021 $000 |
Unaudited Forecast 2022 $000 |
|
|---|---|---|---|---|---|---|---|
| Crown revenue | 328,998 | 365,888 | 404,190 | 461,548 | 735,937 | 476,390 | 782,869 |
| Third party revenue | 370,537 | 376,501 | 408,472 | 408,399 | 287,965 | 198,302 | 292,598 |
| Department revenue | 8,148 | 14,533 | 25,502 | 16,696 | 19,959 | 27,689 | 30,659 |
| Total revenue | 707,683 | 756,922 | 838,164 | 886,643 | 1,043,861 | 702,381 | 1,106,126 |
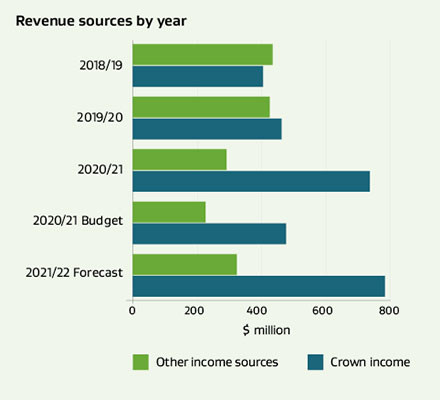
In 2020/21 our departmental revenue was $1,044 million, $157 million more than 2019/20 and $341 million higher than the 2020/21 Main Estimates.
Crown revenue was $274 million more than 2019/20 and $260 million higher than 2020/21 Main Estimates. New funding was provided to support the quarantine and isolation arrangements required in response to COVID-19 ($169 million). Additional funding was also provided to the employer-assisted work visa system policy project, the settlement and integration of refugees and other migrants, and the Regional Skills Leadership Group, as well as additional funding for policy advice and related services.
Third-party and department revenue was $308 million in 2020/21, $117 million less than 2019/20 and $82 million higher than the 2020/21 Main Estimates. The reduction from 2019/20 is mainly due to the reduction in visa applications resulting from the constraints on international travel caused by COVID-19. This decline in revenue is expected to continue with only $323 million of non-Crown revenue forecast for 2021/22.
How we spent the funding we received for our departmental operations
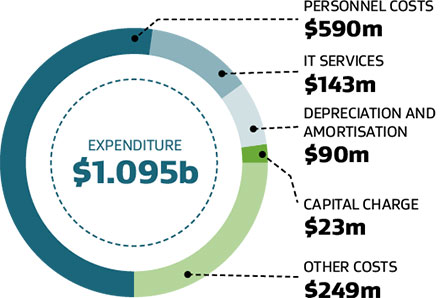
Almost two-thirds of our total costs relate to personnel costs and IT services.
Text version of how we spent the funding for our departmental operations
| Actual 2017 $000 |
Actual 2018 $000 |
Actual 2019 $000 |
Actual 2020 $000 |
Actual 2021 $000 |
Unaudited Main Estimates 2021 $000 |
Unaudited Forecast 2022 $000 |
|
|---|---|---|---|---|---|---|---|
| Personnel costs | 399,971 | 433,634 | 456,787 | 540,255 | 590,455 | 519,315 | 776,908 |
| IT costs | 94,310 | 98,222 | 115,806 | 136,590 | 142,902 | 126,532 | 184,218 |
| Depreciation, amortisation and impairment | 40,541 | 45,264 | 50,490 | 54,822 | 90,361 | 57,785 | 65,052 |
| Capital charge | 14,095 | 12,566 | 16,580 | 20,418 | 23,258 | 24,748 | 20,373 |
| Other operating costs | 145,631 | 160,839 | 174,542 | 178,826 | 248,360 | 201,969 | 234,118 |
| Total expenditure | 694,548 | 750,525 | 814,205 | 930,911 | 1,095,336 | 930,349 | 1,280,669 |
In 2020/21 we spent $1,095 million as a department, $164 million more than 2019/20 and $165 million higher than the 2020/21 Main Estimates. This is mainly due to costs related to MIQ operational support, including personnel and security costs.
Depreciation, amortisation and impairment is $36 million more than 2019/20 at $90 million, largely due to the accelerated amortisation and impairment of the current visa processing system, which will be replaced by the new Advanced Digital Employer-led Processing and Targeting (ADEPT) visa processing systems. The ADEPT project was initiated to help meet the policy objective of simplifying immigration processes for employers and immigrants. As the ADEPT project is expected to be completed in 2021/22, the useful life of the systems being replaced were reviewed, and consequently amortisation of the Immigration Global Management System has been accelerated and recognised in this financial year.
The memorandum accounts we administer
| Actual 2017 $000 |
Actual 2018 $000 |
Actual 2019 $000 |
Actual 2020 $000 |
Actual 2021 $000 |
Unaudited Main Estimates 2021 $000 |
Unaudited Forecast 2022 $000 |
|
|---|---|---|---|---|---|---|---|
| Immigration visa | (11,709) | (45,724) | (65,123) | (127,137) | (79,226) | (115,490) | (210,083) |
| Building controls | 32,010 | 43,015 | 55,548 | 56,327 | 57,019 | 58,386 | 49,647 |
| Registration and granting of intellectual property rights | 27,510 | 29,804 | 31,181 | 30,060 | 28,762 | 31,857 | 19,212 |
| Other memorandum accounts | 34,925 | 41,623 | 45,645 | 32,806 | 36,800 | 20,355 | (1,473) |
| Memorandum account balance at 30 June | 82,736 | 68,718 | 67,251 | (7,944) | 43,355 | (4,892) | (142,661) |
Memorandum accounts record the cumulative surplus or deficit of MBIE services that are intended to be fully cost recovered from third parties through fees, levies or other charges. Memorandum accounts provide transparency around these services, and in the long term, the balance of each memorandum account is expected to trend towards zero.
In 2020/21 MBIE administered 14 (2019/20: 15) memorandum accounts.
The overall memorandum account balance at 30 June 2021 was $43 million surplus, increasing by $51 million from the prior year. While there was an operating deficit for the year, it was offset by a capital injection to the immigration- related memorandum accounts. The year's deficit was mainly due to the $172 million (2019/20: $62 million) deficit in the immigration visa memorandum account reflecting the impact of COVID-19 related border restrictions on revenue.
A capital injection was agreed by Cabinet (February 2021) to bring the immigration memorandum account balances as at 30 June 2021 back to pre-COVID-19 levels as at 29 February 2020. Part of the capital injection has been received and applied to the memorandum accounts in 2020/21, with the remainder to be received in 2021/22.
The departmental assets we manage to support our operations
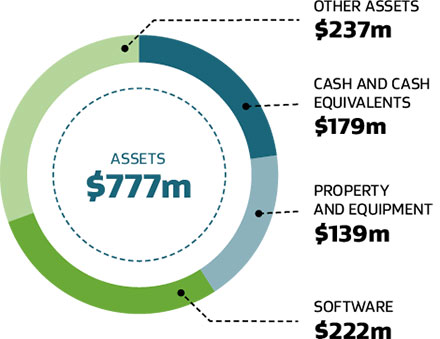
Text version of the departmental assets we manage to support our operations
| Actual 2017 $000 |
Actual 2018 $000 |
Actual 2019 $000 |
Actual 2020 $000 |
Actual 2021 $000 |
Unaudited Main Estimates 2021 $000 |
Unaudited Forecast 2022 $000 |
|
|---|---|---|---|---|---|---|---|
| Cash and cash equivalents | 27,342 | 97,171 | 115,285 | 140,710 | 178,512 | - | 107,762 |
| Property and equipment | 88,463 | 96,710 | 110,977 | 134,941 | 139,475 | 146,063 | 171,969 |
| Software assets | 185,349 | 203,189 | 216,880 | 233,329 | 222,005 | 243,137 | 246,002 |
| Other assets | 105,079 | 106,821 | 111,480 | 83,362 | 237,287 | 117,277 | 100,031 |
| Total assets | 406,233 | 503,891 | 554,622 | 592,342 | 777,279 | 506,477 | 625,764 |
| Capital Expenditure | 76,999 | 71,269 | 74,484 | 98,562 | 78,206 | 80,027 | 83,470 |
MBIE manages $777 million of departmental assets. Software assets and property and equipment represent almost half of our assets. The software assets are the systems run to support the operation of MBIE and the services provided. Most of the software is developed internally rather than purchased. Our property and equipment are the land, buildings, leasehold improvements, furniture and fittings, vehicles and computer hardware we use in our daily operations. Most of the other assets we control relate to debtors and other receivables due to us.
In 2020/21 our capital expenditure decreased by $20 million compared to the prior year and was $2 million lower than the 2020/21 Main Estimates. This decrease is largely due to the additional expenditure in 2019/20 related to the leased cross-government office space in Pastoral House and the MBIE payroll system.
Cash and cash equivalents and other assets are $192 million higher than the prior year and $299 million higher than the 2020/21 Mains Estimates. The increase in other assets is mainly due to Crown funding not yet drawn down. Funds have been made available by the Crown to address the impact of COVID-19 on MBIE’s liquidity. However, due to reductions in discretionary expenditure and timing of expenditure, less funds have been required to be drawn down.
The non-departmental revenue we received on behalf of the Crown
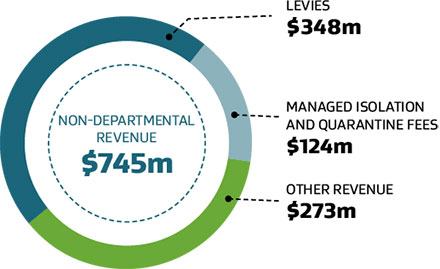
Text version of the non-departmental revenue we received on behalf of the Crown
| Actual 2017 $000 |
Actual 2018 $000 |
Actual 2019 $000 |
Actual 2020 $000 |
Actual 2021 $000 |
Unaudited Main Estimates 2021 $000 |
Unaudited Forecast 2022 $000 |
|
|---|---|---|---|---|---|---|---|
| Levies | 332,329 | 332,316 | 459,719 | 374,444 | 348,155 | 361,752 | 418,507 |
| Managed Isolation and Quarantine fees | - | - | - | - | 123,812 | - | 68,511 |
| Other revenue | 310,375 | 331,801 | 357,188 | 300,965 | 237,435 | 236,092 | 334,091 |
| Total non-departmental revenue | 642,704 | 664,117 | 816,907 | 675,409 | 745,402 | 597,844 | 821,109 |
Non-departmental revenue for 2020/21 was $745 million, $70 million more than 2019/20 and $148 million higher than the 2020/21 Main Estimates. The higher revenue is mainly due to MIQ fees not collected in the prior year or forecast in the Main Estimates. MIQ facilities were set up in response to the COVID-19 pandemic, and the fees regime came into force in August 2020.
The non-departmental expenditure we administer on behalf of the Crown
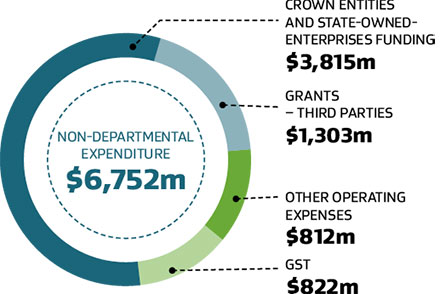
MBIE administers non-departmental activities on behalf of the Crown via 135 non-departmental appropriations. Funding is distributed to third parties, state-owned enterprises and 26 Crown entities to support their operations and the grants they administer.
Text version of the non-departmental expenditure we administer on behalf of the crown
| Actual 2017 $000 |
Actual 2018 $000 |
Actual 2019 $000 |
Actual 2020 $000 |
Actual 2021 $000 |
Unaudited Main Estimates 2021 $000 |
Unaudited Forecast 2022 $000 |
|
|---|---|---|---|---|---|---|---|
| Crown entities and state-owned enterprises funding | 2,608,988 | 2,780,254 | 2,927,341 | 3,179,681 | 3,814,852 | 3,462,997 | 3,612,951 |
| Grants – third parties | 411,331 | 471,464 | 584,986 | 771,504 | 1,302,717 | 775,606 | 1,529,382 |
| Other operating expenses | 93,520 | 96,542 | 272,182 | 251,783 | 811,928 | 178,948 | 899,005 |
| GST | 422,218 | 466,018 | 501,378 | 586,383 | 822,527 | 596,369 | 815,581 |
| Total non-departmental expenditure | 3,536,057 | 3,814,278 | 4,285,887 | 4,789,351 | 6,752,024 | 5,013,920 | 6,856,919 |
Our non-departmental expenditure was $1,738 million higher than the 2020/21 Main Estimates, which is largely due to expenditure related to the delivery of MIQ support, and new COVID-19 related appropriations in the tourism sector, research and supporting regional sectors.
In total $530 million was spent on MIQ-related activities, including the leasing of hotel facilities and employment of staff at these facilities.