Financial commentary
This section of the Annual report provides a commentary on MBIE’s 2018/19 financial results and a view of our forecast financial plans for 2019/20.
On this page
This commentary compares financial performance for the year with:
- The previous financial year, 2017/18
- The 2018/19 budget set in May 2018 as part of the Government’s Budget (Note, this is referred to as Main Estimates)
- The 2019/20 budget set in May 2019 as part of the Government’s Budget (Note, this is referred to as Forecast)
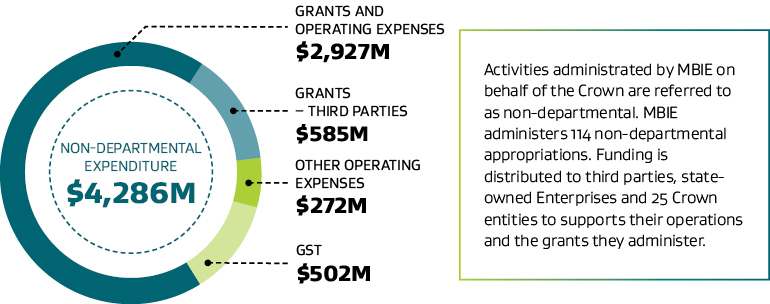
Information is also provided in this commentary on non-departmental operations, where we administer activities on behalf of the Crown.
MBIE’s departmental activities
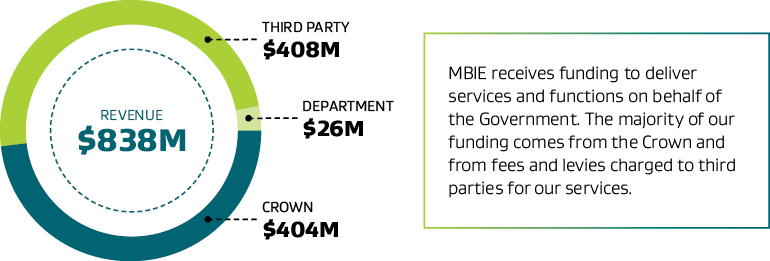
MBIE’s departmental activities are funded through 68 appropriations across 16 Ministerial portfolios. In 2018/19 our revenue was $838 million and we spent $814 million, resulting in a net surplus of $24 million. Unspent funding has been approved to be carried forward into the next financial year to match the timing of the activities which has also rolled over into 2019/20.
There were two key activities in the year which impacted on our finances compared to last year:
- The establishment of PDU has resulted in increased operating costs and related funding
- The transfer of several activities to HUD on 1 October 2018 has reduced spend and related funding accordingly.
Other factors such as the fees and levies review increased immigration fees, and combined with increasing visa applications, has increased third party funding.
In 2019/20 we expect $806 million of operating expenses and are forecasting $81 million of capital expenditure.

Text version of MBIE's revenue and expenses
14 memorandum accounts we administer have a surplus of $67 million. Fees charged are to cover the cost of delivering the services and therefore memorandum accounts balances should trend, in the longer term, towards zero. There are three memorandum accounts with relatively large balances; two in surplus and one in deficit. Plans are in place to reduce those balances.

Text version of MBIE's memorandum accounts
The money we receive to fund our departmental operations
Text version of the money we receive to fund our departmental operations
| Actual for 2015 $000 |
Actual for 2016 $000 |
Actual for 2017 $000 |
Actual for 2018 $000 |
Actual for 2019 $000 |
Unaudited Main Estimates for 2019 $000 |
Unaudited Forecast for 2020 $000 |
|
|---|---|---|---|---|---|---|---|
| Crown revenue | 270,733 | 302,461 | 328,998 | 365,888 | 404,190 | 381,139 | 384,659 |
| Third party revenue | 340,326 | 368,833 | 370,537 | 376,501 | 408,472 | 413,642 | 401,845 |
| Department revenue | 3,139 | 7,386 | 8,148 | 14,533 | 25,502 | 16,889 | 19,709 |
| Total revenue | 614,198 | 678,680 | 707,683 | 756,922 | 838,164 | 811,670 | 806,213 |
In 2018/19 Crown revenue increased by $38.302 million from 2017/18 and was $23.051 million above the Main Estimates. This increase included additional funding to establish the PDU and this was partly offset by housing functions that were transferred from MBIE to HUD on 1 October 2018. Funding for the PDU was not finalised when the Main Estimates were published, and as a result, the 2019/20 forecast is expected to increase by $37.739 million.
In 2018/19 revenue from third parties was $31.971 million higher than 2017/18 mainly due to an increase in immigration fees as a result of the recent fees and levies review and increased visa applications. The 2018/19 Main Estimates and 2019/20 forecast are in line with 2018/19 actuals. In 2019/20, additional revenue is expected through the Electronic Travel Authority, which will be reflected in the updated forecast.
Revenue from other departments significantly increased in 2018/19 compared to the prior year ($10.969 million) and to the 2018/19 Main Estimates ($8.613 million) due to MBIE leading improvements in public sector procurement and shared support services provided to HUD. The 2019/20 revenue forecast from other departments is estimated to be similar to the current year.
How we spent the funding we received for our departmental operations
Text version of the actual money we spent to fund our departmental operations
| Actual 2015 $000 |
Actual 2016 $000 |
Actual 2017 $000 |
Actual 2018 $000 |
Actual 2019 $000 |
Unaudited Main Estimates 2019 $000 |
Unaudited Forecast 2020 $000 |
|
|---|---|---|---|---|---|---|---|
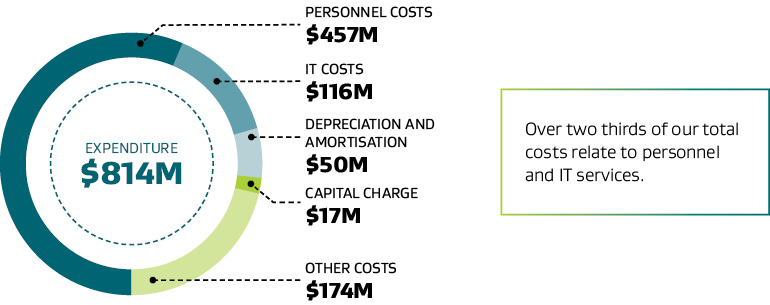
| Personnel costs | 308,517 | 321,657 | 399,971 | 433,634 | 456,787 | 462,697 | 461,846 |
| IT costs | 97,210 | 111,956 | 94,310 | 98,222 | 115,806 | 109,539 | 109,649 |
| Depreciation, amortisation and impairment | 27,887 | 32,689 | 40,541 | 45,264 | 50,490 | 45,748 | 48,208 |
| Capital charge | 14,731 | 16,122 | 14,095 | 12,566 | 16,580 | 13,946 | 20,082 |
| Other operating costs | 133,826 | 136,228 | 145,631 | 160,839 | 174,542 | 172,343 | 166,428 |
| Total expenditure | 582,171 | 618,652 | 694,548 | 750,525 | 814,205 | 804,273 | 806,213 |
In 2018/19 MBIE underwent organisational changes which included an expansion of the PDU’s operations and transfer of housing functions to HUD. Reflecting an increase in the number of employees across MBIE, 2018/19 personnel costs were $23.153 million higher than in 2017/18 and in line with the 2018/19 Main Estimates.
Our IT costs increased by $17.584 million in 2018/19 compared to 2017/18 and were $6.267 million above 2018/19 Main Estimates. This was largely due to additional funding received by Immigration New Zealand in the 2018 Budget to enable IT investment to provide better services to applicants.
Other operating costs for the 2018/19 year were $13.703 million higher than 2017/18 and were in line with the 2018/19 Main Estimates. The increase for 2018/19 mainly relates to the new administration and use agreements through which MBIE provides the PGF-related funding to the other participating agencies. Other cost increases relate to the external provision of general services, including security, scanning and imaging, and document and website content production.
The memorandum accounts we administer
| Actual 2015 $000 |
Actual 2016 $000 |
Actual 2017 $000 |
Actual 2018 $000 |
Actual 2019 $000 |
Unaudited Main Estimates 2019 $000 |
Unaudited Forecast 2020 $000 |
|
|---|---|---|---|---|---|---|---|
| Immigration visa | (14,732) | (4,697) | (11,709) | (45,724) | (65,123) | (34,066) | (43,432) |
| Building Controls | 16,632 | 25,288 | 32,010 | 43,015 | 55,548 | 43,740 | 55,841 |
| Registration and granting of intellectual property rights | 17,284 | 22,389 | 27,510 | 29,804 | 31,181 | 32,658 | 33,110 |
| Other revenue associated with a memorandum account | 19,888 | 20,604 | 34,925 | 41,623 | 45,645 | 30,203 | 46,193 |
| Memorandum account balance at 30 June | 39,072 | 63,584 | 82,736 | 68,718 | 67,251 | 72,535 | 91,712 |
Memorandum accounts record the cumulative surplus or deficit of MBIE services that are intended to be fully cost recovered from third parties through fees, levies or other charges. Memorandum accounts provide transparency around these services and, in the long term, the balance of each memorandum account is expected to trend towards zero.
MBIE introduced the Electronic Travel Authority memorandum account in 2019/20. The programme will screen travellers for border and immigration risks whilst making the border entry as seamless as possible. It will be funded by fees paid by international visitors.
In 2018/19 MBIE administered 14 memorandum accounts with a cumulative net surplus of $67.251 million. As at 30 June 2019:
| Memorandum account | Actual 2018 $000 |
Explanation |
|---|---|---|
| Building controls | 55,548 | The building controls memorandum account surplus grew by $12.533 million in 2018/19 compared to the prior year due to increased new building consents. The memorandum account balance is expected to remain steady in 2019/20 due to expanded work programmes. Additionally, a proposed reduction to the levy rate is currently in consultation. |
| Registration and granting of intellectual property rights | 31,181 | The registration and granting of intellectual property rights memorandum account surplus increased by $1.377 million in 2018/19 compared to the prior year. The trademarks and patents fees review was approved by Cabinet in March 2019, and implementation is expected in February 2020. Changes in the fees and a planned increase in expenditure are forecast to significantly reduce the memorandum account balance by 2024/25. |
| Immigration visa | (65,123) | The immigration visa memorandum account had a deficit of $65.123 million. Following an immigration visa fees and levies review, new fees and levies have taken effect since November 2018, and it is forecast that the deficit will be reduced by $21.691 million in 2019/20. |
The departmental assets we manage to support our operations

Text version of the departmental assets we manage to support our operations
| Actual 2015 $000 |
Actual 2016 $000 |
Actual 2017 $000 |
Actual 2018 $000 |
Actual 2019 $000 |
Unaudited Main Estimates 2019 $000 |
Unaudited Forecast 2020 $000 |
|
|---|---|---|---|---|---|---|---|
| Cash and cash equivalents | 61,480 | 61,362 | 27,342 | 97,171 | 115,285 | 48,493 | 51,776 |
| Property and equipment | 52,042 | 69,668 | 88,463 | 96,710 | 110,977 | 99,153 | 134,377 |
| Software assets | 146,461 | 168,466 | 185,349 | 203,189 | 216,880 | 230,780 | 229,349 |
| Other assets | 81,960 | 118,627 | 105,079 | 106,821 | 111,480 | 88,742 | 127,755 |
| Total assets | 341,943 | 418,123 | 406,233 | 503,891 | 554,622 | 467,168 | 543,257 |
| Capital Expenditure | 68,636 | 68,334 | 76,999 | 71,269 | 74,484 | 68,728 | 81,252 |
MBIE manages $554.622 million of departmental assets. Software assets and our property and equipment represent over half of our assets. Our software assets are the systems we run to support the operation of MBIE and the services we provide. Most of the software is developed internally rather than purchased. Our property and equipment are the land, buildings, leasehold improvements, furniture and fittings, vehicles and computer hardware we use in our daily operations. Most of the other assets we control relate to debtors and other receivables due to us.
In 2018/19 our capital expenditure increased by $3.215 million compared to the prior year and was $5.756 million higher than the 2018/19 Main Estimates. This was largely due to leasehold improvements to our buildings. We forecast that we will spend $6.768 million more in 2019/20 than 2018/19, which relates to a large one-off cross-government property-related project.
Off-balance sheet trust accounts
MBIE manages nine off-balance sheet trust accounts. As at 30 June 2019 most of the funds held in trust relate to the Residential Tenancies Trust Account ($587.690 million) and the Criminal Proceeds (Recovery) Trust Account ($166.611 million).

Text version of off-balance sheet trust accounts
The non-departmental expenditure we administer on behalf of the Crown
Text version of the non-departmental expenditure we administer on behalf of the Crown
| Actual 2015 $000 |
Actual 2016 $000 |
Actual 2017 $000 |
Actual 2018 $000 |
Actual 2019 $000 |
Unaudited Main Estimates 2019 $000 |
Unaudited Forecast 2020 $000 |
|
|---|---|---|---|---|---|---|---|
| Grants and operating expenses – Crown entities and State-Owned Enterprises | 2,208,147 | 2,420,151 | 2,608,988 | 2,780,254 | 2,927,341 | 3,034,918 | 3,091,959 |
| Grants – third parties | 383,856 | 407,886 | 411,331 | 471,464 | 584,986 | 894,256 | 1,422,699 |
| Other operating expenses | 82,227 | 65,457 | 93,520 | 96,542 | 272,182 | 325,615 | 473,981 |
| GST | 350,276 | 394,806 | 422,218 | 466,018 | 501,378 | 636,022 | 646,896 |
| Total non-departmental expenditure | 3,024,506 | 3,288,300 | 3,536,057 | 3,814,278 | 4,285,887 | 4,890,811 | 5,635,535 |
Grants and other expenses we provide to Crown entities and state-owned enterprises increased $147.087 million in 2018/19 compared to 2017/18, largely relating to additional operating funding for ACC and an increase in grants given out for the Endeavour Fund and the Grant Scheme for Warm, Dry Homes. 2018/19 actual grants and operating expenses to Crown entities and state-owned enterprises were $107.577 million lower than 2018/19 Main Estimates. This is mainly because at the time the Main Estimates were set it was not known that a number of activities, including funding provided to the Housing New Zealand Corporation, would be transferred to HUD. In Budget 2019 a number of science-related initiatives were approved, and it is forecast that expenditure will increase by $164.618 million compared to 2018/19 actuals.
Grants we provide to third parties increased by $113.522 million in 2018/19 mainly relating to the hosting of the 36th America’s Cup and the Provincial Growth Fund (PGF) programme, as well as an increase in grants given for the Tourism Infrastructure Fund, which started in March 2018.
In 2018/19 the Research and Development Tax Incentive was transferred to Inland Revenue and PGF grants have been provided later than expected. As a result, 2018/19 actual grants to third parties were $309.270 million lower than Main Estimates. Some PGF funding for 2018/19 has been deferred to 2019/20, and there has been additional funding approved for 2019/20, which is the main driver of the forecast increase of $837.713 million.
The other operating expenses incurred on behalf of the Crown increased by $175.640 million in 2018/19 due to the Housing Infrastructure Fund loans fair value write down. The 2018/19 other operating expenses were $53.433 lower than 2018/19 Main Estimates. This is mainly due to the transfer of the Crown Land Development Programme to HUD in 2018/19. In 2019/20 other operating expenses are forecast to increase by $201.799 million, reflecting the estimated recognition of the expected interest concession on PGF loans.