Section 1: Financial performance
Read about the IVL’s revenue generation and expenditure for 2019/20.
On this page
Revenue
2019/20 revenue was significantly lower than the estimate due to the drop in international visitor numbers. Estimated revenue for the 2019/20 year was set at $82m, mirroring visitor arrival projections pre-2019/20. Actual revenue collected into the fund to 30 June 2020 was $57m, approximately 30% lower than the estimated revenue.
Incoming IVL revenue followed historical visitor arrival trends until February when borders closed to visitors from China. Revenue dropped further in March and was negligible from April through the remainder of the fiscal year.
Figure 2: Monthly IVL Revenue: 1 July 2019 - 30 June 2020
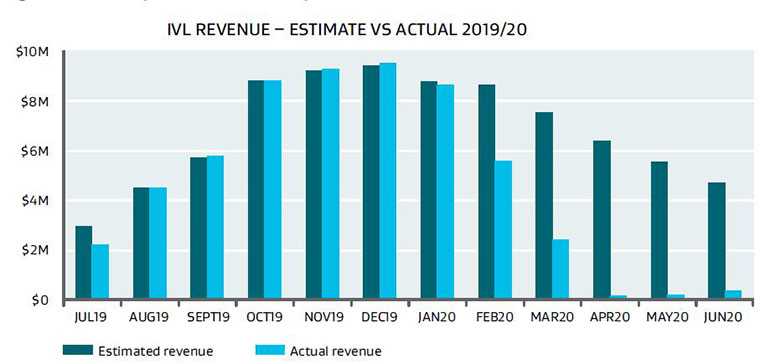
Image description
- Estimated revenue for 2019/20 by month was based on international visitor arrival numbers in 2018/19.
- The revenue that has been collected since borders closed does not necessarily reflect the number of arrivals. Border restrictions have not affected Immigration New Zealand’s ability to accept applications. The majority of revenue from March through June came from offshore ETA and visa applications, which are valid for up to five years.
Expenditure
Cabinet agreed to split the IVL fund 50:50 between the tourism and conservation investment areas.
In August 2019 joint IVL Ministers announced the initial round of IVL programme investments. The 10 investments totalled $18m in funding allocated to the 2019/20 year with a further $23.7m committed in principle across 2020/21 through 2023/24 for multiple-year projects. A number of conservation investments were recalibrated at the end of 2019/20, reducing the total investment to $38.9m.
Extreme weather events and delays that occurred as a result of COVID-19 Alert Level 4 caused significant variation between budgeted and actual expenditure. The first nine months saw steady progress against key milestones across all projects. By late March, a five-week nationwide Alert Level 4 lockdown halted project activity.
Project delays caused some projects to underspend their 2019/20 budgets. In some cases, project funding was carried forward into 2020/21. For others, total funding has been revised downwards, returning the underspent variance to unallocated funding.
The following tables provide an overview of the budgeted and actual funding of each IVL project.
Table 1: Updated Round 1 Funding Commitments by Project Conservation portfolio for the period ended 30 June 2020
| Project | Budgeted funding $M | Actual funding $M | Years | 19/20 Actual $M | 20/21 $M | 21/22 $M | 22/23 $M | 23/24 $M |
|---|---|---|---|---|---|---|---|---|
| Kākāpō Recovery Programme | 8.03 | 8.03 | 5 | 0.48 | 2.52 | 2.09 | 1.11 | 1.83 |
| Maukahuka Pest Free Auckland Island | 4.20 | 1.50 | 2 | 0.25 | 1.25 | – | – | – |
| Regulatory Compliance | 15.00 | 13.68 | 5 | 1.01 | 2.84 | 3.42 | 3.63 | 2.78 |
| Ruapekapeka Pā | 1.20 | 1.20 | 1* | 0.37 | 0.83 | – | – | – |
| Te Manahuna Aoraki Landscape Scale Restoration | 1.00 | 1.50 | 2 | 0.50 | 1.00 | – | – | – |
| Visitor Safety System Trial and Pilot | 0.60 | 0.60 | 1* | 0.25 | 0.35 | – | – | – |
| Conservation totals | 30.00 | 26.51 |
|
2.86 | 8.80 | 5.51 | 4.74 | 4.60 |
* Due to project delays, these one-year projects carried forward underspent 2019/20 project funding to the 2020/21 year
Table 2: Updated Round 1 Funding Commitments by Project Tourism portfolio for the period ended 30 June 2020
| Project | Budgeted funding $M | Actual funding $M | Years | 19/20 Actual $M | 20/21 $M | 21/22 $M | 22/23 $M | 23/24 $M |
|---|---|---|---|---|---|---|---|---|
| Arthur’s Pass Destination Management, Stg 1 | 0.30 | 0.30 | 2 | 0.20 | 0.10 | – | – | – |
| Milford Opportunities Project, Stg 2 | 3.00 | 3.00 | 2 | 2.00 | 1.00 | – | – | – |
| Westland Destination Management, Stg 1 Fox | 3.90 | 3.90 | 2 | 2.07 | 1.83 | – | – | – |
| Building the Tourism Workforce Programme | 5.20 | 5.20 | 4 | 1.17 | 1.44 | 1.44 | 1.15 | – |
| Tourism totals | 12.4 | 12.4 |
|
5.44 | 4.37 | 1.44 | 1.15 |
|
Table 3: Summary Round 1 IVL Five-Year Commitments ($m)
| Y1 Spend $M | Y2-5 Commitments $M | Total ($M) | |
|---|---|---|---|
| Revenue (2019/20) | 57.30 | ||
| Fund Management (Y1-5) & bank fees (Y1) | -2.75 | -4.76 | -7.51 |
| Conservation | -2.86 | -23.65 | -26.51 |
| Tourism | -5.44 | -6.96 | -12.40 |
| Uncommitted Total at 30 June 2020 | 10.88 |