Te Tirohanga ā-Rohe | Regional overview
On this page
In 2022 655,000 people, or 12.8% of New Zealand’s population, lived in Canterbury.
Christchurch is the region’s principal and most populous centre, and the country's second largest urban area. The region grew 0.7% in 2022 which was above the national average of 0.2%.
The Canterbury RSLG region includes 11 different sub-regions:
- Kaikōura
- Hurunui
- Waimakariri
- Christchurch City
- Selwyn
- Ashburton
- Timaru
- Mackenzie
- Waimate
- Waitaki
- Chatham Islands
Canterbury Gross Domestic Profit (GDP) in 2022 was $44,220 million which makes up 12.4% of the national total. Economic GDP growth in the region continues to be strong with an increase of 7.2% tracking ahead of a national average of 5.2%. Canterbury GDP per filled job in 2022 was $126,733 which is 4.6% below the national average of $132,815.
Within the region, Canterbury has 348,920 filled jobs which is equal to a 13% share of the employment in New Zealand. Of this number, 14.6% or 50,835, were self-employed. The sectors contributing the most to Canterbury’s employment numbers in 2022 (by ANZSIC 1 digit code) were:
- Construction (11.3%)
- Health Care and Social Assistance (11%)
- Manufacturing (10.6%)
- Retail Trade (9.4%)
Canterbury also has a strong Agriculture, Forestry and Fishing industry (5.9%) with the sub-regions outside of Christchurch City dominating the employment in this sector.
House values remain significantly more affordable compared to the New Zealand average. This means that Canterbury is able to have a mortgage proportion of income of 40.5% compared to the national average of 49.2%.
The biggest contributors to economic growth in Canterbury over the last 10 years by sector include: Professional, Scientific, and Technical Services; Construction; Retail Trade; and Health Care and Social Assistance.
Forecast workforce demand pressures
The table below is a broad indicator of how workforce demand is forecasted to be distributed across Canterbury’s industries in the future. It takes a forecasted approach, looking at years 2025 to 2028, and takes into account anticipated job openings created through growth, and through people leaving the workforce (e.g., retirement).
It is important to acknowledge the diversity across Canterbury’s sub-regions. Sub-regional industry structures vary, especially when there is an urban and rural distinction. Therefore, it is important to consider sub-regional workforce demand needs alongside the Canterbury region as a whole.
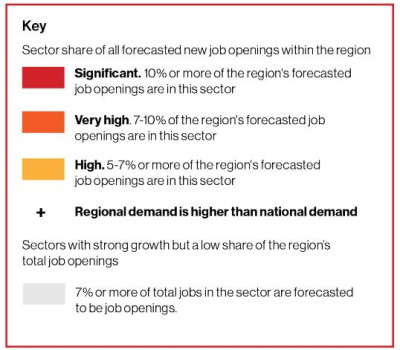
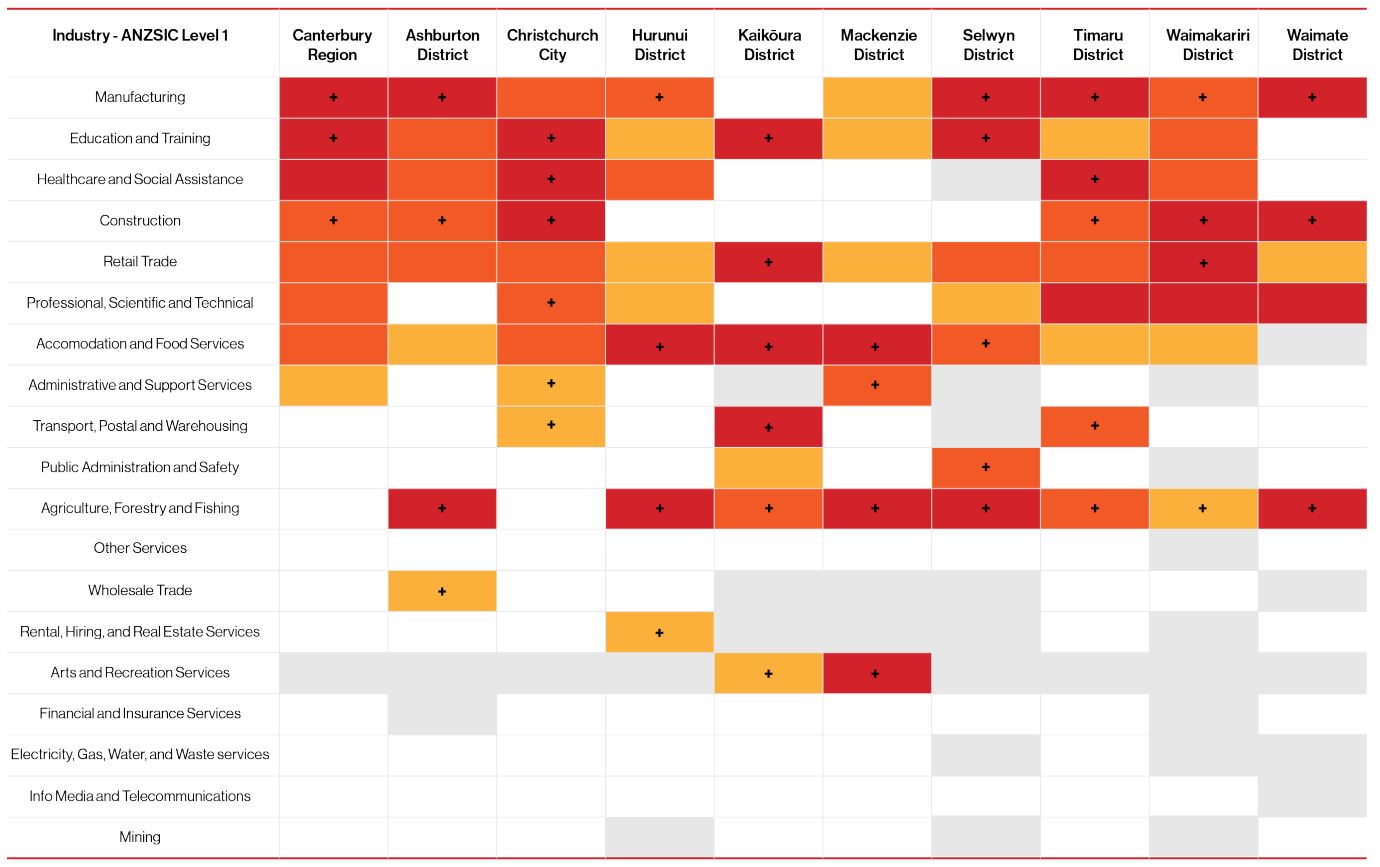
Text description