Overarching statistics on submitters
On this page I tēnei whārangi
Overarching statistics on submitters
There were 487 submissions in response to the public consultation documents and online survey, and feedback from around 600 attendees at the roadshows and site visits. Consultation feedback traversed a range of submitters, sectors and organisation sizes, as set out in the following charts and tables.
Chart 1. Breakdown of submitter types
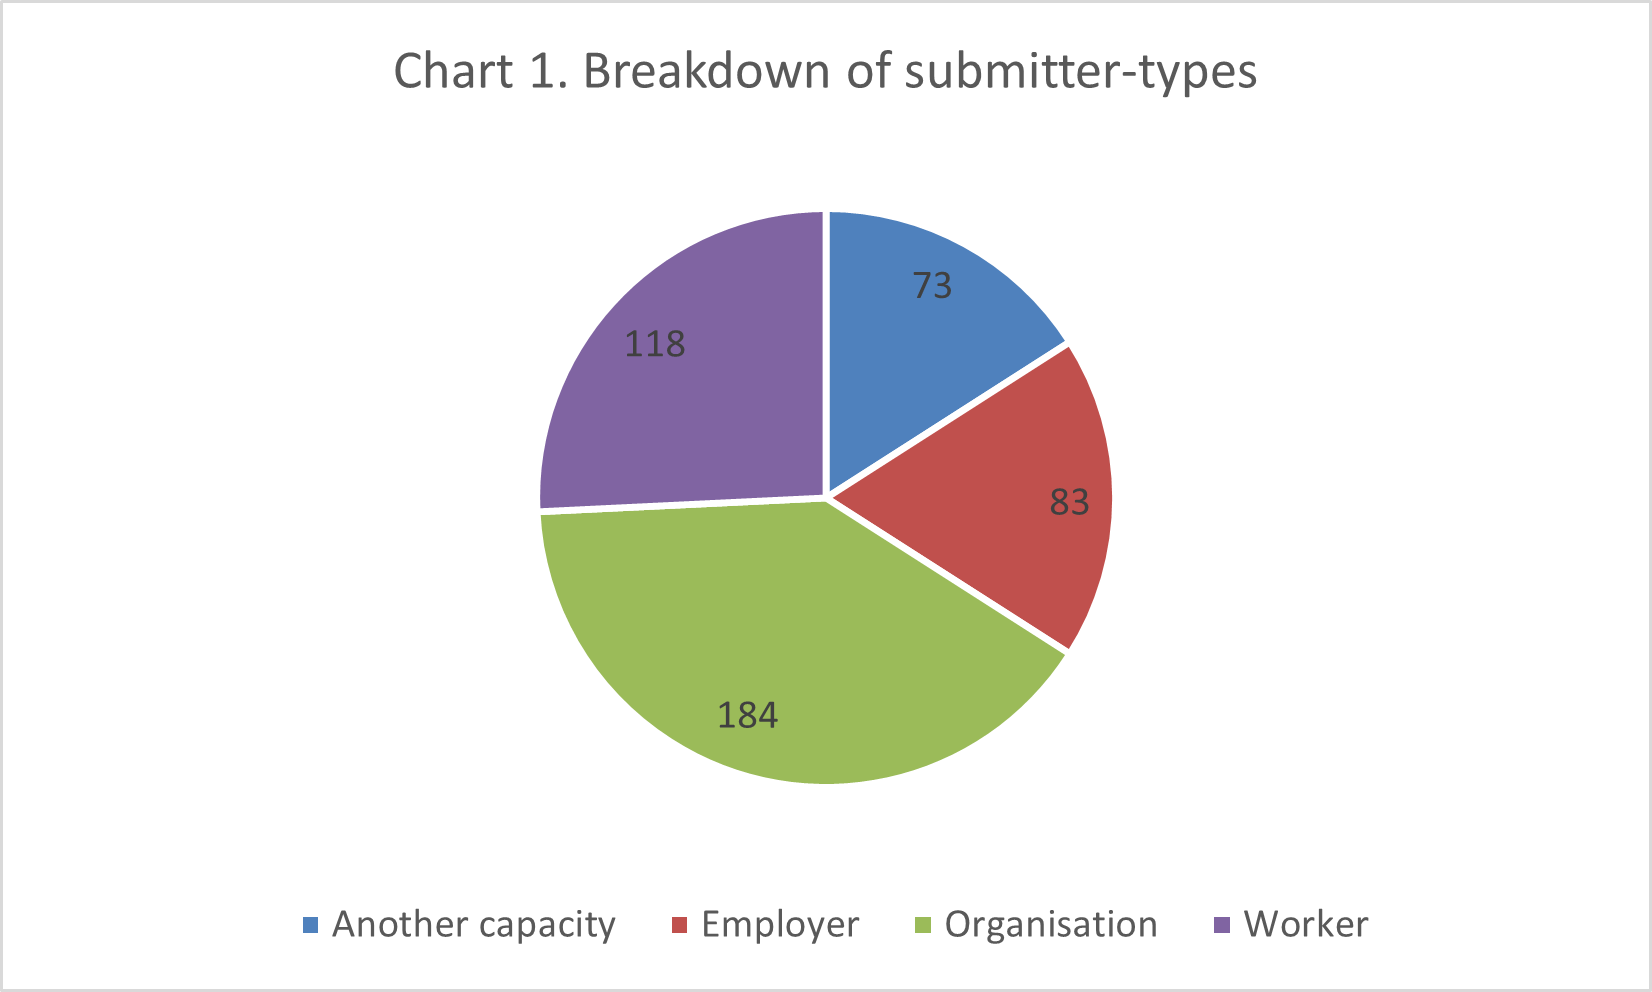
Note: Many submitters likely misunderstood this survey question and entered ‘organisation’ (which is intended to cover entities such as a representative bodies) when they should have entered ‘employer’. This means that the proportion of employers is likely to be larger, and organisations smaller.
Data from chart
Chart 2. Breakdown of submitters by organisation size
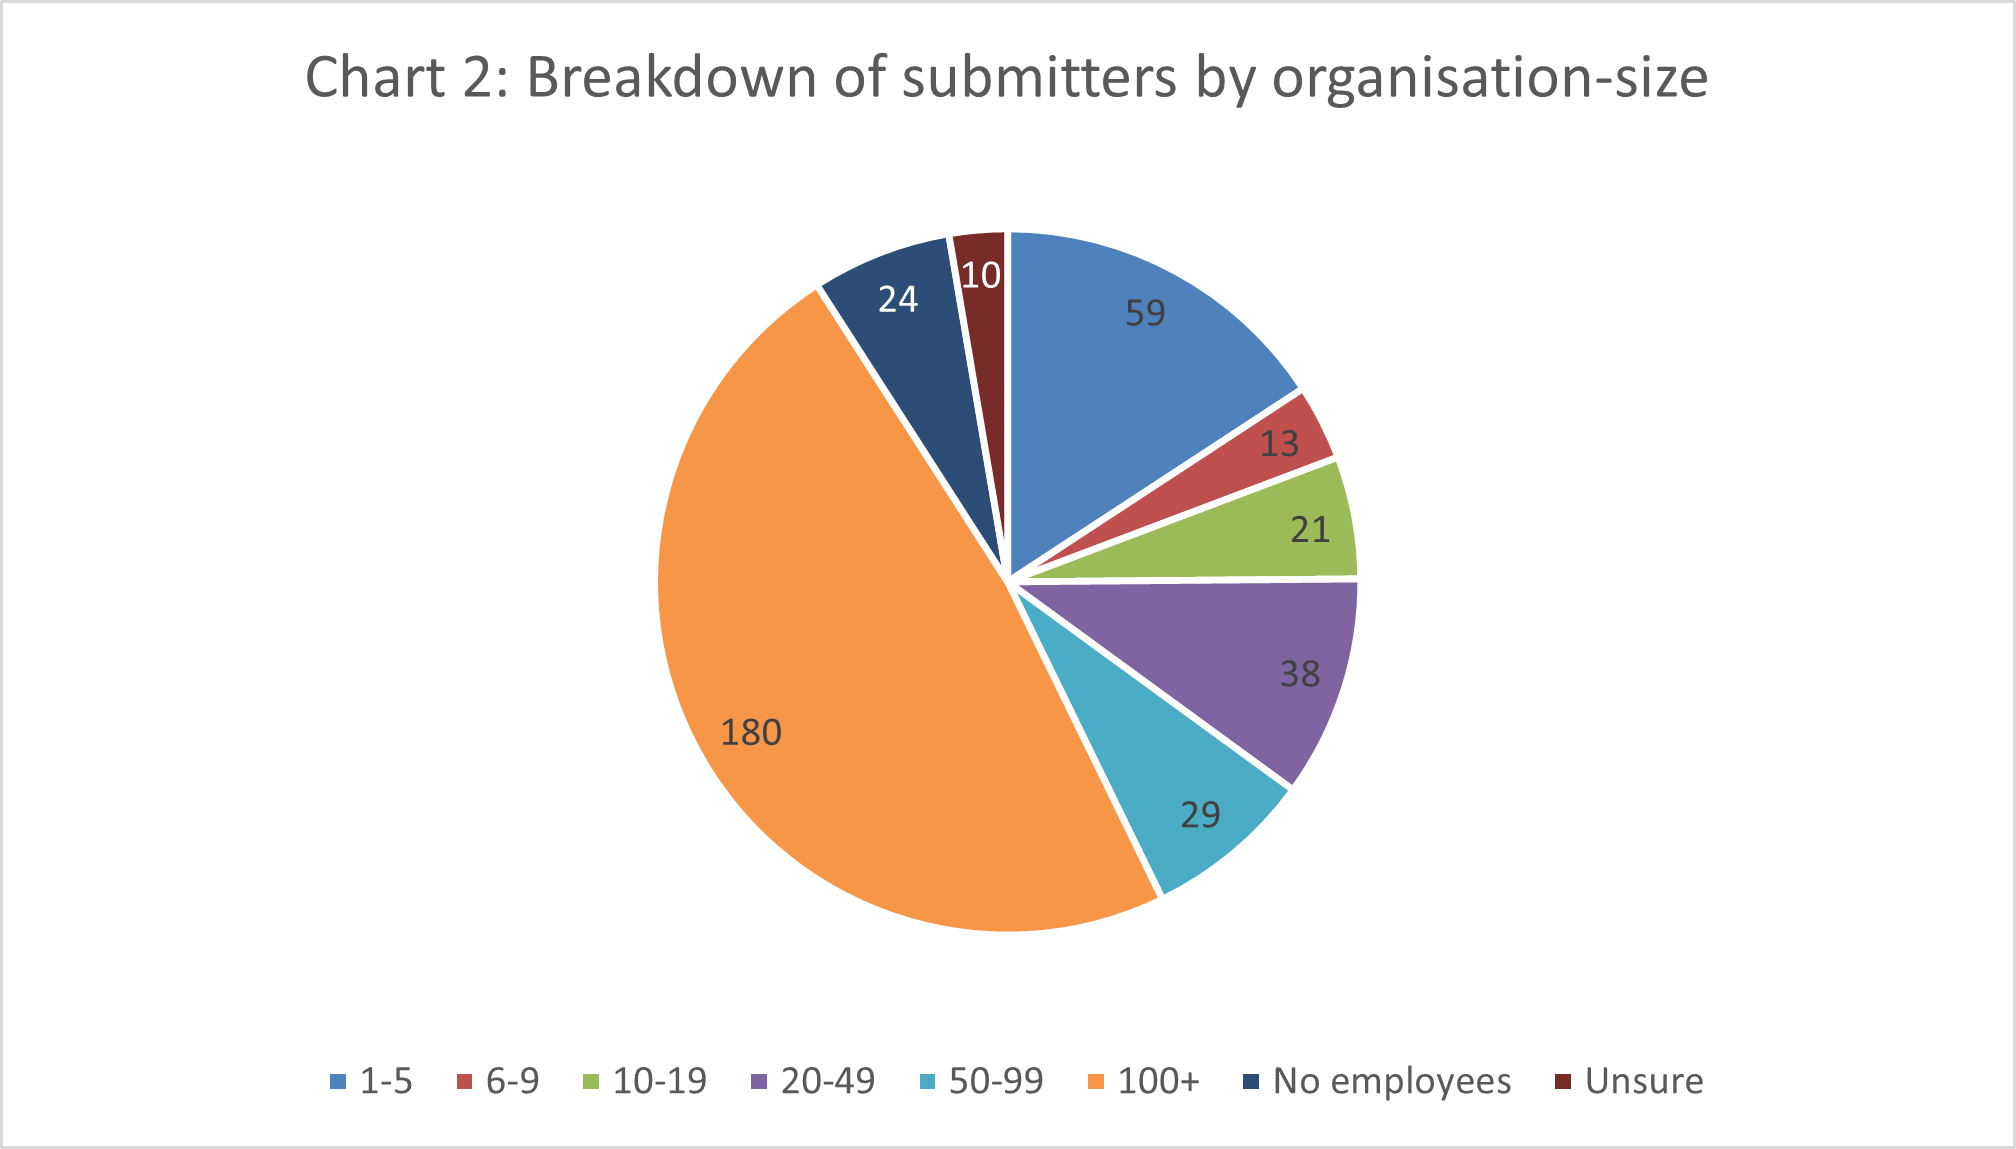
Consultation feedback traversed small and large organisations, with around half of those that specified having more than 50 employees, and around a quarter with less than 20 employees.
Data from chart
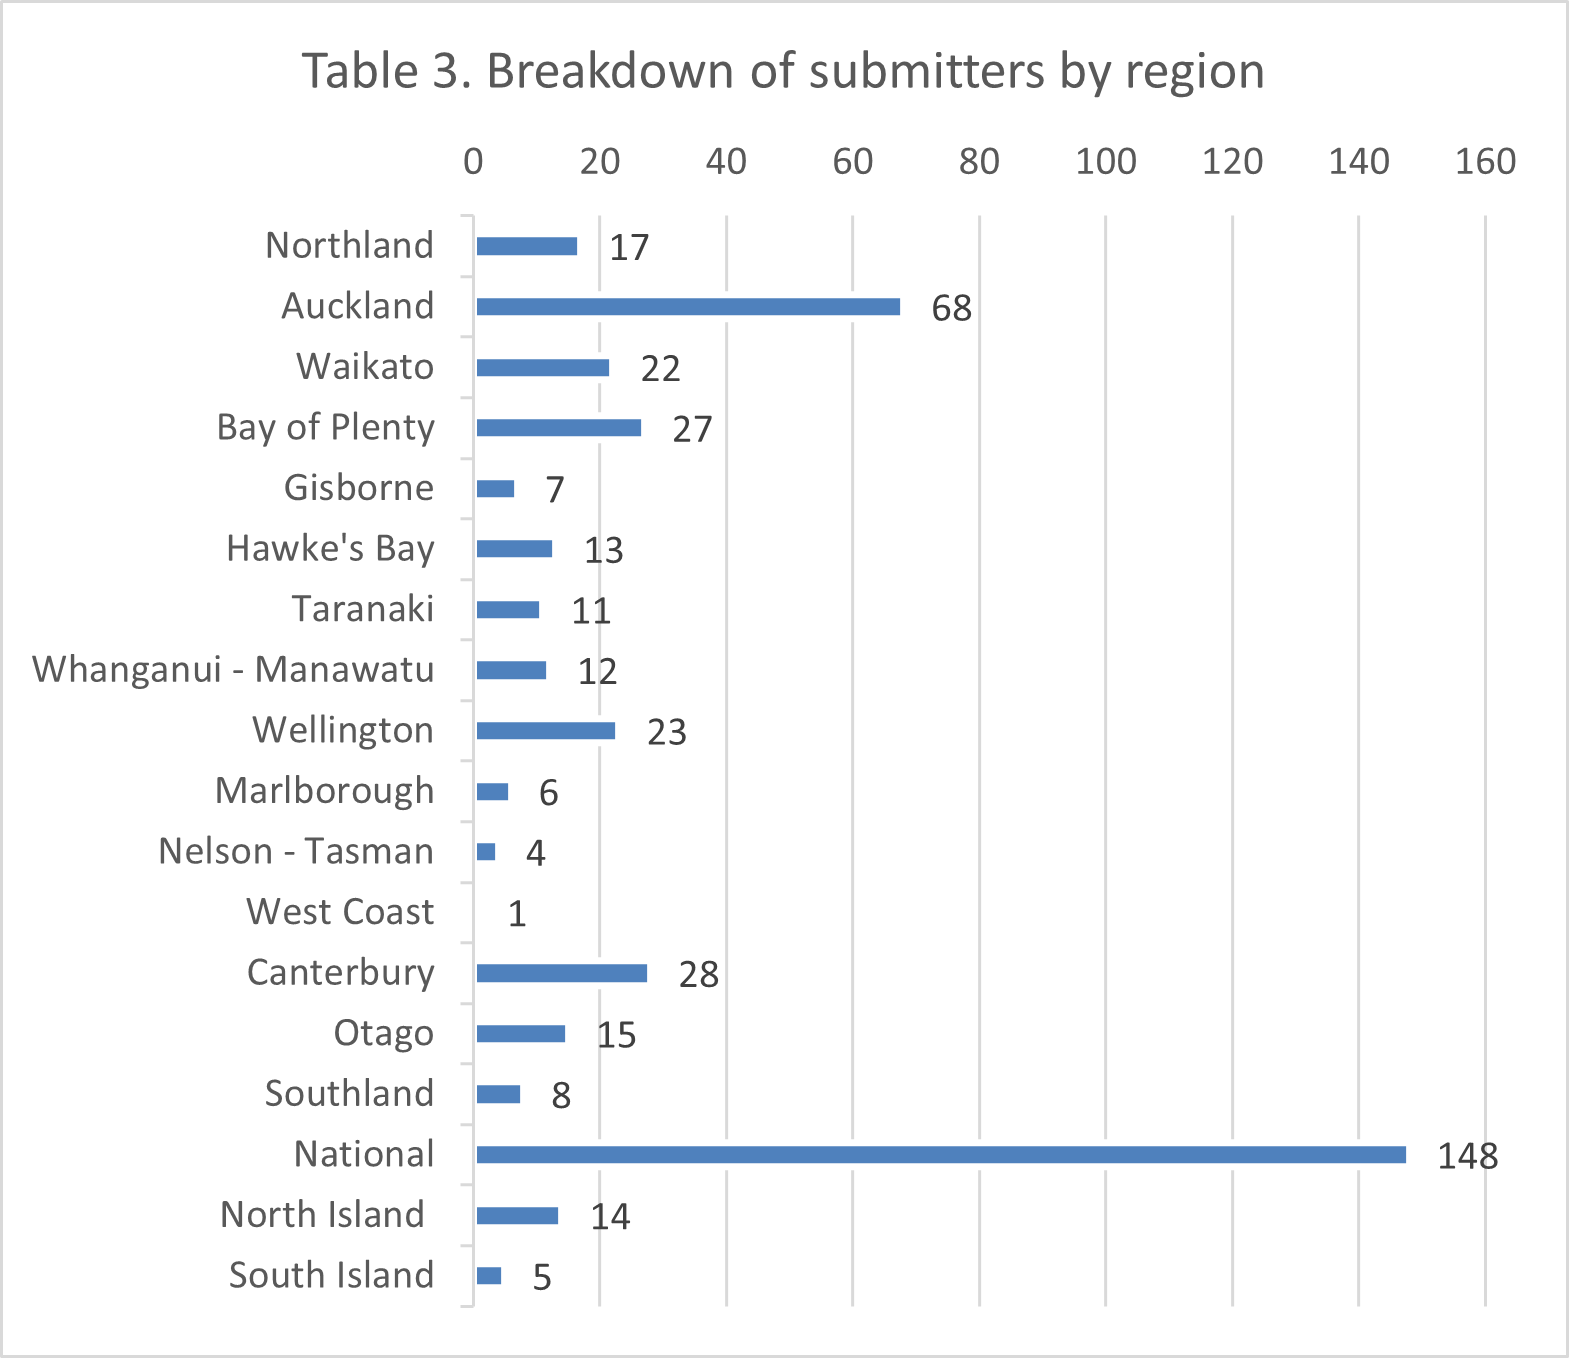
Table 3. Breakdown of submitters by region
Data from chart
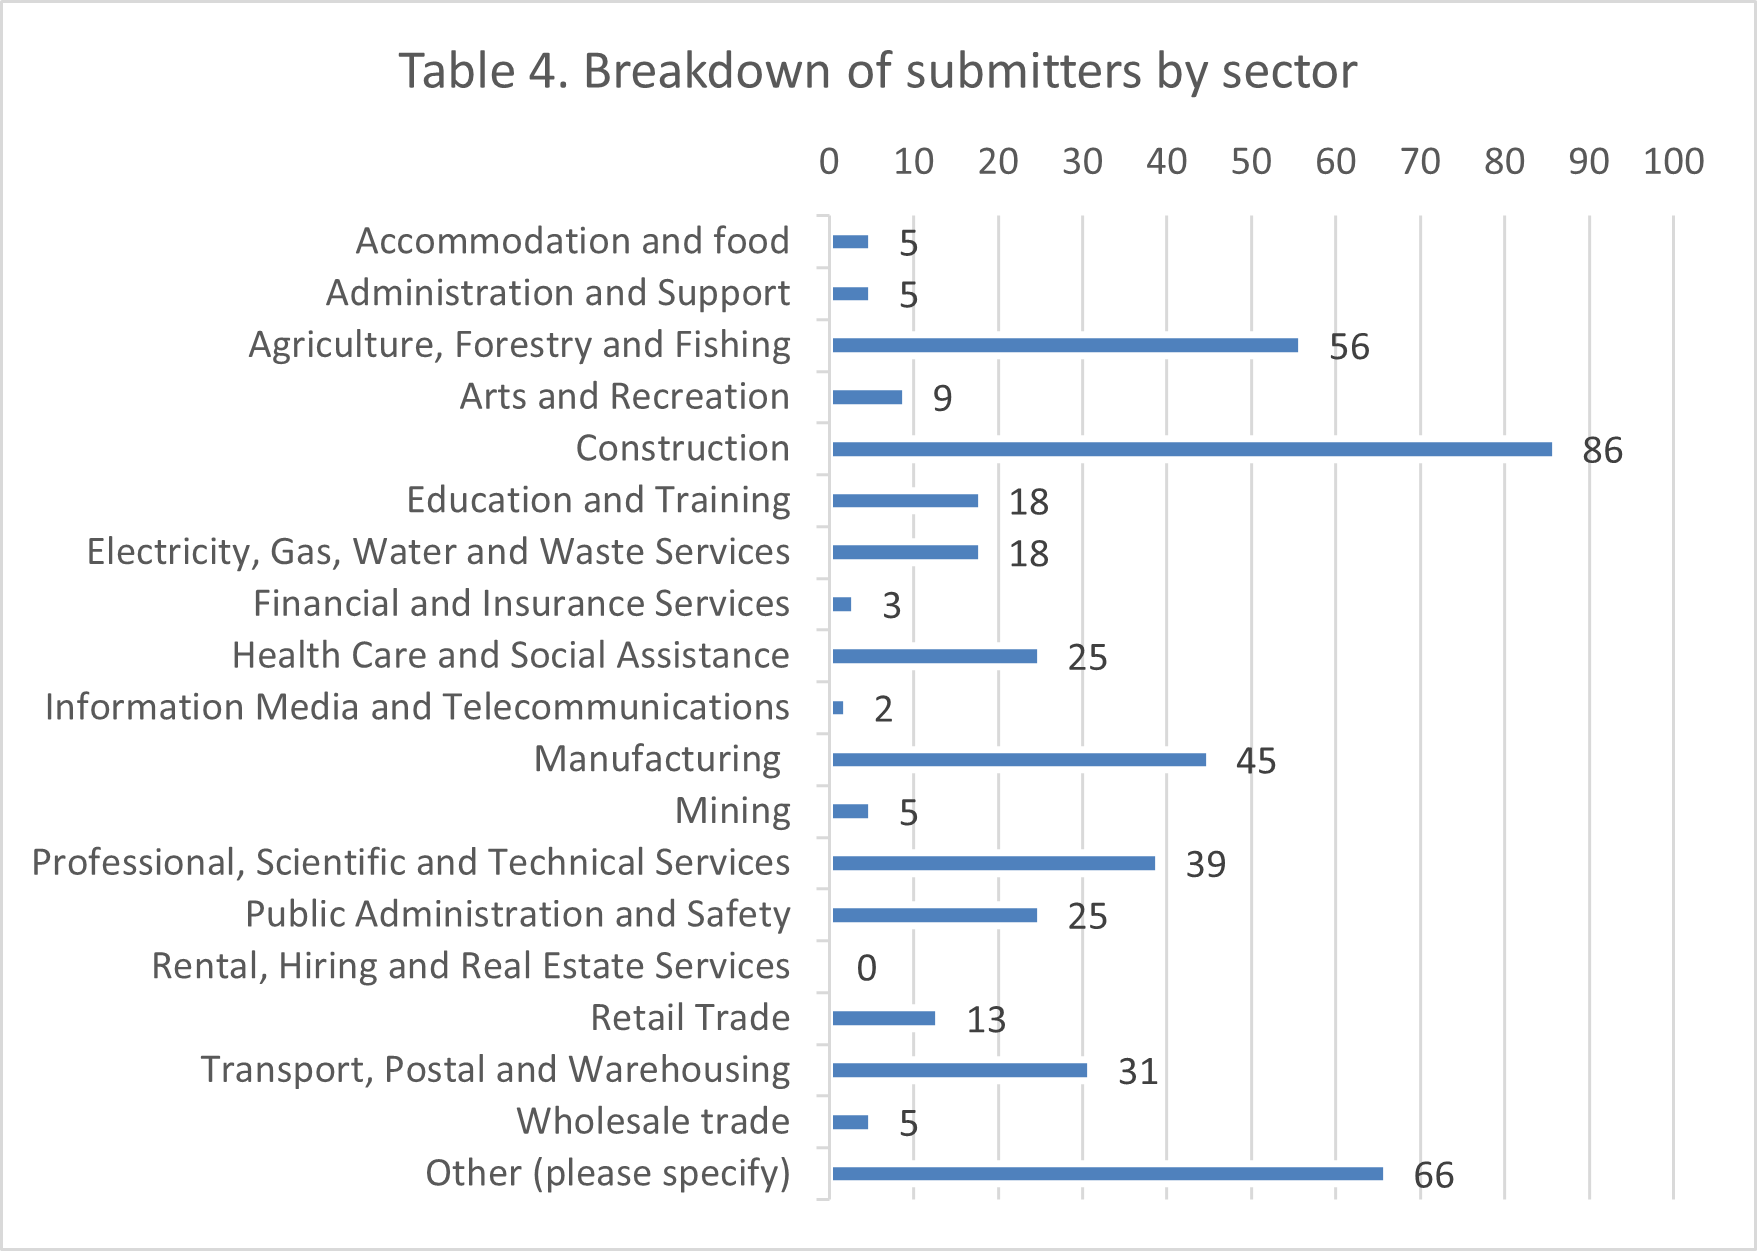
Table 4. Breakdown of submitters by sector
Data from chart