Key New Zealand economic and industry trends
On this page
New Zealand’s construction industry is a significant contributor to the country’s economy.
It is the fifth largest industry, producing 6.3% of the real Gross Domestic Product (GDP). As of February 2023, the sector comprised around 80,613 businesses nationwide (Stats NZ, 2023d), directly employing 308,500 people (about 10.7% of the total workforce) for the year ended June 2023 (Stats NZ, 2023b). It also accounted for 8% of all imports to year ended 2023.
The proportion of Māori-owned construction businesses is increasing.
The share of Māori-owned construction businesses in New Zealand increased from 12.6% in 2011 to 14% in the 2021 financial year (Ministry of Māori Development, 2023). These Māori-owned businesses cover a range of construction activities, including construction services (64.6%), residential and non-residential building construction (32.3%) and heavy and civil engineering construction (3.1%) in the 2021 financial year. Māori construction businesses seem to have a slightly higher representation in the construction service sub-sector, compared to non-Māori construction businesses (64.5% cf. 62.9%).
Sector growth has slowed since mid-2022 amid increasing challenges
Construction growth in New Zealand has slowed since mid-2022 due to cost pressures and economic constraints.
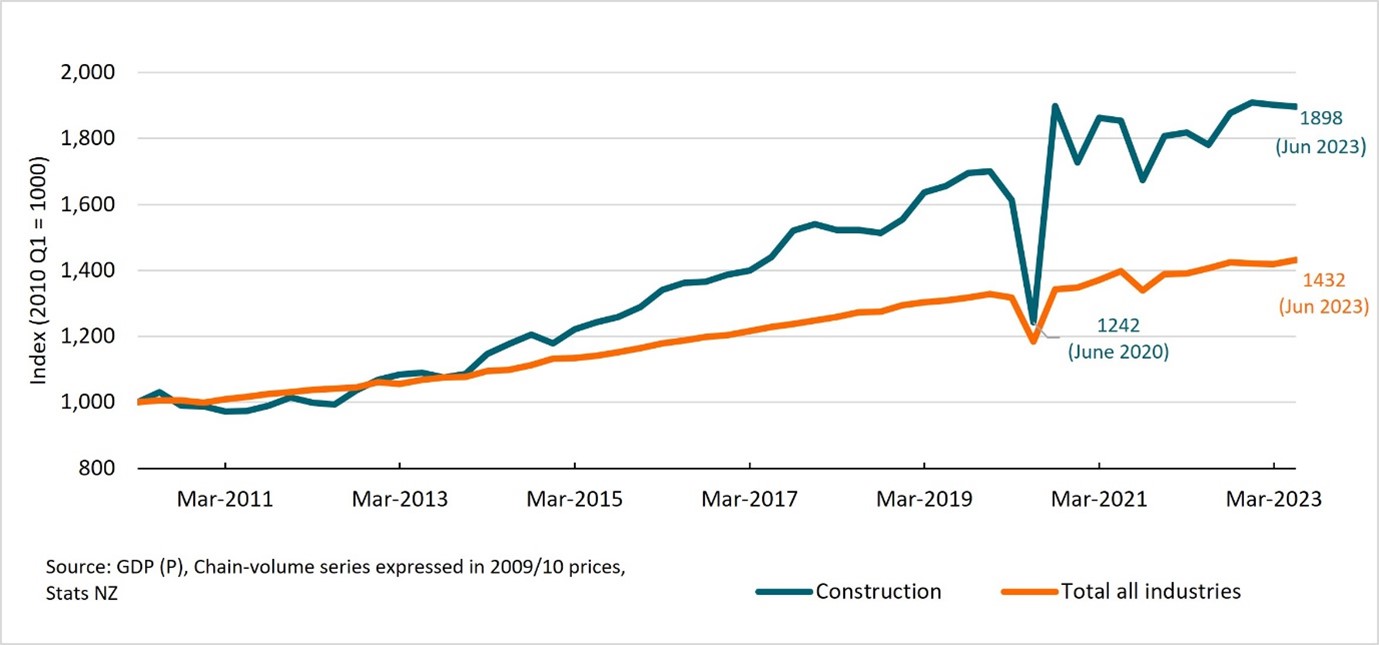
While construction activity grew from approximately 5% of New Zealand’s real GDP in the early 2000’s to about 6.3% in 2022, it showed more volatility than the overall economic activity with pronounced cycles of ‘boom and bust’. Despite a relatively strong performance during 2021-2022, its growth has slowed down since mid-2022 (Stats NZ, 2023e).
The construction sector experienced a period of strong growth between 2019 and 2022. The ‘building’ sub-sector’s contribution to real GDP increased from $5.8 billion in the March 2019 year to $6.1 billion in the March 2022 year. Over the same period the ‘infrastructure’ sub-sector’s contribution to GDP increased from $4.7 billion to $5.2 billion.
Figure 9: Quarterly GDP growth (March 2011 quarter to June 2023 quarter)
Text description for Figure 9
In the year ended March 2023, total construction output (as measured in GDP) rose 4.4%, a drop from the 6.3% growth rate recorded in the previous year. This decline was largely due to challenges faced by the residential and commercial segments, such as hotel and retail spaces.
Residential construction suffered from inflationary pressures and economic challenges. Rising expenses for construction materials and wages weighed down on building costs. Additionally, persistent labour shortages and supply chain issues for some materials caused construction delays. The lower number of residential building consents also suggested a reduced investment in the residential market (ANZ, 2023).
On the other hand, infrastructure construction saw strong growth over the past year supported by strong public investment in water and transport infrastructure projects, as well as cyclone Gabrielle recovery and rebuild efforts. The Infrastructure Commission’s Pipeline snapshot in January-March 2023 (Infrastructure Commission, 2023a) reported a 17% increase in the total value of infrastructure projects, compared to December 2022.
Fall in new dwelling consents, strong growth in infrastructure segment
Investment in the residential sector has been strong in recent years, with an annual investment growth of 3.2% for year ended March 2023. However, this growth slowed in the later part of the year, with a decrease of 2.2% in the December 2022 quarter and a further 0.4% drop in the March 2023 quarter (Stats NZ, 2023e). This moderation in investment was likely due to high inflation, rising interest rates and escalation of construction costs which dampened property demand.
The number of new home consents peaked in early 2022 and has since returned to a more sustainable level.
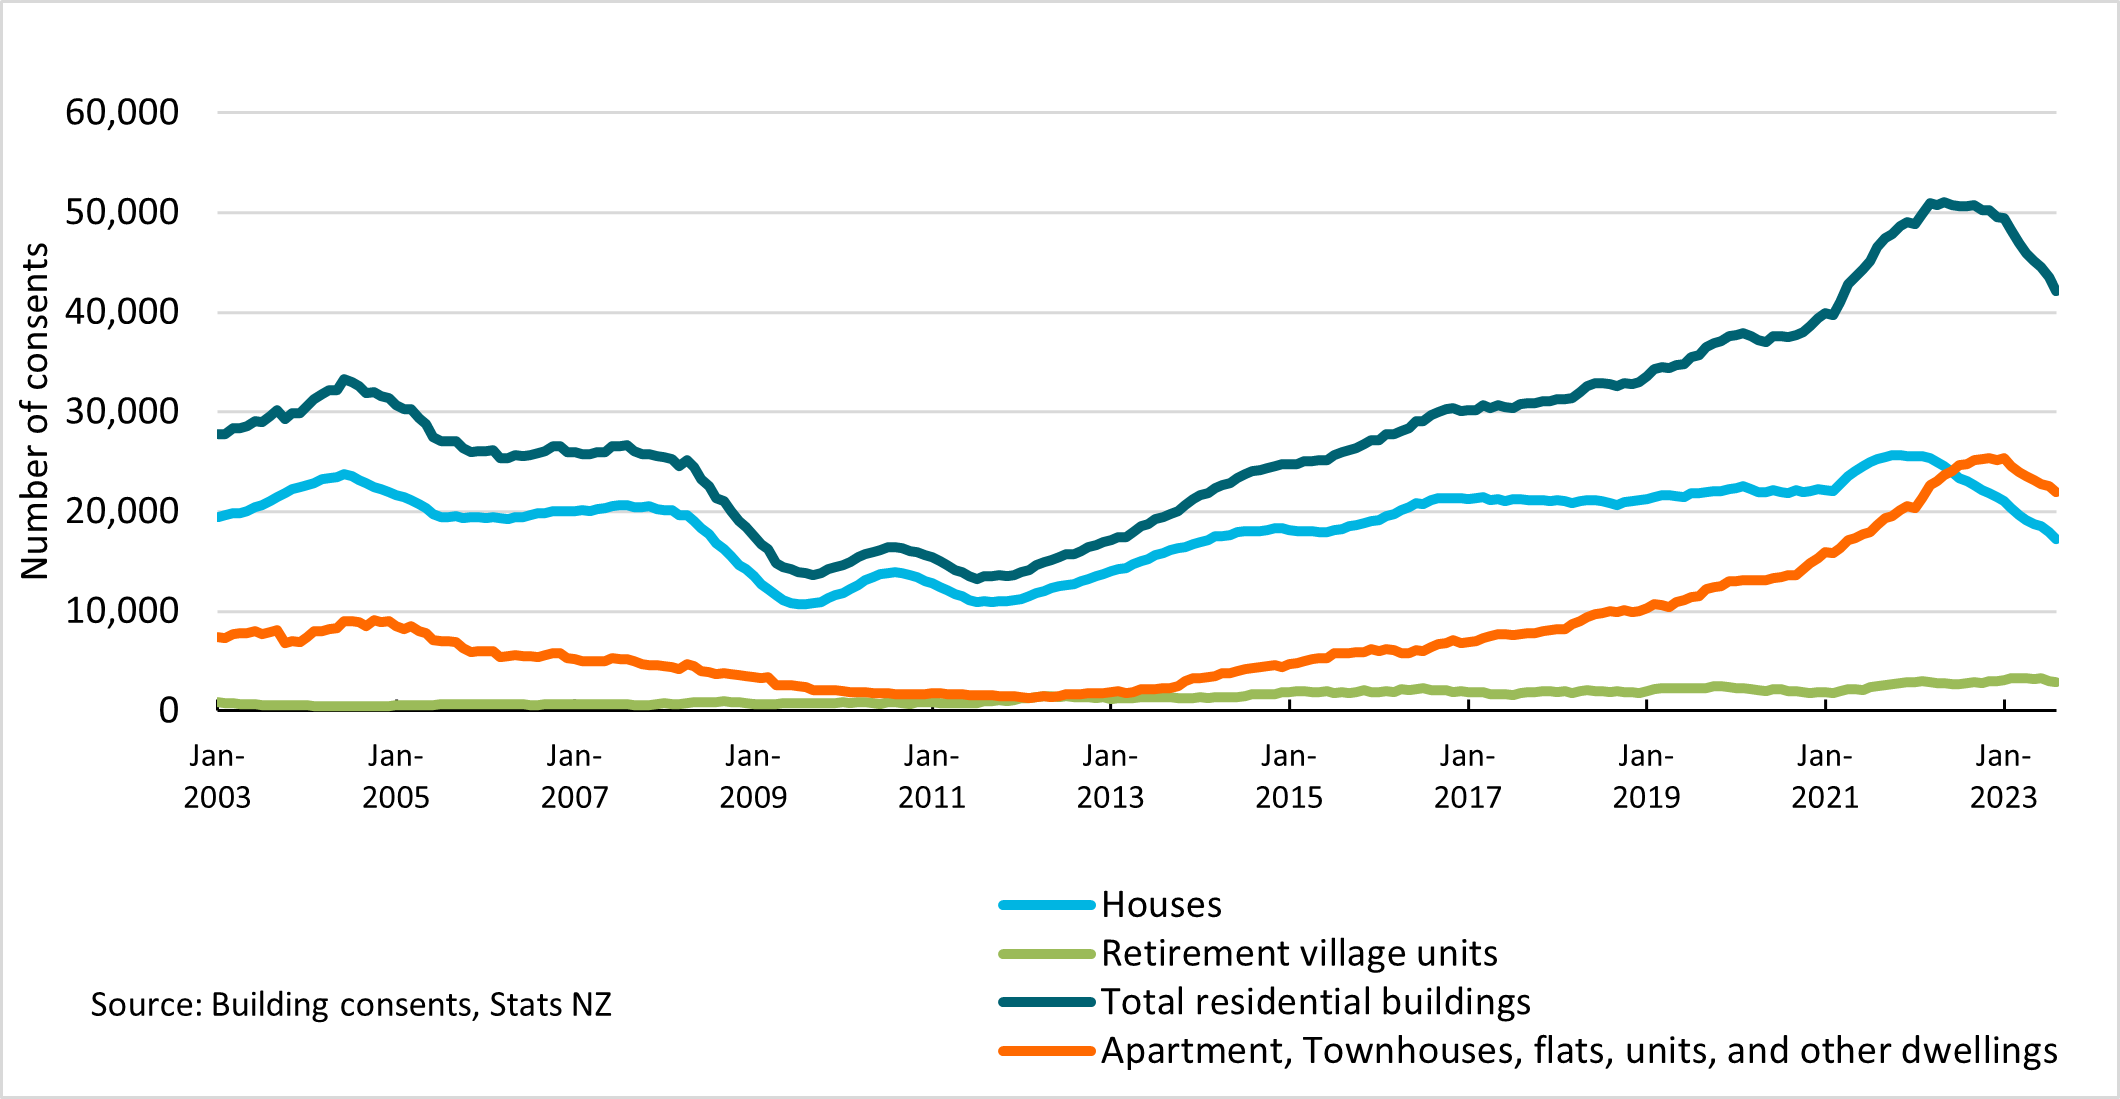
This is illustrated in Figure 10, which shows a decline in annual new home consents since the record high of 51,015 consents recorded in the year to May 2022. The number of new home consents has now returned to a similar level observed in 2021, where a total of 44,331 new homes were consented.
Stats NZ data on Code Compliance Certificates estimated the number of completions issued for the year ended March 2022 at approximately 36,000 dwellings (Stats NZ, 2022). This is below the current level of 44,429 new dwellings consented. This suggests a healthy pipeline of work for the construction sector in the short and medium term.
For the year ended June 2023, 44,529 new homes were consented nationwide, representing a year-on-year decline of 12.2% from the 50,736 consents issued in the year to June 2022. This downward trend persisted in the September 2023 quarter, marking the fourth consecutive quarter with a decrease in both the number of stand-alone houses and the number of multi-unit homes consented (Stats NZ, 2023f).
Figure 10: New residential dwellings consented
Text description for Figure 10
The ongoing nationwide shift towards multi-unit dwellings remains evident.
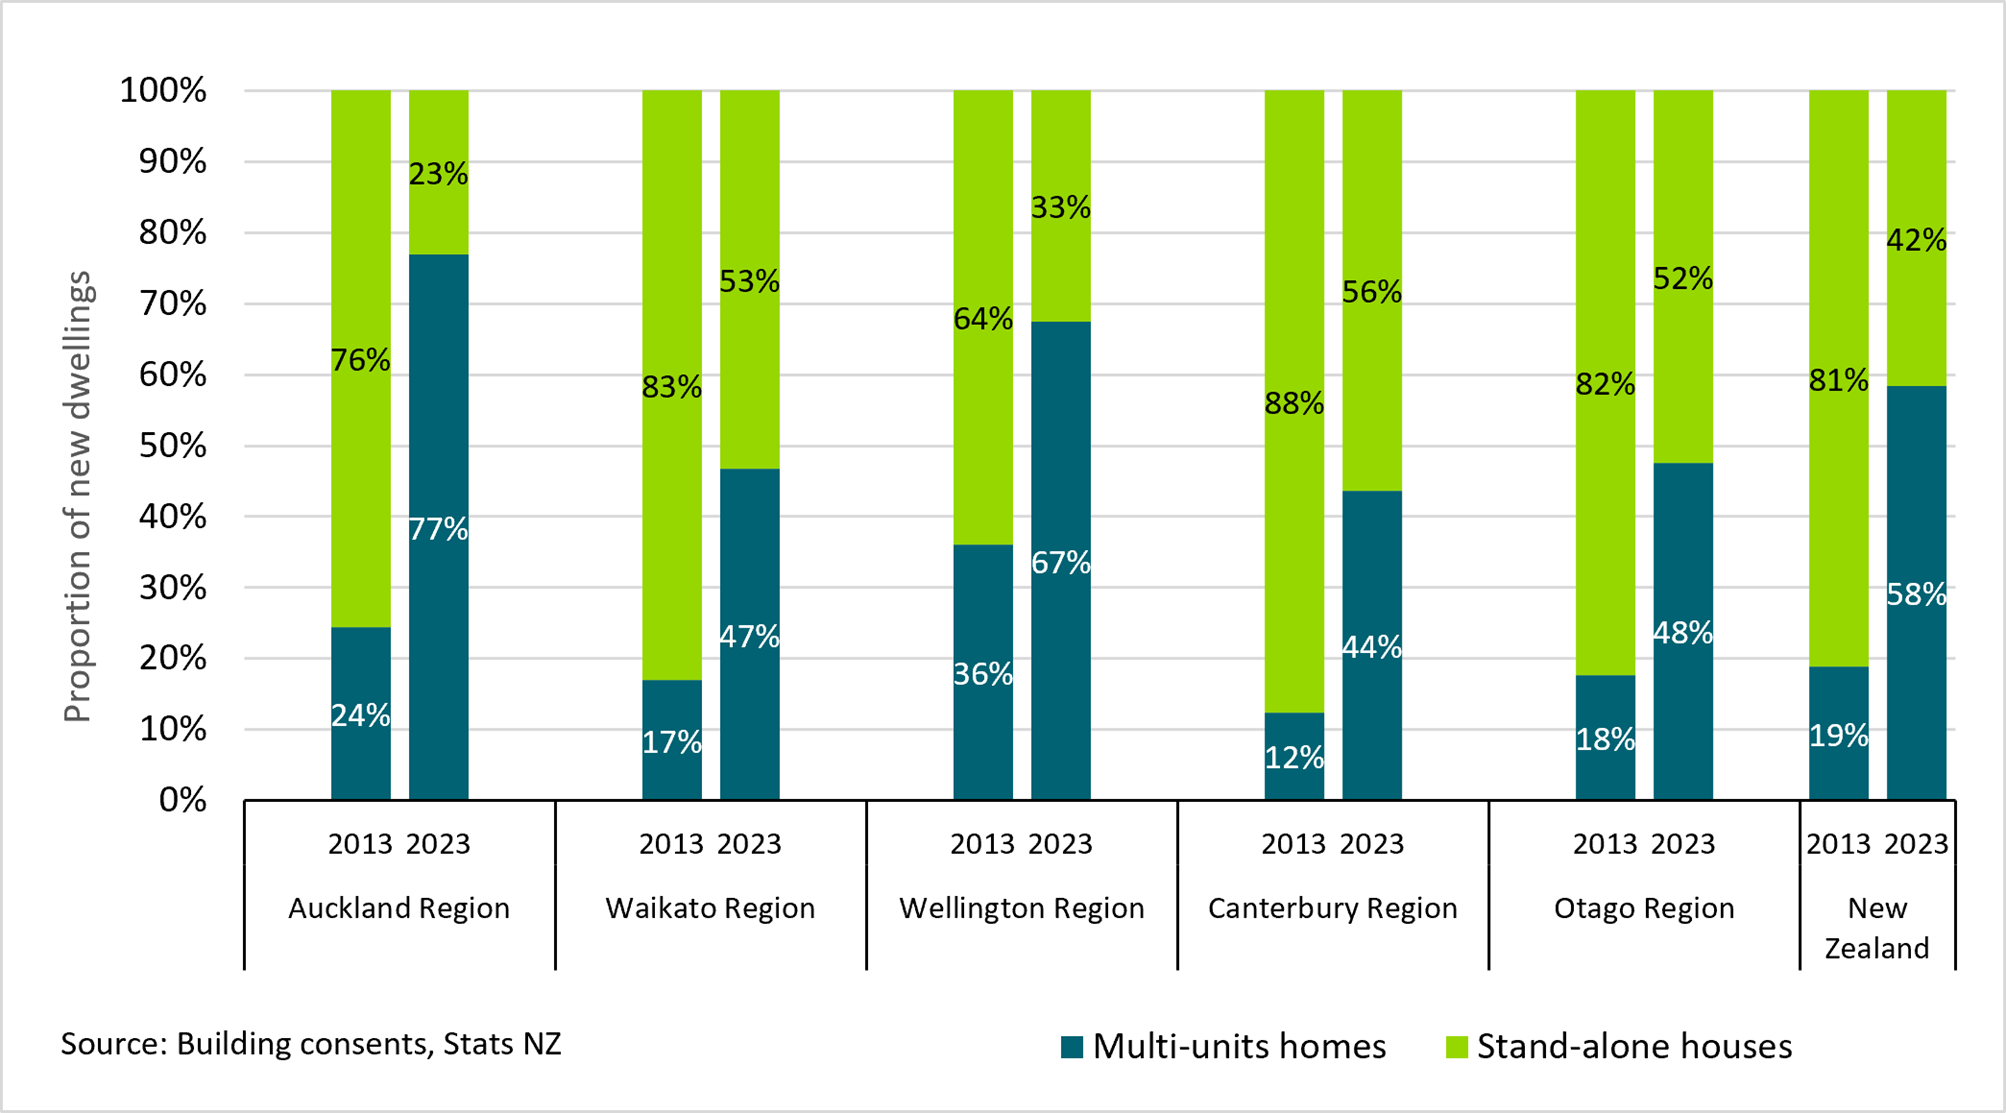
From 2013 to 2023, there has been a significant shift towards multi-unit homes in New Zealand. Figure 11 illustrates how the proportion of stand-alone houses decreased from 81% to 42% of new dwellings consented, while the proportion of multi-unit homes increased from 19% to 58%. The annual number of multi-unit homes consented surpassed stand-alone houses in the March 2022 quarter since the series began. Over the past decade, the number of townhouses, flats and units consented has more than tripled, growing from 3,550 in the year ended June 2013 to 26,031 in the year ended June 2023.
Figure 11: New dwellings consented by building type (year ended June 2013-2023)
Text description for Figure 11
Growth in the value of non-residential building activity has outpaced that of residential building activity.
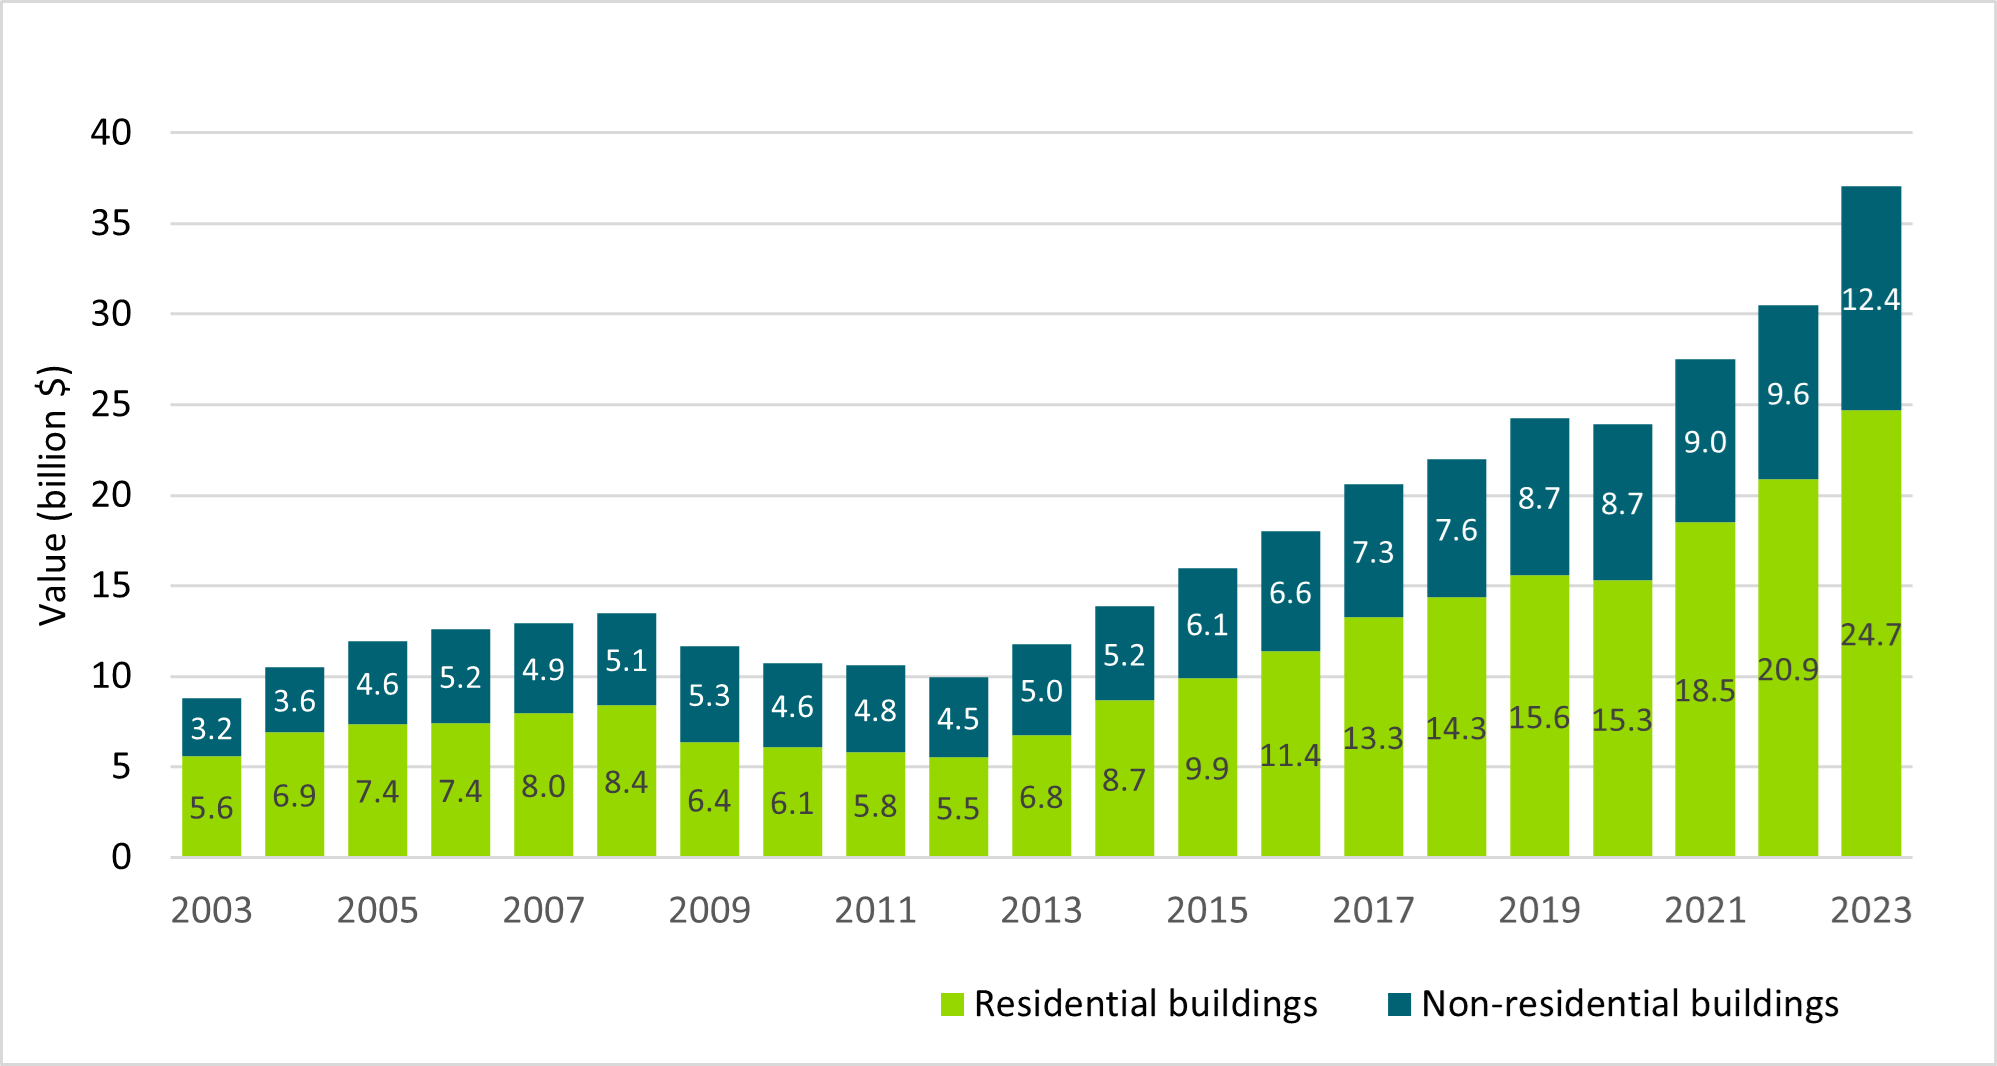
The value of residential building work put in place increased 12.5% in the year to June 2022, and 18.5% in the year to June 2023. However, the value of non-residential building work put in place shows stronger growth, increasing by 7.3% in the year to June 2022, compared to 28.3% in the year to June 2023 (Stats NZ, 2023g).
Figure 12: Annual value of residential and non-residential building work put in place (year ended June 2003-2023)
Text description for Figure 12
Non-residential building consent values also remain high, up 14.7% over the 12 months to June 2023. Hotel and hostel consent values have declined by more than half in the year to June 2023, indicating a reduced investment in tourism-focused assets. This decline has been offset by increases in other building types including hospitals (up 67%), warehouses (up 46%), and office and transport buildings (up 29% over the same period). These trends highlight the government’s emphasis on social infrastructure and the private sector’s efforts to strengthen local supply chains in the past few years.
Expectations for continued high infrastructure investment remain strong. Te Waihanga / New Zealand Infrastructure Commission’s Rautaki Hanganga o Aotearoa – New Zealand Infrastructure Strategy 2022–2052 (New Zealand Infrastructure Commision, 2022) committed an additional $61.9 billion investment over the next 5 years. Despite these expectations, completed infrastructure projects have been limited, declining by 3.6% in the June quarter following a previous drop of 4.2% in the March 2022 quarter.
The infrastructure pipeline shows strong growth, which may offset the slowing demand in the residential sector.
In the May 2023 Budget, the New Zealand government allocated approximately $71 billion for public infrastructure spending over the next 5 years, including for schools, hospitals, public housing, and rail networks (New Zealand Government, 2023).
Annual total government Gross Fixed Capital Formation on infrastructure reached $17.3 billion in 2022, marking the highest level in real terms in 20 years. Between 2015 and 2022, public sector investment in non-building construction and land improvements more than doubled in real terms, reaching $11.1 billion (Stats NZ, 2023e).
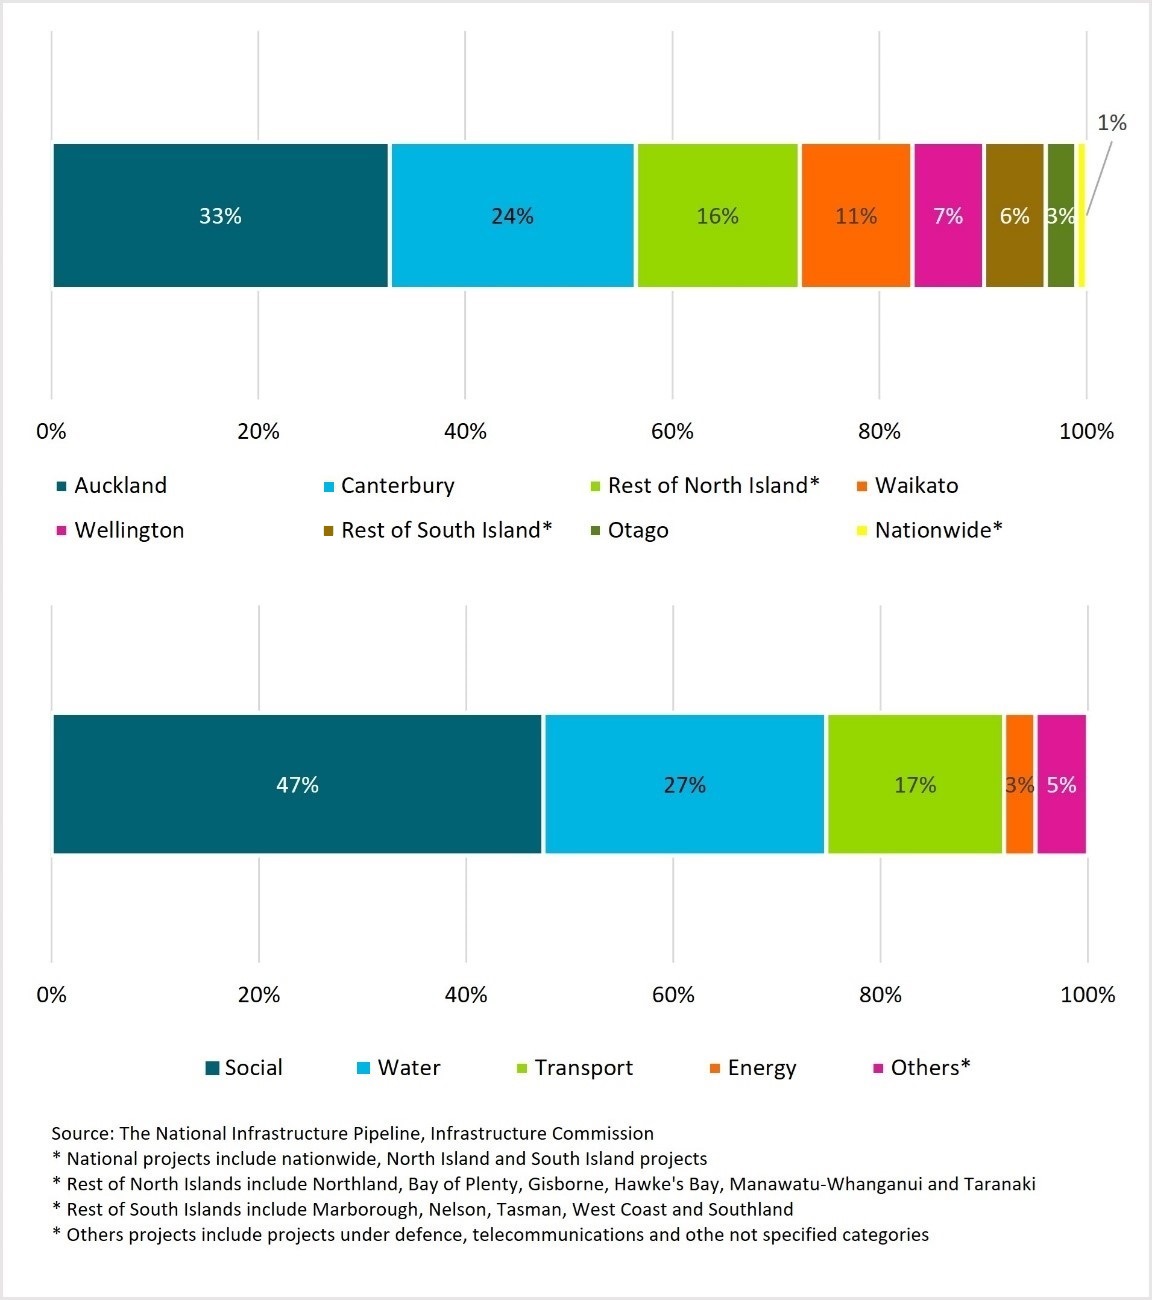
The New Zealand Infrastructure Commission estimates the current infrastructure pipeline to be $65 billion encompassing 2,588 ongoing and planned projects. Figure 13 shows that approximately 33% of this investment will be directed towards Auckland, while Canterbury is projected to receive 24% of the funds. At the regional level, 16% of the investment will be allocated to Hawke’s Bay, Gisborne, and Northland, reflecting the infrastructure needs arising from Cyclone Gabrielle recovery efforts. Nearly 50% of the pipeline focus on social infrastructure projects such as social housing, education, and healthcare facilities.
The Infrastructure Pipeline also shows significant spend in the social sector, accounting for 47% of total projects. These social infrastructure projects include 42% on housing, 20% on health infrastructure, 20% on education facilities, and 14% on community facilities. (Infrastructure Commission, 2023b)
Figure 13: Infrastructure projects by region and sector (June 2023 quarter)
Text description for Figure 13
The North Island weather events in January/February 2023 caused extensive damage, with the Treasury estimating the total cost of repairs to range between $9 billion and $14.5 billion.
Over half of this damage have affected public infrastructure, particularly water, electricity, and transportation systems. Damage to residential property (insured and uninsured) is estimated to be between $2 billion and $3.5 billion (The Treasury, 2023c).
Extreme weather events resulted in insurance claims exceeding those of the Kaikoura earthquake.
As of June 2023, the Insurance Council reported that $1.08 billion had been paid out in claims, representing an estimated 34% of the total $3.18 billion worth across 107,569 claims. This surpassed the total claims incurred for the Kaikoura earthquake in 2016, which amounted to around $2.27 billion (Insurance Council of New Zealand, 2023).
In the aftermath of the North Island weather events of January 2023, Rapid Impact Assessment data (as of 1 June 2023) revealed 8,675 placards were issued, indicating the extent of damage sustained by affected properties. Of these properties, 5.7% were red-stickered, deemed high-risk due to extensive damage and prohibiting entry, while 38.5% were yellow-stickered, posing moderate risk and restricting access (MBIE, 2023a).
Impact from economic uncertainty and financial stress continues but shows signs of easing
Higher costs alongside supply chain issues, labour challenges, and cashflow concerns have intensified pressures within the construction industry. A survey by the New Zealand Institute of Economic Research (NZIER, 2022) revealed that 38% more builders reported an increase in overdue debtors (customers who have not paid their invoices by the due date) in the 3 months to June 2022, compared to those who reported a decrease. This represents the highest level recorded since 2009, indicating growing financial stress within the industry.
Furthermore, the NZIER survey reported a net 55% of firms anticipate further increases in overdue debtors over the next 3 months, exceeding the peak observed during the Global Financial Crisis. This indicates a deepening concern among construction businesses regarding their financial stability.
However, amidst these challenges, the latest Quarterly Survey of Business Opinion June 2023 by NZIER suggested a slight improvement in business confidence within the building sector. The survey found a decrease in the number of businesses anticipating a weaker outlook for the coming months, 59% compared to 76% in the previous quarter (New Zealand Institute of Economic Research, 2023). This suggests a modest decrease in pessimism within the sector.
While business confidence in the sector has improved slightly, concerns persist over rising insolvencies due to finanical stress.
The number of construction businesses declared insolvent jumped to 418 in the year ended June 2023, from 210 over the previous 12 months, according to insolvencies data from the Company Office. In the year to June 2023 construction insolvencies comprised 23.5% of all insolvencies, the highest proportion since 2020.
High material and labour costs, supply chain disruptions and skills shortages remain as nagging challenges for the sector.
These challenges are causing construction costs to rise faster than expected. In the June 2022 quarter, the value of building work put in place increased by 19% compared to the previous year. However, once cost increases are removed, the underlying growth in construction volume was only 3.4% over that period. In the June 2022 quarter, non-residential construction costs rose 3.6%, residential construction costs increased 4.2%, and civil construction costs jumped 5.4% from the previous quarter.
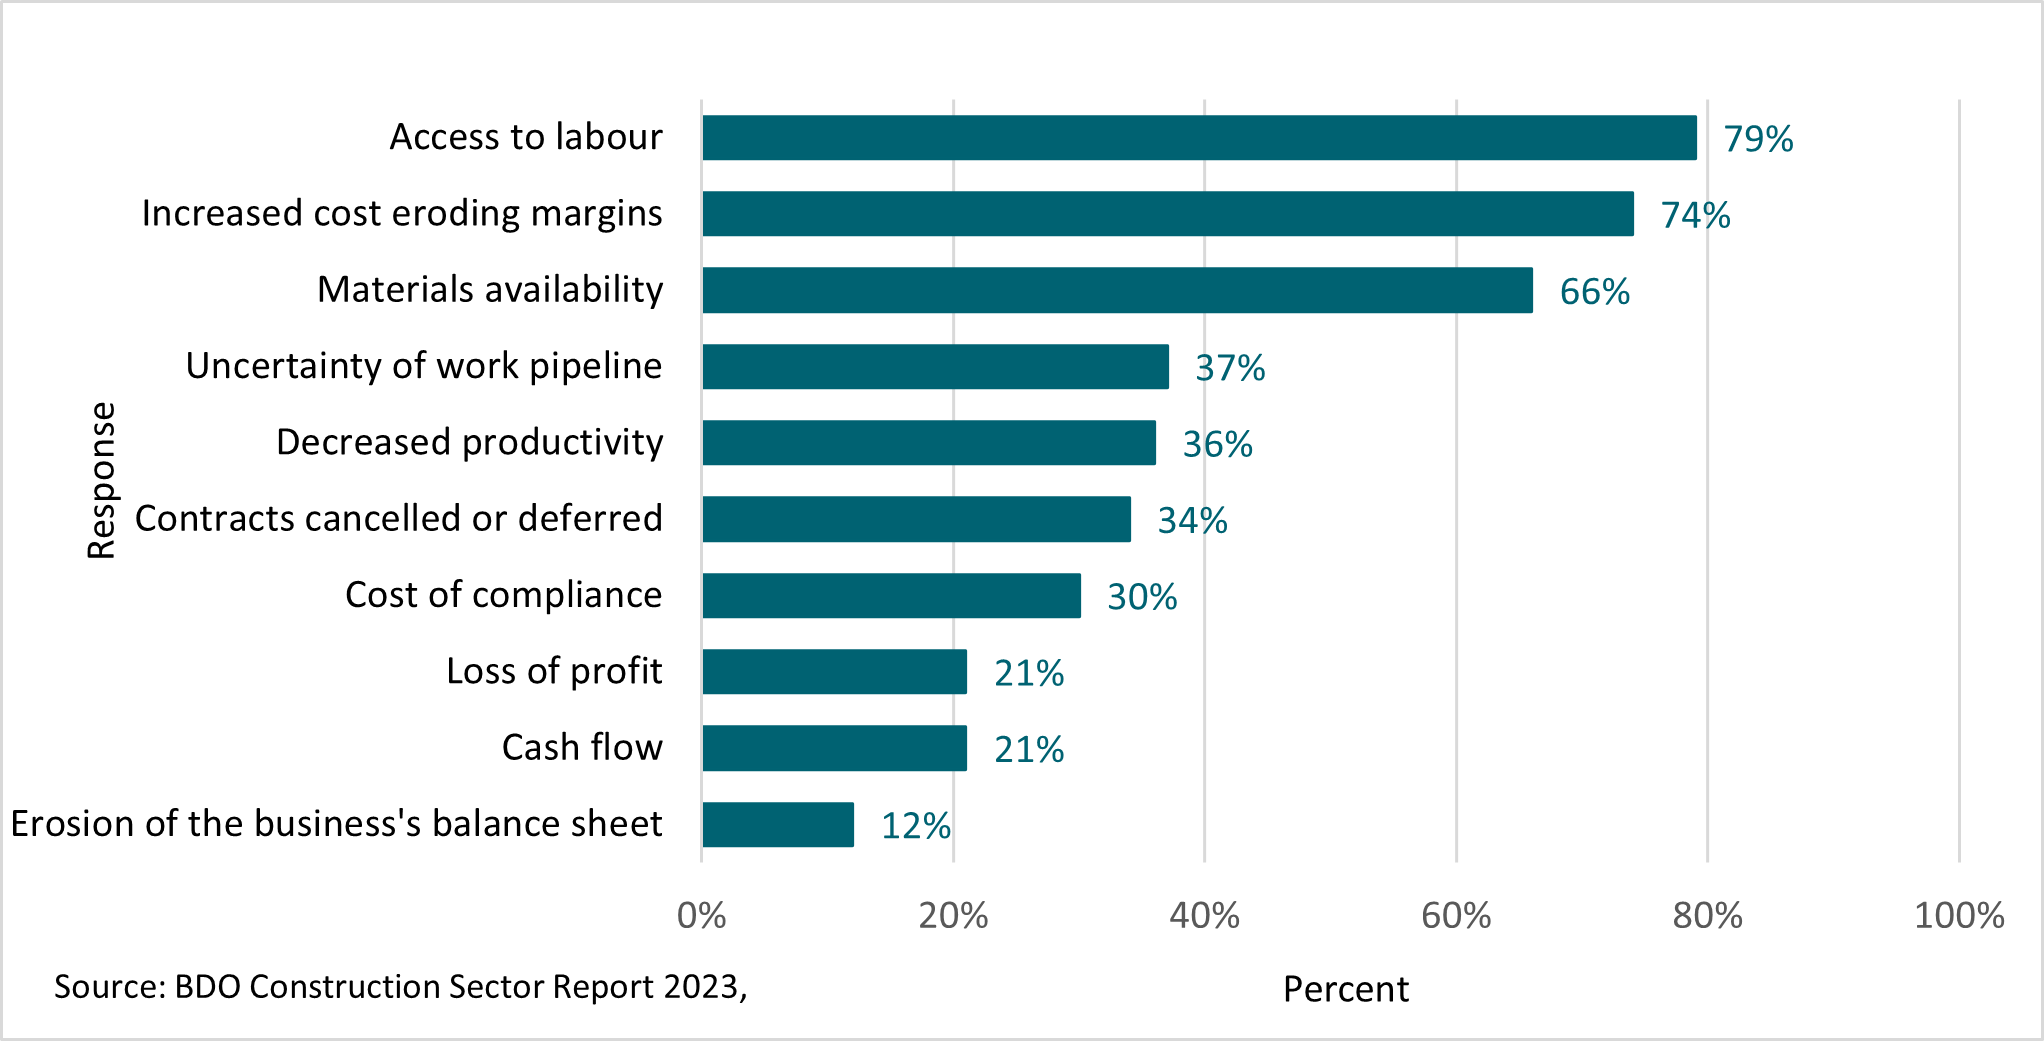
The BDO Construction Sector Report 2023 found that cost escalation, supply chain disruptions, and skills shortages are the three most pressing challenges facing the sector (see Figure 14). Finding skilled labour is particularly an ongoing challenge.
Figure 14: What have been the biggest adverse impacts on your business this year?
Text description for Figure 14
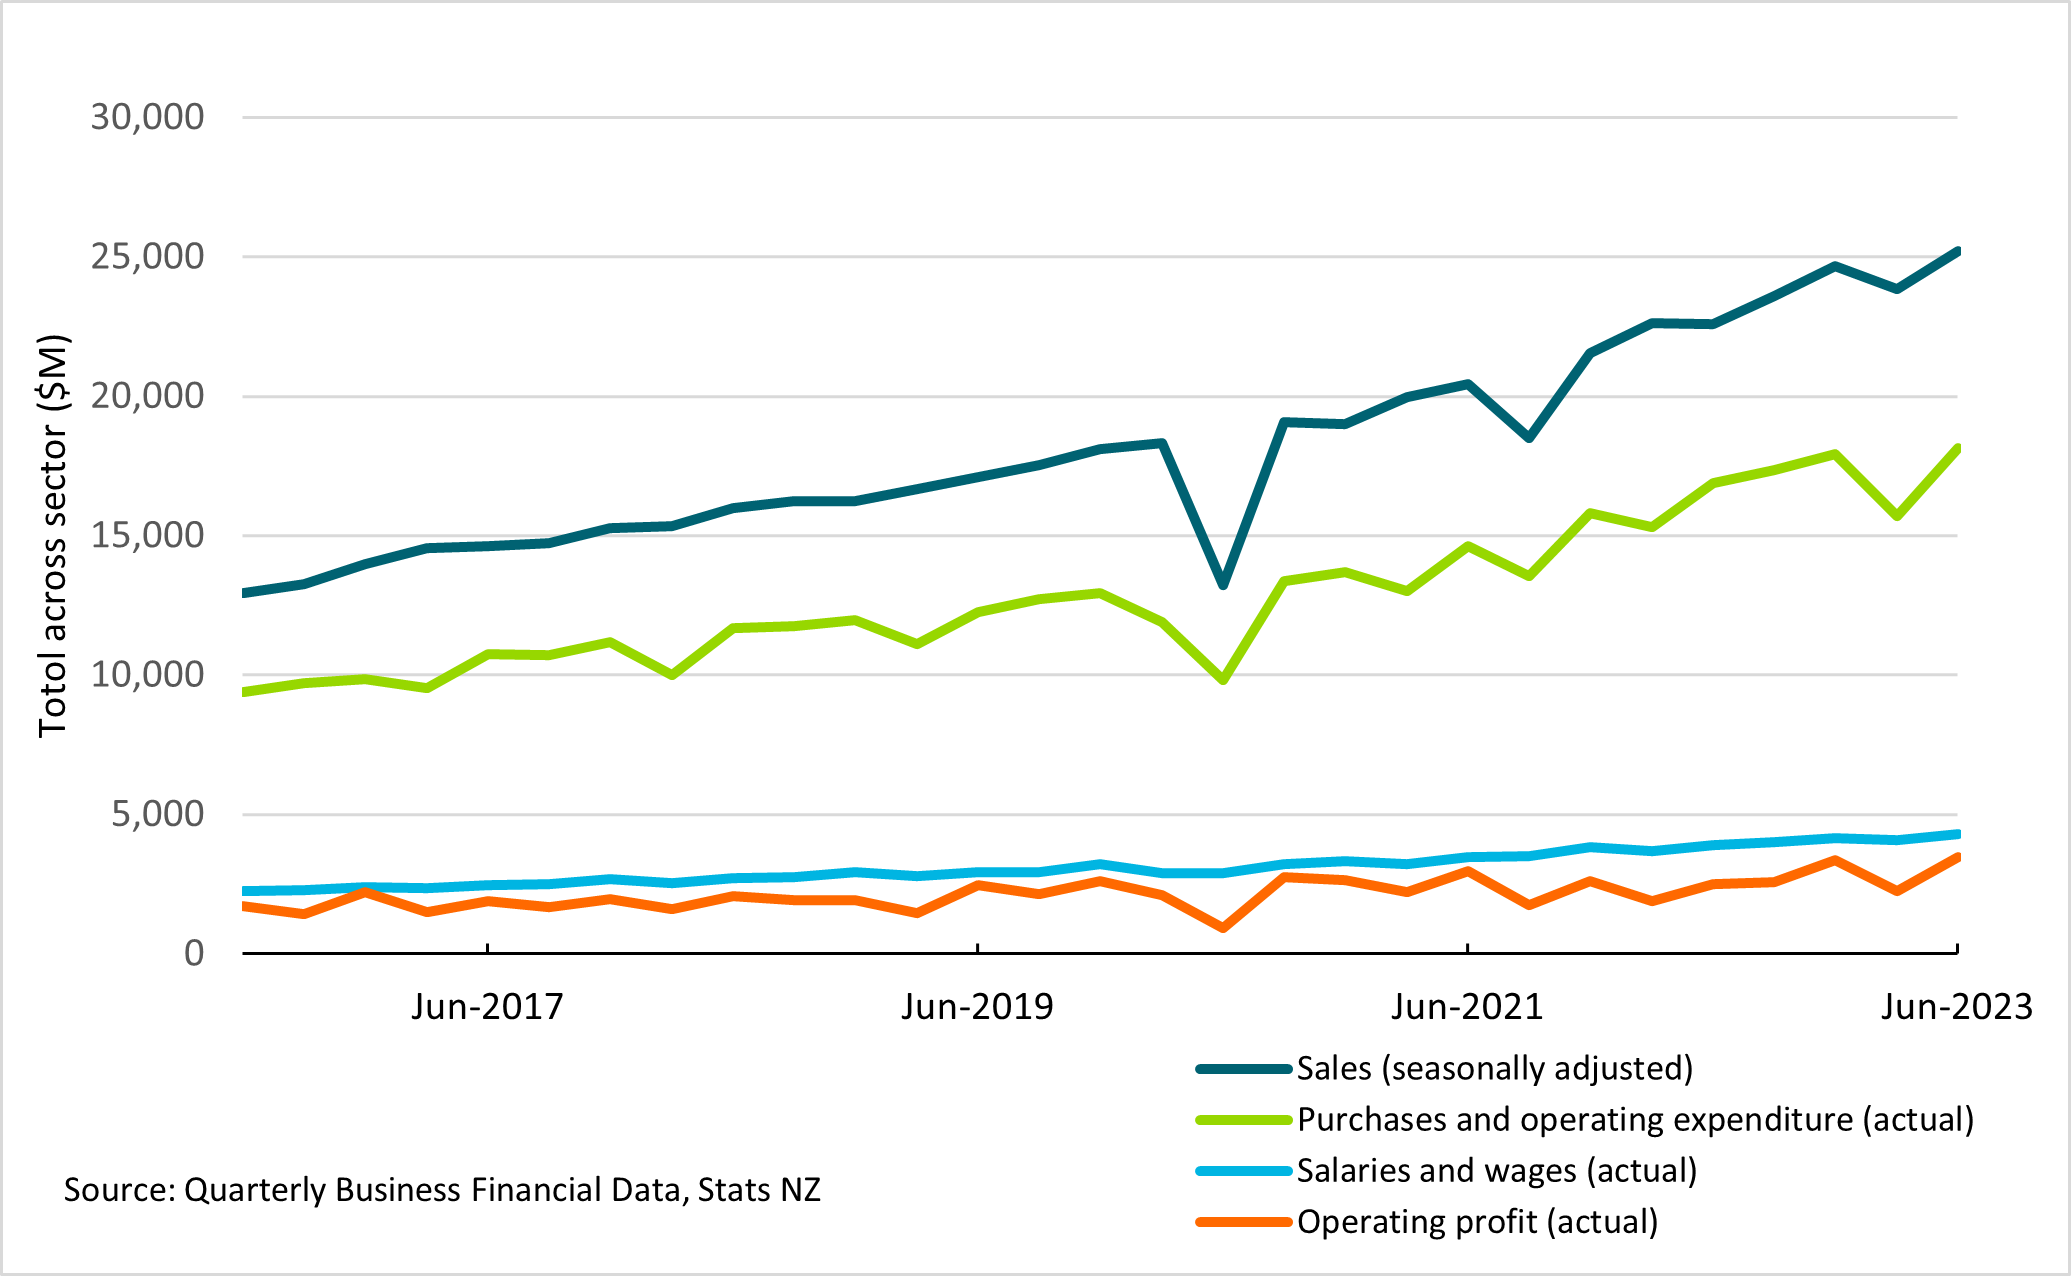
Rising costs for building materials and labour are eroding the profit margins of construction companies. As illustrated in Figure 15, total sales in the construction sector reached $25 billion in June 2023 quarter, representing a 11.7% increase from the June 2023 quarter. However, actual purchases and operating expenditure also surged by 7.6% and salaries and wage rose 11% in the June 2023 quarter, compared to the June 2022 quarter.
Figure 15: Quarterly business financials for construction sector
Text description for Figure 15
Smaller construction businesses are being impacted by higher operating expenditure more severely than larger businesses. The operating profit growth for small construction businesses, with one to 19 employees, dropped by 23.7% between 2021 and 2022. Medium-sized businesses, with 20 to 99 employees, also experienced a decline in growth, although less severe, at 12%. Meanwhile, large businesses, with over 100 employees, managed to achieve a moderate growth rate of 3.6% (Stats NZ, 2023h).
However, there are signs that inflationary pressures may be easing, particularly in the construction sector. A recent ANZ Business Outlook survey (ANZ, 2023) found that only a net 36% of construction companies anticipated rising prices in the following 3 months, down from a net 47% in the previous month and over a net 90% a year ago (ANZ, 2023).
The cost of construction materials continues to rise, but at a slower pace.
Figure 16 shows that between March 2013 and March 2023, construction input prices increased 22%, while output prices increased by 33% respectively, both grew faster than the overall Consumer Price Index (CPI) of 6% over the same time period (Stats NZ, 2023i).
The annual price of building a new house went up 7.8% in the year to June 2023, slowing from 11.5% in the year to March 2023 (Stats NZ, 2023j). The rate of growth is markedly lower than the 18.3% rise seen in mid-2022, as supply disruptions continue to ease and demand on the sector slows down.
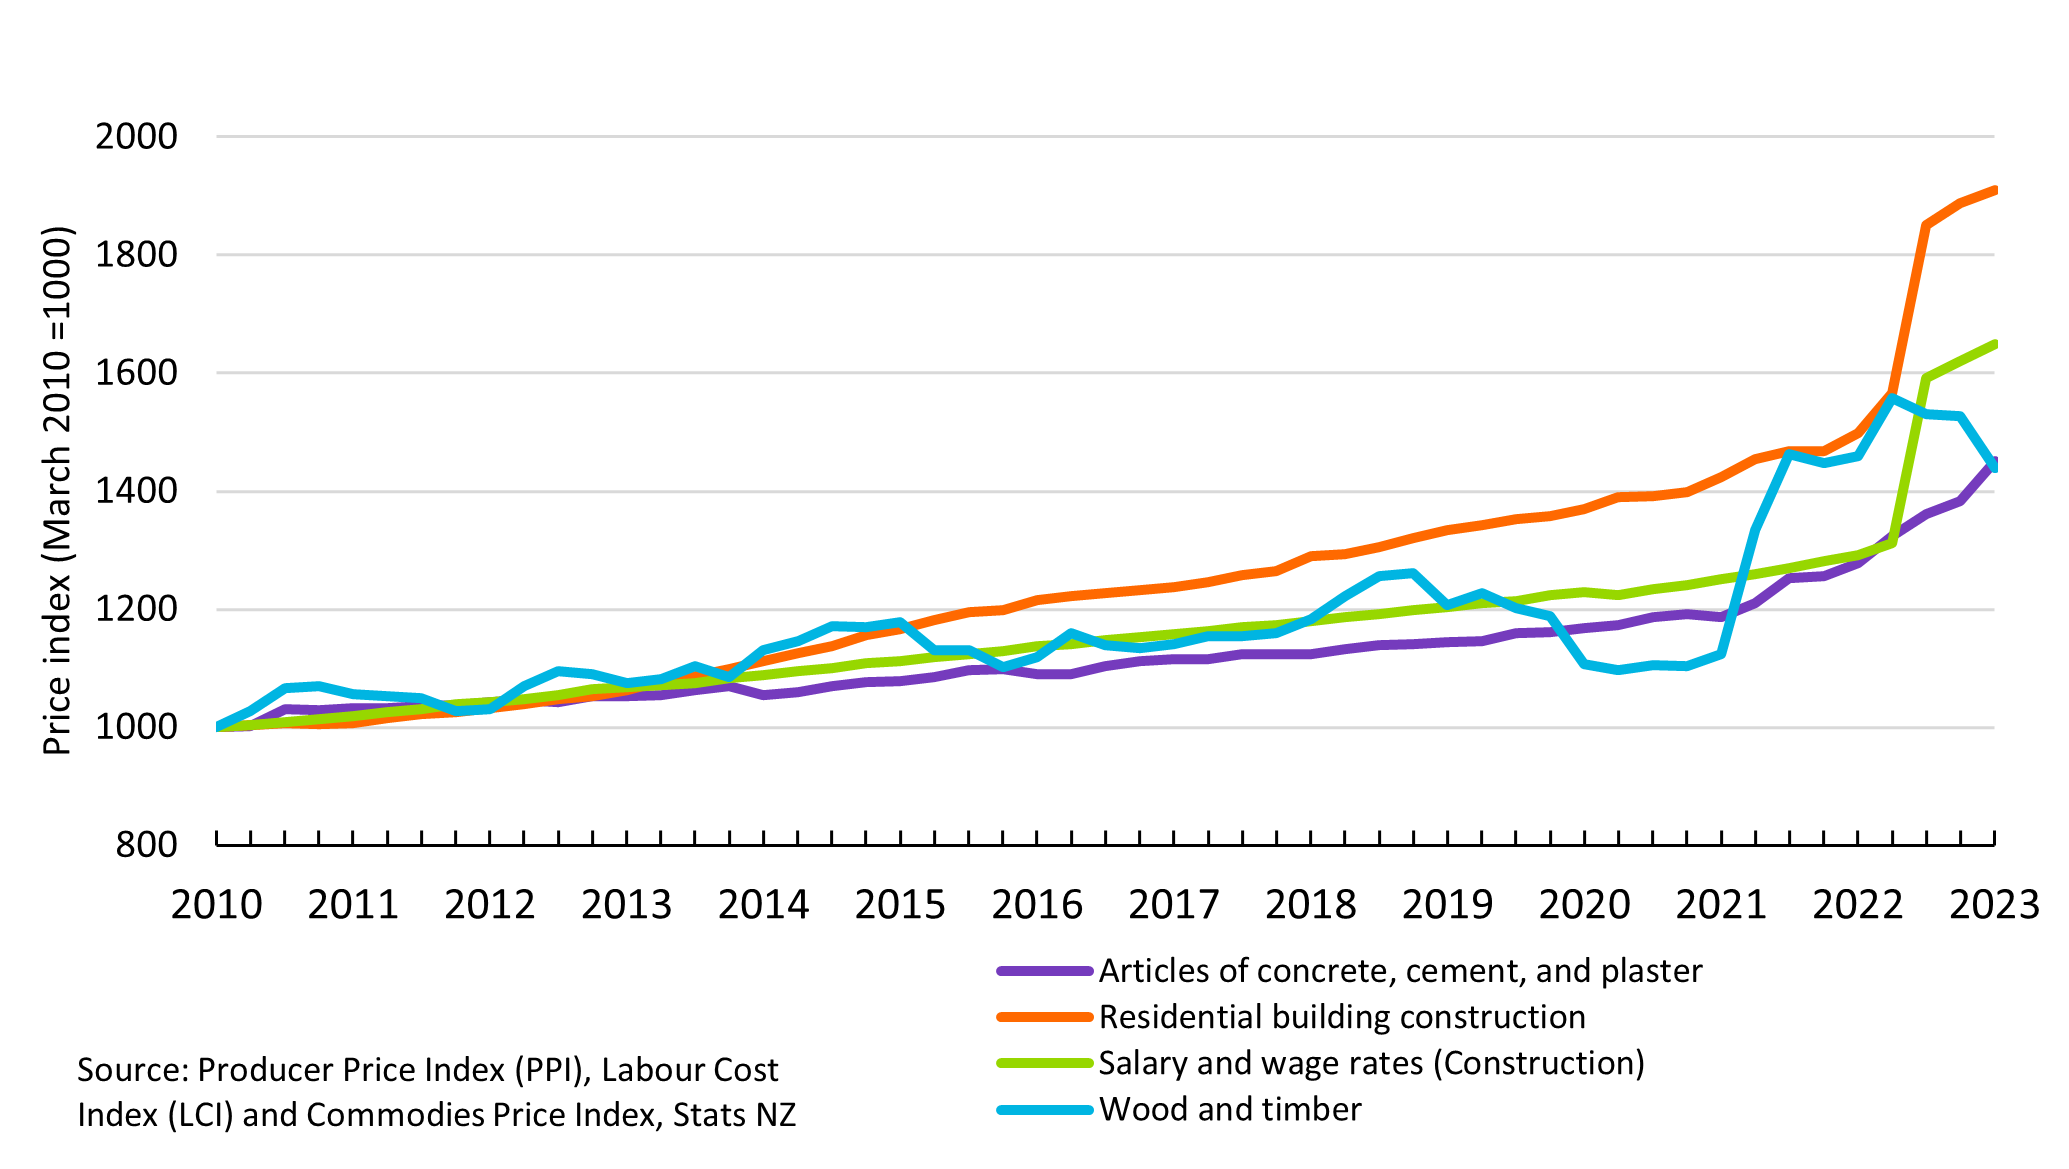
Figure 16: Residential construction cost price indices
Text description for Figure 16
For the year ended June 2023, the costs of wood and timber decreased by 9% due to easing pandemic-related supply shortages and a slowdown in the building boom. The latest Cordell Construction Cost Index shows overall construction costs increased by 0.6% in the June 2023 quarter, a significant slowdown from the average quarterly increases of 2.0% experienced in 2021 and 2022 (CoreLogic, 2023).
This moderation in cost growth is reflected in the annual growth rate of construction costs, which has dipped from a record high of 10.5% to 8.8% in the 3 months to March 2023. The rising interest rates, which have contributed to a drop in the number of new home consents, have also played a part in easing the demand pressures in the construction sector.
Construction labour costs rose faster than all industry’s average.
The Labour Cost Index (LCI) for construction industry wage and salary workers increased by 4.2% for the year ended June 2023 compared with 3.4% growth for all industries (Stats NZ, 2023b).
The average hourly rate (including overtime) for construction industry workers was $36.88 in the June 2023 quarter, an increase of $2.89 (or 8.5%) from the hourly rate of $33.99 in the June 2022 quarter. This growth outpaces the national hourly rate increase of 6.9% over the same period (Stats NZ, 2023b).
Supply constraints on construction materials seem to be easing but material costs are still rising.
The availability of crucial materials like plasterboard has improved, as evidenced by the 1.1 million square metres of plasterboard and related products imported into New Zealand in the year ended June 2023, up 76.9% compared with the year ended June 2022. The monthly volume of plasterboard and related products imported has continued to decrease from its peak of 997,222 square metres in September 2022, indicating a return to normalcy in plasterboard supplies. Timber prices have also stabilised to some extent, and metal components are showing a similar trend of price stabilisation.
Despite the easing of supply constraints, cement and concrete prices have continued to climb since 2021, leading to higher production costs. Cement production costs rose 6% year-on-year in the June quarter, following a 6.5% increase in 2022, according to Statistics New Zealand’s Production Price (input) Index (Stats NZ, 2023k). The recent surge in demand for cement and concrete in infrastructure projects may have contributed to the price increase.
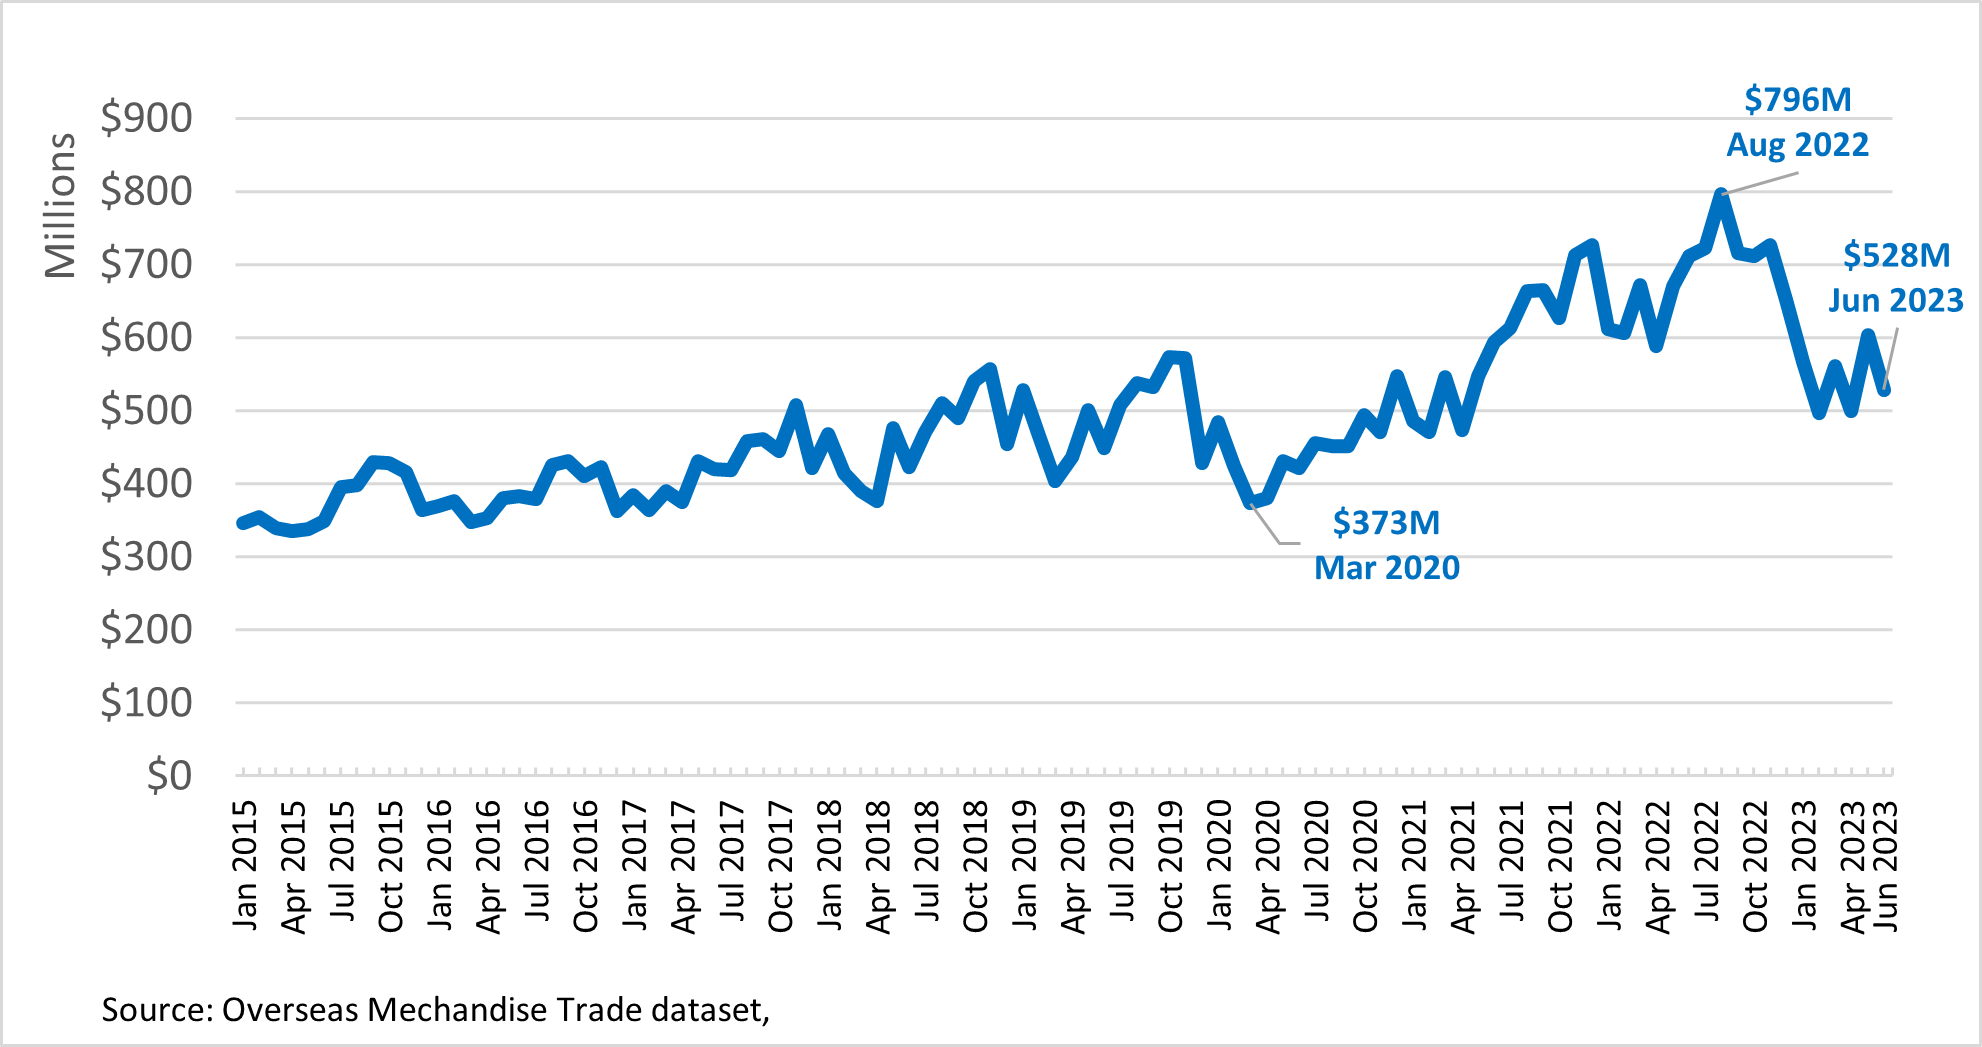
Figure 17 illustrates that the estimated value of building and construction products imported into New Zealand has fallen from a record high last year. In August 2023, building and construction goods accounted for a total import value of nearly $800 million (Stats NZ, 2023l). On average, the estimated value of imports for building and construction goods accounted for approximately 7 to 8% of total imports for each month.
Figure 17: Estimated value of imports of building and construction products (January 2015 – June 2023)
Text description for Figure 17
Shipping costs to Australia and New Zealand are showing signs of easing. Approximately 90% of all construction products sold in New Zealand are imported from overseas (EBOSS, 2021b). China is the top country from which building and construction products are imported. An analysis conducted by Infometrics suggested that shipping costs from China to Australia and New Zealand have barely fallen from their record highs in January 2022, with the index down by just 8.9% in September 2022 (Glynn, 2022).
The construction sector continues to face challenges related to productivity.
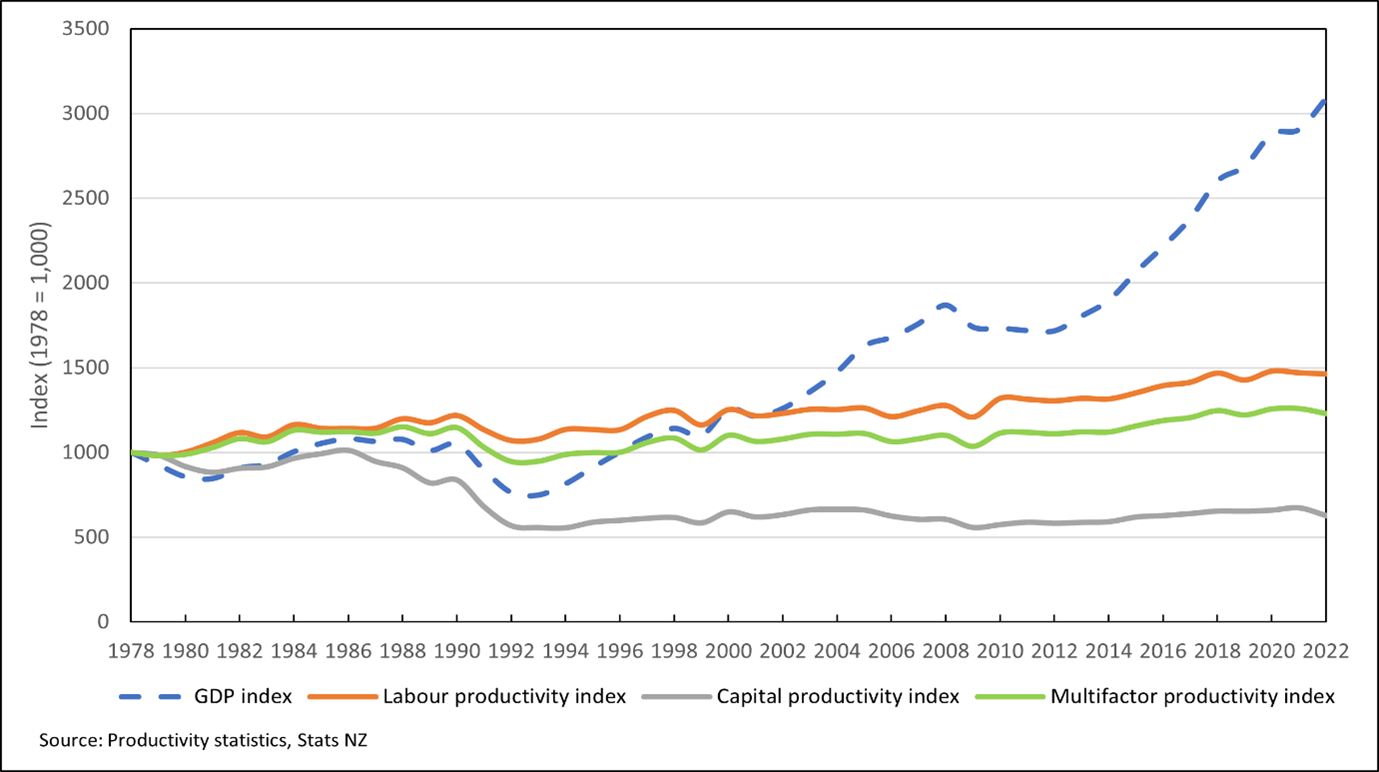
The construction industry lags behind other sectors in achieving sustainable, strong productivity growth over time. Industry-level productivity data (Figure 18) shows that construction sector productivity increased relatively slowly between 2020 and 2023 (Stats NZ, 2023m). Labour productivity grew at a rate of 0.5% per annum during this period, placing construction among the lowest-performing sectors. Similarly, multifactor productivity [3] in construction increased at an annual rate of 0.4%, which is higher than many other industries but substantially lower than the other goods-producing industries.
Figure 18: Productivity Index for construction sector (1978-2022)
Text description for Figure 18
The New Zealand Institute of Building conducted a study to investigate the underlying reasons for the construction sector’s relatively poor productivity compared to other industries. Their findings revealed that the sector’s low productivity stems from a complex set of entrenched behaviours and practices related to business and regulatory processes, rather than on-site construction practices. Moreover, the study identified relatively low rates of innovation and high injury rates as contributing factors to the sector’s productivity challenges (New Zealand Institute of Building, 2021).
The construction sector is one of the largest employers in New Zealand, but it also has a significant proportion of workplace-related illness and accidents.
The construction industry consistently ranks among the highest for work-related injuries and illnesses. For the 12 months to May 2023, WorkSafe New Zealand reported that there were 6,252 work-related injury claims resulting in more than a week away from work, up 7% from the previous 12 months. The injury incidence rate for the construction industry reported by Stat NZ’s injury statistics 2022, has remained relatively stable since 2017, with 135 claims per 1,000 FTE employees in 2022. This places the construction sector behind agriculture, forestry, and fishing (149 claims per 1,000 FTEs) and manufacturing (152 claims per 1,000 FTEs), but still significantly higher than the industries’ average of 72 claims per 1,000 FTEs. This is despite the construction industry having the highest number of claims since 2022, reflecting its steady employment growth since 2018 (Stats NZ, 2023n).
The physical demands of the job such as heavy lifting, repetitive motions, and working at heights can create hazards for construction workers. WorkSafe New Zealand’s work-related injury data has identified muscular stress while lifting and carrying or putting down objects as the construction industry’s most common injury, accounting for 25% of all work-related injuries in the sector. From June 2022 to May 2023 there were 1,590 muscular stress injury claims in the sector for lifting and carrying or putting down objects, an average of 132.5 claims per month. Compared to the previous 12 months, the number of muscular stress claims increased by 6.8%.
Between June 2022 and May 2023, data from WorkSafe’s Fatalities Register found that construction sector had the country’s third most work-related deaths, behind the transport, postal and warehousing, and the agriculture sectors. During this period, there were a total of 11 work-related deaths in the construction industry, an increase of 1 compared to the previous 12 months. Of those 11 fatalities, 5 incidents involved falling from heights, 5 involved vehicle incidents, and 1 involved being struck by a falling object. 8 cases involved people over 55 years old.
Mental health and wellbeing are also critical concerns in the construction sector. In addition to physical risks, the demanding conditions of construction work can also contribute to higher levels of mental fatigue and stress. Research by MATES in Construction (MATES in Construction NZ, 2022) has revealed that construction workers are 6 times more likely to die from suicide than in a work accident. This translates to the construction industry losing nearly 1 person every week to suicide. Moreover, young men in the industry are twice as likely to die by suicide compared to young men working outside the construction sector.
Increased innovation is crucial to reducing greenhouse gas emissions from construction
The building and construction sector is a significant contributor to greenhouse gas emissions. Emissions are released during the production of building materials, the construction of buildings, and the energy consumed in buildings throughout their operation. In 2021, the sector was responsible for 11,555 kilotonnes (kt) of COe-2 emissions, based on a consumption-based approach including international trade – an increase of 5.3% from 2020.
Increased renewable energy use in electricity generation saw a decrease of 3.3% in operational emissions from 6,906 kt in 2020 to 6,677 in 2021. Emissions from the use of fossil fuels for heating and cooking also decreased slightly from 3,143 kt in 2020 to 3,101 in 2021.
However, strong residential and non-residential building activities in recent years have contributed to higher embodied emissions. There was a 20% increase in embodied emissions from the manufacture and transport of materials in the construction sector, from 4,067 kt in 2020 to 4,878 kt in 2021. This growth includes a 68% increase in net imported emissions and a 5.7% increase from transportation emissions.
Embracing technology’s potential offers a promising pathway to minimising the construction industry’s carbon footprint. This pathway lies in the development and implementation of environmentally sustainable products, methods, practices, and systems, effectively replacing traditional, carbon-intensive approaches.
Investment in construction research and development (R&D) is increasing, but still lags behind other industries in innovation expenditure.
This low level of investment hinders the development of a more productive and innovative sector. While the R&D expenditure for the sector has increased from $106 million in 2016 to $185 million in 2022, it still only accounts for a 4.4% of total business R&D expenditure in New Zealand, placing construction among the sectors with the lowest R&D investments (Stats NZ, 2023o).
According to Callaghan Innovation, significant efforts are necessary to achieve New Zealand’s vision of becoming a leading innovator in the construction industry within the Small Advanced Economies group and the Organisation for Economic Co-operation and Development (Callaghan Innovation, n.d.). To facilitate the adoption of innovation for business transformation, the country must address several critical challenges including slow productivity gains, a fragmented supply chain with minimal collaboration, and a general lack of awareness of emerging issues and opportunities among companies. Callaghan Innovation is collaborating with the industry to build a more collaborative, productive, innovative, and sustainable construction sector. Between 2021 and 2022, the number of construction businesses it supported has more than doubled, from 186 to 374.
Footnotes
[3] Multifactor productivity (MFP) reflects the overall efficiency with which labour and capital inputs are used together in the production process. Changes in MFP reflect the effects of changes in management practices, brand names, organisational change, general knowledge, network effects. (OECD,2023)