Our people


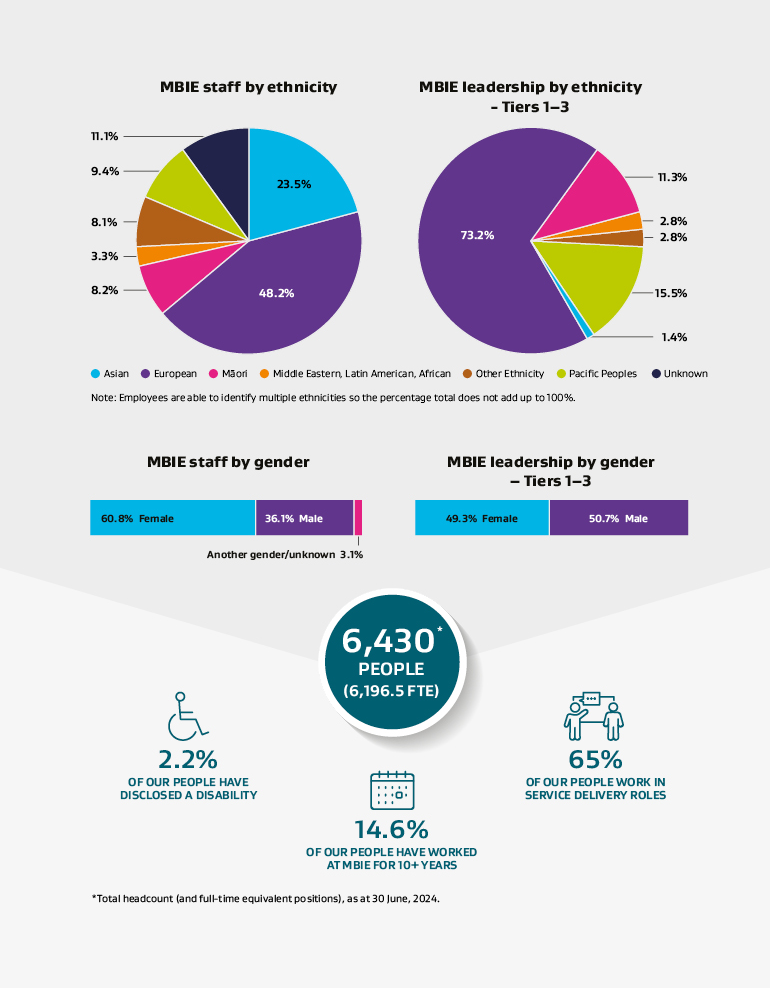
                        Text description for graph – MBIE staff by ethnicity 
                        
                            MBIE staff by Ethnicity 
Ethnicity 
30-Jun-24 
Percentage 
 
 
Asian 
1,511 
23.5% 
 
European 
3,100 
48.2% 
 
Māori 
525 
8.2% 
 
MELAA 
210 
3.3% 
 
Other Ethnicity 
523 
8.1% 
 
Pacific Peoples 
607 
9.4% 
 
Unknown 
716 
11.1% 
 
Total staff 
6,430 


Note: Employees are able to identify multiple ethnicities so the percentage total does not add up 100%


                        Text description for graph – Leadership by Ethnicity: Tiers 1 to3 
                        
                            Leadership by Ethnicity: Tiers 1 to 3 
Ethnicity 
30-Jun-24 
Percentage 
 
 
Asian 
1 
1.4% 
 
European 
52 
73.2% 
 
Māori 
8 
11.3% 
 
MELAA 
0 
0.0% 
 
Other Ethnicity 
2 
2.8% 
 
Pacific Peoples 
2 
2.8% 
 
Unknown 
11 
15.5% 
 
Total staff 
71 


Note: Employees are able to identify multiple ethnicities so the percentage total does not add up 100%


                        Text description for infographic – MBIE staff by gender 
                        
                            MBIE staff by Gender 
Gender 
30-Jun-24 
Percentage 
 
 
Another Gender/Unknown 
197 
3.1% 
 
Female 
3,912 
60.8% 
 
Male 
2,321 
36.1% 
 
Total staff 
6,430 


                        Text description for infographic – Leadership by gender: Tiers 1 to 3 
                        
                            MBIE leadership by Gender: Tiers 1 to 3 
Gender 
30-Jun-24 
Percentage 
 
 
Another Gender/Unknown 
0 
0.0% 
 
Female 
35 
49.3% 
 
Male 
36 
50.7% 
 
Total staff 
71 


                        Text description for infographic -– People working at MBIE 
                        
                             6,430  (total headcount as at 30 June 2024) people working at MBIE (6,196.5 FTE)
2.2% of our people have disclosed a disability 
14.6% of our people have worked at MBIE for 10+ years 
65% of our people work in service delivery roles 


Crown copyright © 2025


    https://www.mbie.govt.nz/about/who-we-are/corporate-publications/annual-reports/annual-report-2023-24/the-way-we-work/our-peoplePlease note: This content will change over time and can go out of date.