Financial commentary
This section of the annual report provides a commentary on MBIE’s 2022/23 financial results and a view of our forecast financial plans for 2023/24.
On this page
This commentary compares financial performance for the year with:
- the previous financial year, 2021/22
- the 2022/23 budget set in May 2022 as part of the Government’s Budget. This is referred to as Unaudited Budget
- the 2023/24 budget set in May 2023 as part of the Government’s Budget. This is referred to as Unaudited Forecast
Information is also provided in this commentary on non-departmental operations, where MBIE administeractivities on behalf of the Crown.
2022/23 departmental results
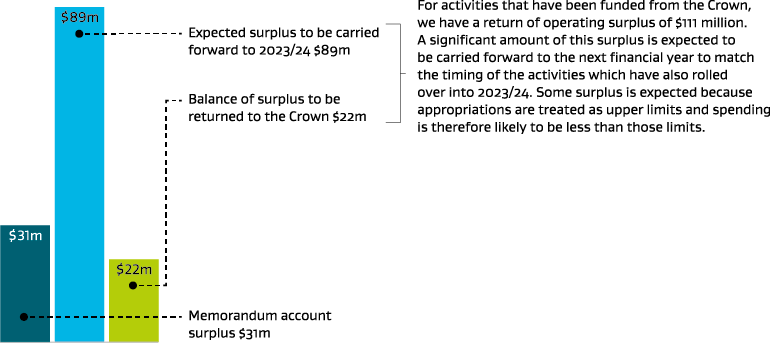
MBIE’s 2022/23 departmental activities are funded through 55 appropriations across 3 votes. In 2022/23 our revenue was $1,340 million and our expenditure $1,198 million. Across all our departmental activities we have incurred a net surplus of $142 million (2022: $43 million surplus).
Crown revenue has decreased from the prior year, largely driven by the operations for Managed Isolation and Quarantine (MIQ) facilities ceasing with the change in border regulations. Third-party revenue has however increased mainly due to the re-opening of borders to the rest of the world and the increase in immigration services. The increase in third-party revenue in conjunction with the decrease in operating costs due to the disestablishment of the MIQ facilities has contributed to the year-to-date surplus of $142 million.
2022/23 operating results
Text description of Operating results chart
The money we receive to fund our departmental operations
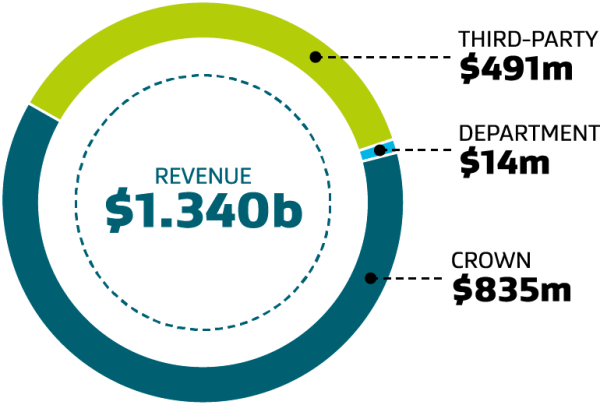
MBIE receives funding to deliver services and functions on behalf of the Government. The majority of our funding comes from the Crown and from fees and levies charged to third parties for our services.
Text description for chart
| Actual 2019 $000 |
Actual 2020 $000 |
Actual 2021 $000 |
Actual 2022 $000 |
Actual 2023 $000 |
Unaudited Budget 2023 $000 |
Unaudited Forecasts 2024 $000 |
|
|---|---|---|---|---|---|---|---|
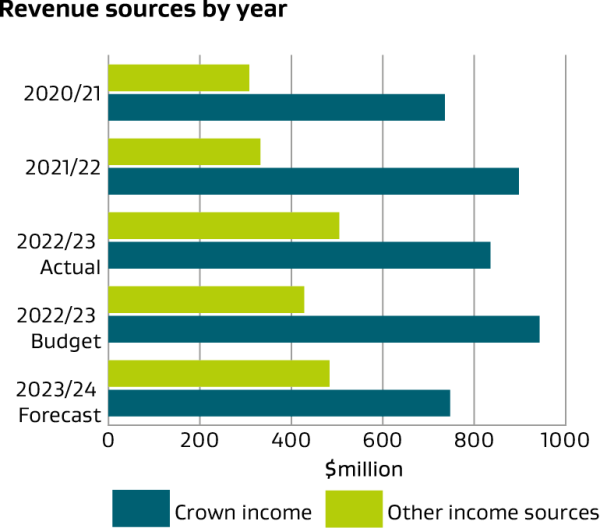
| Crown revenue | 404,190 | 461,548 | 735,937 | 897,618 | 835,434 | 942,720 | 747,173 |
| Third-party revenue | 408,472 | 408,399 | 287,965 | 387,474 | 490,748 | 404,366 | 459,481 |
| Department revenue | 25,502 | 16,696 | 16,696 | 18,807 | 13,961 | 23,793 | 24,106 |
| Total revenue | 838,164 | 886,643 | 1,043,861 | 1,303,899 | 1,340,143 | 1,370,879 | 1,230,760 |
In 2022/23 our total revenue was $36 million more than 2021/22, mainly due to the increase in immigration services with the borders fully re-opened to the rest of the world. Crown revenue was $62 million less than 2021/22 and $107 million less than the 2022/23 Budget. This is mainly driven by the disestablishment of MIQ facilities and the subsequent decrease in required Crown funding.
Third-party and department revenue was $98 million greater than 2021/22 and $77 million greater than the 2022/23 Budget. The increase from 2021/22 was due to the increase in immigration services as a result of the re-opening of the New Zealand border to the rest of the world and the subsequent increase in Visa application volumes.
Text description for Revenue sources by year graph
How we spent the funding we received for our departmental operations
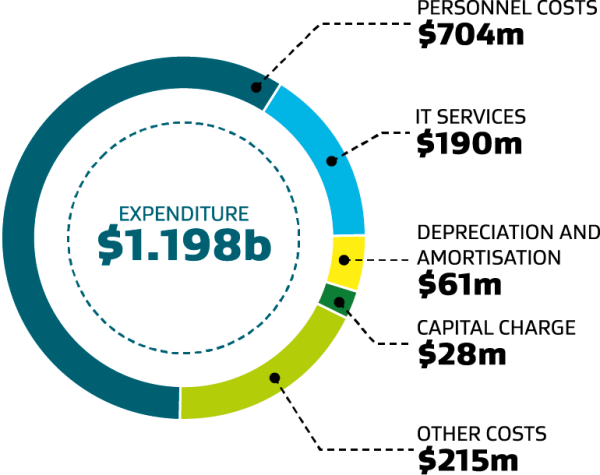
About 3 quarters of our total costs relate to personnel costs and IT services.
Text description of chart
| Actual 2019 $000 | Actual 2020 $000 | Actual 2021 $000 | Actual 2022 $000 | Actual 2023 $000 | Unaudited Budget 2023 $000 |
Unaudited Forecasts 2024 $000 |
|
|---|---|---|---|---|---|---|---|
| Personnel costs | 456,787 | 540,255 | 590,455 | 703,127 | 704,103 | 724,754 | 713,233 |
| IT costs | 115,806 | 136,590 | 142,902 | 166,243 | 190,358 | 192,253 | 192,253 |
| Depreciation, amortisation and impairment | 50,490 | 54,822 | 86,116 | 75,720 | 60,503 | 53,215 | 61,751 |
| Capital charge | 16,580 | 20,418 | 23,258 | 23,216 | 27,971 | 26,478 | 30,964 |
| Other operating costs | 174,542 | 178,826 | 262,222 | 292,726 | 214,845 | 328,793 | 214,667 |
| Total expenditure | 814,205 | 930,911 | 1,104,953 | 1,261,032 | 1,197,780 | 1,325,493 | 1,212,868 |
In 2022/23 we spent $1,198 million as a department, $63 million less than 2021/22 and $128 million less than the 2022/23 Budget. This is mainly due to the costs associated with the closure of MIQ facilities. Personnel and IT costs make up most of our expenditure and have increased as a proportion of our total expenditure from last year driven by the labour market conditions. Depreciation, amortisation, and impairment is $15 million less than 2021/22 at $61 million, due to the impact from the prior year change in the accounting policy for Software-as a-Service (“SaaS”) arrangements.
The memorandum accounts we administer
| Actual 2019 $000 |
Actual 2020 $000 |
Actual 2021 $000 |
Actual 2022 $000 |
Actual 2023 $000 |
Unaudited Budget 2023 $000 |
Unaudited Forecasts 2024 $000 |
|
|---|---|---|---|---|---|---|---|
| Immigration visa | (65,123) | (127,137) | (79,226) | (108,887) | 48,663 | (271,993) | 12,765 |
| Building controls | 55,548 | 56,327 | 57,019 | 66,184 | 71,590 | 58,901 | 65,346 |
| Registration and granting of intellectual property rights | 31,181 | 30,060 | 28,762 | 26,510 | 22,809 | 15,272 | 15,193 |
| Other memorandum accounts | 45,645 | 32,806 | 36,800 | 25,450 | 37,267 | (10,111) | 10,718 |
| Memorandum account balance at 30 June | 67,251 | (7,944) | 43,355 | 9,257 | 180,329 | (207,931) | 104,022 |
Memorandum accounts record the cumulative surplus or deficit of MBIE services that are intended to be fully cost recovered from third parties through fees, levies or other charges. Memorandum accounts provide transparency around these services, and in the long term, the balance of each memorandum account is expected to trend towards zero.
In 2022/23 MBIE administered 14 (2021/22: 14) memorandum accounts.
The overall memorandum account balance at 30 June 2023 was a $180 million surplus (2021/22: $9 million surplus). This year’s surplus was mainly due to the $129 million capital injections in the immigration visa memorandum account to write off accumulated deficits and additional revenue of $74 million from the 2021/22 year which was reclassified from revenue in advance due to a change in accounting policy (please refer to Note 2 for further details). Immigration visa revenue has increased due to increasing demand for visa categories with the New Zealand border fully re-opened in August 2022.
The departmental assets we manage to support our operations
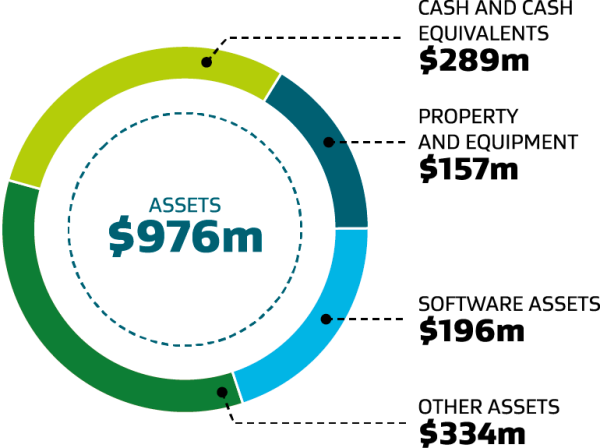
Text description of chart
| Actual 2019 $000 |
Actual 2020 $000 |
Actual 2021 $000 |
Actual 2022 $000 |
Actual 2023 $000 |
Unaudited Budget 2023 $000 |
Unaudited Forecasts 2024 $000 |
|
|---|---|---|---|---|---|---|---|
| Cash and cash equivalents | 115,285 | 140,710 | 178,512 | 249,284 | 289,388 | 120,596 | 159,856 |
| Property and equipment | 110,977 | 134,941 | 139,475 | 147,396 | 156,091 | 147,154 | 137,050 |
| Software assets | 216,880 | 233,329 | 191,603 | 188,191 | 196,227 | 107,005 | 208,191 |
| Other assets | 111,480 | 83,362 | 237,287 | 345,769 | 333,964 | 387,287 | 332,255 |
| Total assets | 554,622 | 592,342 | 746,877 | 930,640 | 975,670 | 762,042 | 837,352 |
| Capital expenditure | 74,484 | 98,562 | 78,206 | 77,658 | 70,300 | 72,978 | 66,665 |
MBIE manages $976 million of departmental assets. Software assets and property and equipment represent over a third of our assets. Software assets are the systems used to support the operation of MBIE and the services provided. Most of the software is developed internally rather than purchased. Our property and equipment are the land, buildings, leasehold improvements, furniture and fittings, vehicles and computer hardware we use in our daily operations. Most of the other assets we control relate to debtors and other receivables due to us.
Cash and cash equivalents are $40 million higher than the prior year and $169 million higher than the 2022/23 Budget due to the timing of returning unused cash back to the Crown. This is reflected in other assets which is mainly due to Crown funding not yet drawn down. Due to holding sufficient cash, reductions in discretionary expenditure and timing of expenditure, less funds have been required to be drawn down.
The non-departmental revenue we received on behalf of the Crown
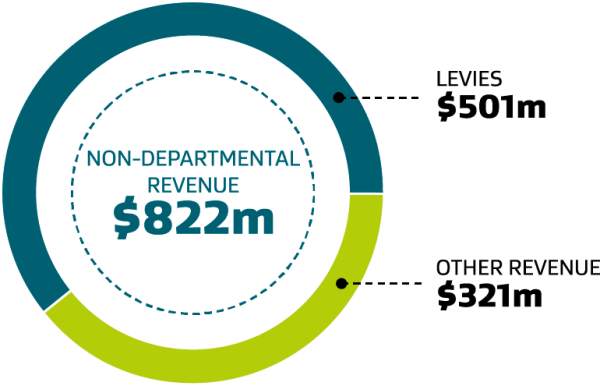
Text description of chart
| Actual 2019 $000 |
Actual 2020 $000 |
Actual 2021 $000 |
Actual 2022 $000 |
Actual 2023 $000 |
Unaudited Budget 2023 $000 |
Unaudited Forecasts 2024 $000 |
|
|---|---|---|---|---|---|---|---|
| Levies | 459,719 | 374,444 | 348,155 | 434,069 | 501,056 | 451,937 | 491,438 |
| Managed Isolation and Quarantine fees | – | – | 123,812 | 72,658 | – | – | – |
| Other revenue | 357,188 | 300,965 | 273,435 | 434,016 | 321,120 | 261,277 | 293,586 |
| Total non-departmental revenue | 816,907 | 675,409 | 745,402 | 940,743 | 822,176 | 713,214 | 785,024 |
Non-departmental revenue for 2022/23 was $119 million less than 2021/22, mainly due to a one-off Criminal proceeds (recovery) receipt in the 2021/22 year. Revenue was $109 million greater than the 2022/23 Budget due to receiving more revenue from levies than expected. Revenue from the International visitor levy increased as a result of the re-opening of the New Zealand border. Revenue from other levies was also greater as the market recovered faster from the effects of the pandemic than anticipated.
The non-departmental expenditure we administer on behalf of the Crown
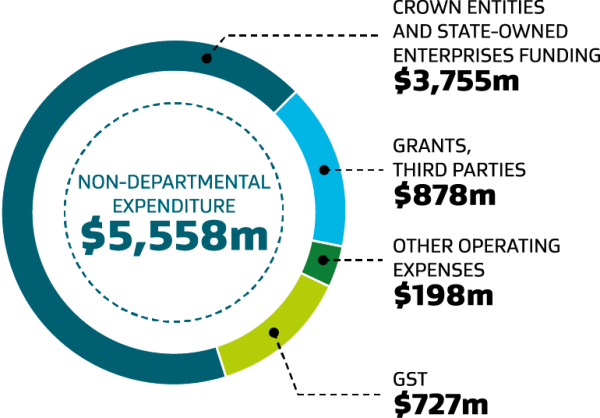
MBIE administers non-departmental activities on behalf of the Crown via 150 non-departmental appropriations. Funding is distributed to third parties, state-owned enterprises and Crown entities to support their operations and the grants they administer.
Text description of chart
| Actual 2019 $000 |
Actual 2020 $000 |
Actual 2021 $000 |
Actual 2022 $000 |
Actual 2023 $000 |
Unaudited Budget 2023 $000 |
Unaudited Forecasts 2024 $000 |
|
|---|---|---|---|---|---|---|---|
| Grants and operating expenses – Crown entities and state-owned enterprises | 2,927,341 | 3,179,681 | 3,814,852 | 3,642,609 | 3,754,799 | 3,825,364 | 4,075,421 |
| Grants – third parties | 584,986 | 771,504 | 1,302,717 | 1,021,509 | 878,771 | 1,143,911 | 854,161 |
| Other operating expenses | 272,182 | 251,783 | 811,928 | 772,552 | 198,298 | 389,647 | 508,751 |
| GST | 501,378 | 586,383 | 822,527 | 800,909 | 726,569 | 723,454 | 814,851 |
| Total non-departmental expenditure | 4,285,887 | 4,789,351 | 6,752,024 | 6,237,579 | 5,558,437 | 6,082,376 | 6,253,184 |
Our non-departmental expenditure was $679 million lower than 2021/22 and $524 million lower than the 2022/23 Budget. The drop in expenditure from the prior year is largely driven by the closure of MIQ facilities and the winding down of its operations.