Workforce survey
To help ensure that the Tourism ITP has a solid understanding of the current workforce situation and to help inform the Better Work Action Plan, the Better Work Leadership Group commissioned Dr David Williamson from the Auckland University of Technology to conduct a survey of the tourism and hospitality workforce (Workforce Survey).
On this page
This survey is based on the methodology of the recent Voices from The Front Line 2021 research but encompasses the breadth of the tourism industry (as opposed to the focus of the original report on the hospitality industry).
Overview of who participated in the Workforce Survey
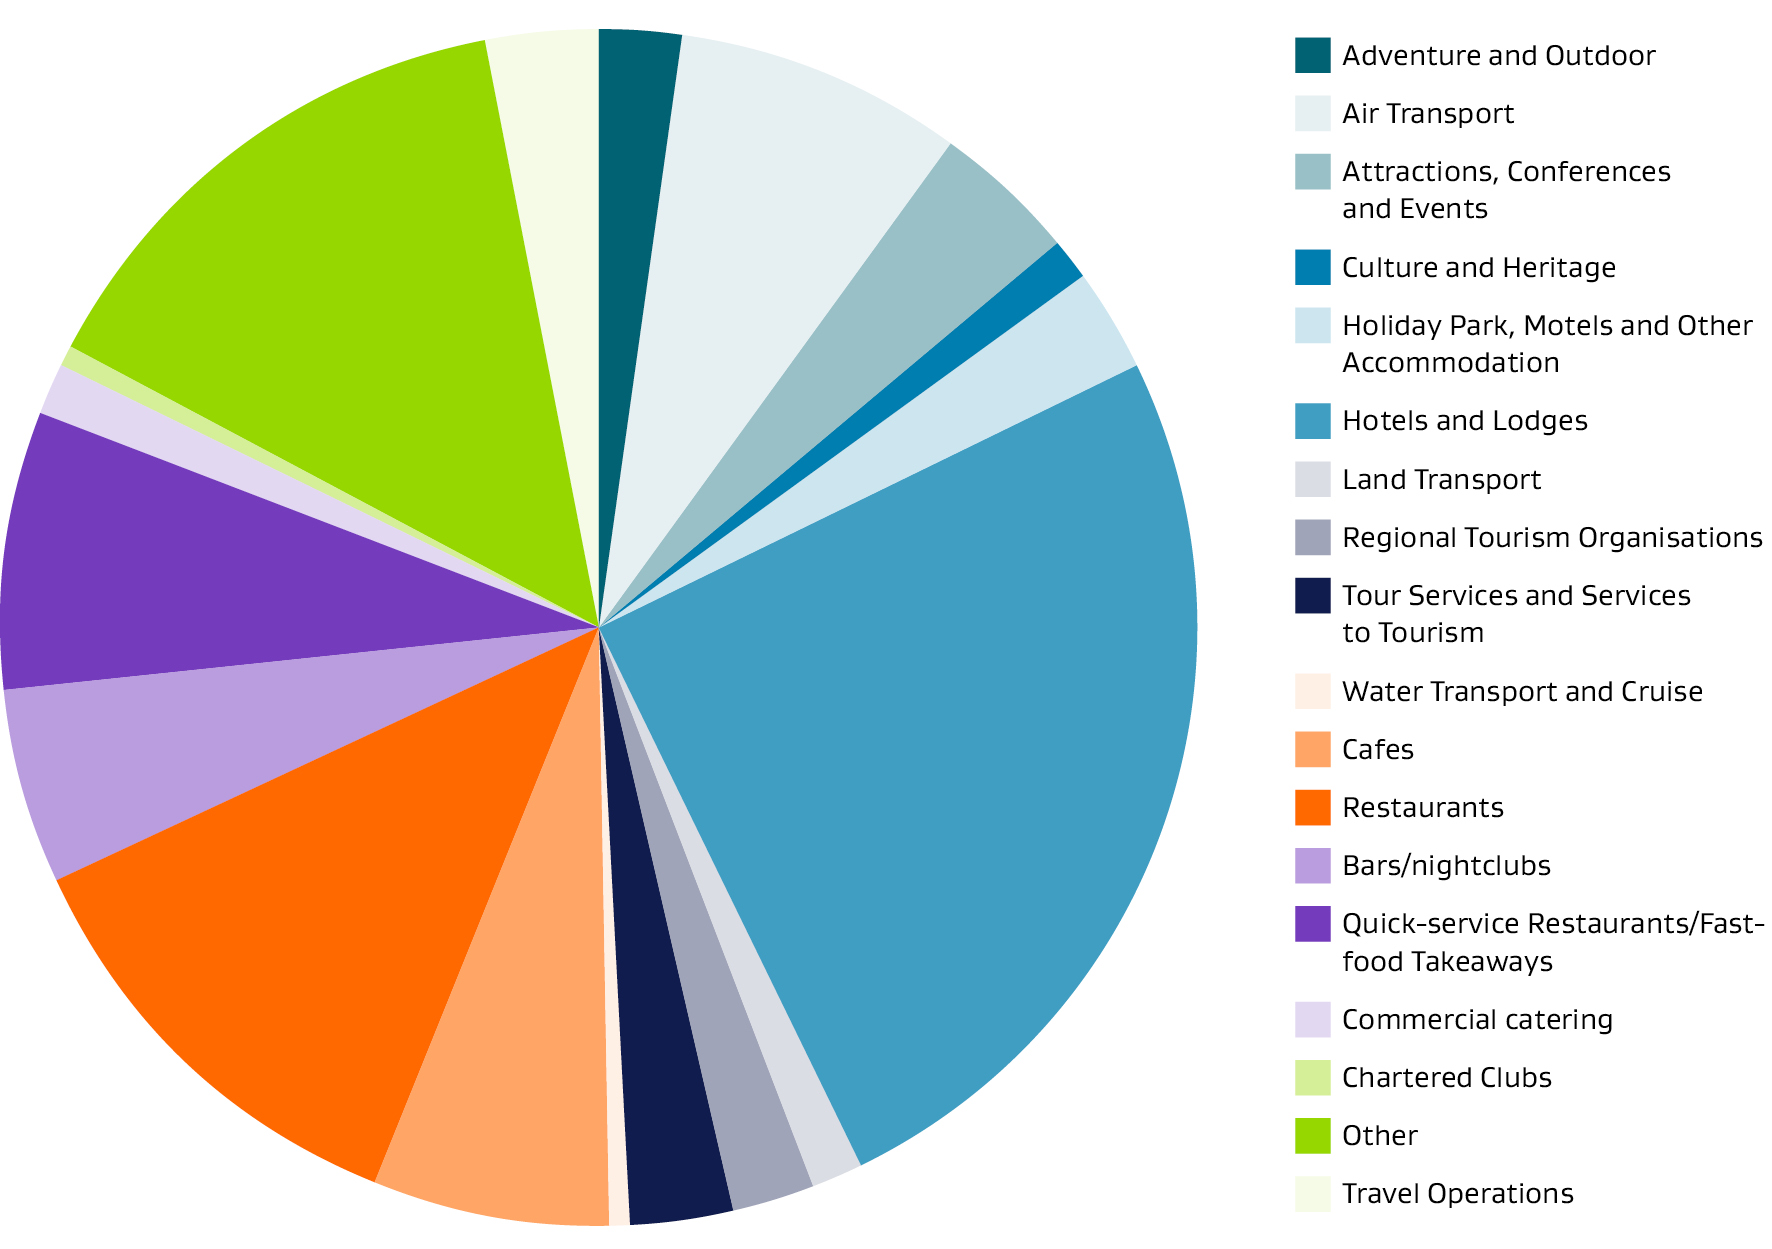
Just over 900 people participated in this survey. Respondents covered a wide range of roles from front line workers to managers and supervisors as well as a broad range of age groups. The Workforce Survey was made up of 51 questions, with 19 open fields. A breakdown of the industries that participants worked in is as follows:
- Tourism/travel – 10.4%
- Hospitality – 33.2%
- Events – 4%
- Transport – 9.5%
- Culture and heritage – 1.1%
- Other – 14%
The following pie chart shows these industries broken down further.
Key characteristics of participants
60.4% were female, 62% were of European descent, and many had some kind of higher education qualification. For example, a bachelor’s degree (25.1%) or diploma (21.7%), or post graduate qualification (11.8%).
Outcomes shown by the Workforce Survey
The first part of the survey invited participants to explain what attracted them to the tourism/hospitality industry. The most common reasons people were attracted to the industry were:
- the people in the industry (30%)
- the nature of the work, being fast paced, fun and flexible (20%)
- the need for a job/the ease of getting a job in the industry (15%)
- the customer/service focused nature of the work (14%)
The second part of the survey asked participants to explain what changes could be made to make the tourism/hospitality industry a better place to work. The responses with the highest frequency were:
- better pay and conditions (33%)
- more staff (8%)
- regular hours/being paid for all hours worked (8%)
- better management (8%)
Additional findings from the Workforce Survey relevant to the key challenges the industry faces are set out below.
Data behind the key challenges
Demand fluctuations
Data from 2020 to 2022 on the seasonal fluctuation of tourism demand does not paint a very accurate picture, due to the effects of COVID-19. We have instead referenced earlier data to show the seasonal fluctuation of tourism demand, both in tourism spending and workforce demand/filled jobs.
Tourism spend is seasonal. In 2019, total spend was 52% higher in summer than in winter [1]. The number of filled jobs in tourism-related industries is higher in the summer months than in winter. In 2019, the gap between summer and winter was 13.9% in activity, travel, and tour services, 8.6% in transport services, and 5.3% in accommodation and food and beverage services [2].
Women tend to have more seasonal employment patterns than men. This is demonstrated by seasonal decreases in winter compared to summer, with women’s percentage share of total employment for all industries being higher in summer and lower in winter [3].
Pay
Tourism sees a higher proportion of roles at the lower end of the pay scale. Although the workforce shortages caused in part by COVID-19 have resulted in a 7% increase in the hourly median wage for tourism roles, from $21.58/hr in June 2021 to $23.02/hr in June 2022, this is still 22% below the median income of all industries ($29.66) [4]. The table below outlines the hourly median wage difference over time between tourism and other industries [4], and also provides a comparison to the legal minimum adult wage.
| Tourism ($) | Horticulture ($) | Construction ($) | Dairy ($) | Median across all sectors ($) |
Minimum adult wage ($) |
|
|---|---|---|---|---|---|---|
| June 2016 | 17.96 | 18.49 | 23.02 | 19.83 | 23.50 | 15.25 |
| June 2017 | 18.00 | 19.00 | 24.93 | 21.23 | 24.37 | 15.75 |
| June 2018 | 19.00 | 20.00 | 25.00 | 23.02 | 25.00 | 16.50 |
| June 2019 | 20.00 | 20.58 | 26.85 | 23.97 | 25.53 | 17.70 |
| June 2020 | 20.12 | 22.00 | 26.37 | 24.95 | 27.00 | 18.90 |
| June 2021 | 21.58 | 23.97 | 28.00 | 25.05 | 27.75 | 20.00 |
| June 2022 | 23.02 | 25.50 | 29.90 | 28.08 | 29.66 | 21.20 |
A large proportion of the tourism workforce work in retail trade, accommodation, and food service industries, all of which have low pay rates. This influences the lower median wage of the tourism sector [4].
The Workforce Survey [5] revealed problematic practices in relation to meeting legal minimum pay standards. Findings included the following:
Respondents get paid their correct holiday pay
- 4.7% said never
- 15% were unsure or did not know
- 8.6% said sometimes
- 71.7% said always
Respondents get paid for every hour they work
- 11.5% said never
- 3.8% were not sure or didn’t know
- 18.3% said sometimes
- 66.4% said always
Respondents were paid the current minimum adult wage of $21.20 per hour
- 7.5% said no (of particular concern, 9% of front line/back of house/admin/other workers answered ‘no’ to this question)
- 2.1% were unsure or did not know
Conditions
There is a high degree of casualisation of the workforce due to the seasonality of tourism and hospitality. This can be an attractive feature of the tourism industry for some workers as it allows flexibility, but it can also lead to workers having unstable hours, and casual contracts generally lack many of the benefits workers would have on a fixed-term or permanent contract.
Workplace bullying and harassment
Workplace bullying and harassment are also disproportionately high in tourism and hospitality. A 2022 study by the Human Rights Commission found that while sexual harassment occurs in all industries, young workers in hospitality are especially likely to be subject to sexual harassment. In the previous 5 years, 43% of workers under 30 had experienced at least 1 incident of sexual harassment [6]. The report also showed that 38% of hospitality and tourism workers under the age of 30 experienced at least 1 workplace bullying behaviour in the last 12 months [6]. Furthermore, 86% of workers who had experienced bullying also experienced negative effects such as worsening mental and physical health, anxiety and depression, and sleep problems [6].
In the Workforce Survey [5], nearly a quarter (23.3%) of respondents stated that they had personally experienced bullying and harassment in the last 12 months and 33.9% of respondents stated they had witnessed bullying or harassment of others in the workplace in the last 24 months.
Firm maturity and scale
The tourism industry is largely made up of small and medium sized enterprises. As of March 2020, 87% of tourism businesses had fewer than 20 employees [7].
MBIE research has found that some businesses in tourism have low margins [8], which is one of the factors impacting on wages and investment. This is also likely to impact on the capacity for tourism businesses to invest in training and development.
Tourism related industries have historically had a higher turnover of staff than other industries. This is shown by the higher-than-average numbers moving within the industry as well as in and out of the industry [4]. This trend does not appear to have been impacted by COVID-19. Higher employee turnover leads to increased recruitment and training costs for businesses, loss of business and brand knowledge, decreased productivity, and lower employee morale.
The Workforce Survey [5] results showed that some workers had been in the industry for a relatively long tenure and saw themselves having a long-term career in the industry. In particular:
- 537 respondents had worked for more than 5 years in the industry (just over half of respondents) compared with 259 respondents (just under a third) who had worked up to 3 years in the industry.
- 54.9% of respondents saw themselves as having a long-term career in the industry compared with 23.5% of respondents who were not sure, and 21.6% of respondents who did not see a long-term career in the industry.
However, there were a number of respondents who indicated their intention to leave (or who were unsure of whether they would leave) the industry in the next 12 months:
- 33% of front line and back of house/admin/other workers intend to leave, while 46% were unsure
- 35% of employers, managers, and supervisors intend to leave, while 47% were unsure.
Current and future skills gap
The number of tourism learners across tertiary education organisations in Aotearoa New Zealand declined by 55%, from 4,625 in 2017 to 2,090 in 2021, with a large drop of 35% between 2020 and 2021 [10]. This drop in tourism learners during the COVID-19 pandemic is an outlier from the 11% overall increase of enrolments in tertiary education.
The Tertiary Education Commission (TEC) decreased investment in tourism education and training by 57% over 2017 to 2021 [4]. Prior to COVID-19, TEC was reducing investment in some tourism education and training, but from 2020, TEC made further reductions. This decrease in investment was largely in response to COVID-19 impacts, which meant that fewer staff were being hired.
The Workforce Survey [5] asked respondents whether they had been offered formal or on-the-job training for their current role. Results revealed that 13% of respondents said they did not receive any training and 7% said no formal training was received.
1. Monthly Regional Tourism Estimate 2016 to 2020 — MBIE (2020) [Back to text]
2. COVID-19 Data Portal, Monthly Filled Jobs(external link) — Stats NZ (November 2022) [Back to text]
3. Estimate created using data sourced from Stats NZ (June 2022) 'Household Labour Force Survey, and Stats NZ (March 2021) Tourism Satellite Account'. [Back to text]
4. Stats NZ (June 2022) 'Household Labour Force Survey'. [Back to text]
5. Williams, Dr D and Rasmussen Professor E. (2022) 'He Tangata, He Tangata, He Tangata. A Research Report on Tourism and Hospitality Employment Conditions in New Zealand.' [Back to text]
6. Experience of Workplace Bullying and Harassment in Aotearoa New Zealand [PPT, 1,732 KB](external link) — Kantar Public, for the Human Rights Commission (August 2022). [Back to text]
7. Hinonga Kōkiri Tourism Industry Skills Summary(external link) — Ringa Hora, Service IQ (2021) [Back to text]
8. Who benefits from firm success? [PDF, 1.3 MB] — MBIE, Allan, C. and Mare, D. (March 2022) [Back to text]
9. Stats NZ (June 2022), 'Household Labour Force Survey'. [Back to text]
10. Recent trends on investment in education and training for the tourism sector [PDF, 429 KB](external link) — Tertiary Education Commission, Ive, N. (February 2022), [Back to text]