Medium to long-term employment outlook: Looking ahead to 2026
This report presents our employment forecasts by industries, broad occupation and skill groups to 2026.
On this page I tēnei whārangi
Medium to long-term employment outlook: Looking ahead to 2026 [PDF, 1.2 MB]
How we use the data
The employment outlook to 2026 informs our medium-long term policy advice on immigration policy settings and decisions on tertiary education and industry training funding priorities.
The Occupation Outlook 2018, used by high school students in making career choices, also refers to the employment outlook.
Model and methodology
These forecasts are based on a Computable General Equilibrium model developed by Business and Economic Research Ltd (BERL) for our use. The method and underpinning assumptions are described in the methodology section at the end of the report.
Summary
- 47,000 more workers on average each year to 2026. Employment is forecast to grow by 1.8% annually, adding about 47,000 workers on average per year to the workforce in the 10 years to 2026.
- Strong economic growth supports this employment growth — average annual GDP growth of about 3.2% and 2.6% over the 2016-21 and 2021-26 periods, respectively.
- Business services and construction are forecast to have the strongest employment gains. These industries are forecast to add 7,600 per year and 5,600 per year, respectively, over the 10 years to 2026.
- 27,400 average annual increase forecast for highly-skilled occupations. Employment growth will be strongest for highly-skilled occupations, and weakest for lower-skilled occupations (14,000 annually) over the forecast period.
In the medium-term, strong employment growth is anticipated to be matched by increasing labour supply resulting from elevated net migration. In the long-term, increasing labour supply constraints arising from an ageing population is anticipated to result in higher productivity growth.
The employment forecasts are based on GDP growth and other macroeconomic forecasts and productivity assumptions at the industry level, and are indicative of the likely growth path of employment. Because a top-down macroeconomic approach was used to forecast employment changes by industry, care should also be taken when interpreting specific industry employment forecasts.
Industry
Business services and construction will drive employment growth
Eight out of the 16 industry groups will have higher than average annual growth over the 10 years to 2026. Of those industry groups, business services will have the strongest annual growth rate (2.5% or 7,600), followed by the construction and utilities industry (2.2% or 6,100 on average) and other manufacturing industries (2.0% or 3,000). Strong growth in household spending and residential investment over the forecast period underpins the forecast growth in those industries.
Over the forecast period, employment growth will be weakest in the primary sector. Weak to modest growth is projected for the public sector, including education and training, and public administration and safety.
Figure 1: Fastest to slow growing industry groups over the 10 years to 2026
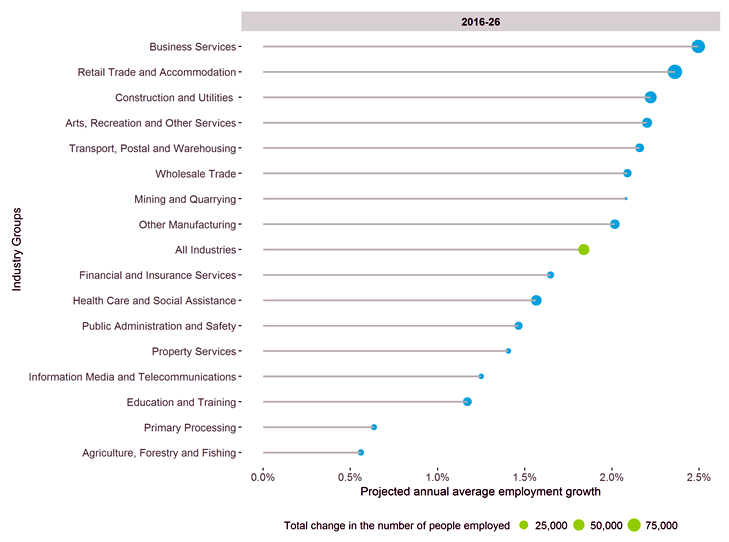
Note: Retail trade and accommodation includes food services; primary industries include agriculture, forestry and fishing; primary processing cover food & beverage and wood product manufacturing.
The data table for Figure 1 and the full data table for 28 industries is available at the bottom of this page.
Occupation
27,400 average annual increase for highly-skilled occupations
Employment growth will be strongest for highly-skilled occupations, including managers and professionals, which are projected to account about 58% of the total employment growth in the 10 years to 2026.
Within the highly-skilled occupation group, annual growth with be fastest for advertising, public relations and sales managers and ICT managers. Over the forecast period, employment in highly-skilled occupations will increase by 273,800.
14,000 more lower-skilled workers on average each year
Opportunities for lower-skilled workers will be fewer, with annual growth of 1.2% over the 10 years to 2026.
The fastest growing occupations are drivers, construction and mining labourers and delivery drivers. These occupations will make up about 40% of the 43,900 increase in employment for this group.
Figure 2: Annual average percentage change, skill group, 2016-21 and 2021-26 periods
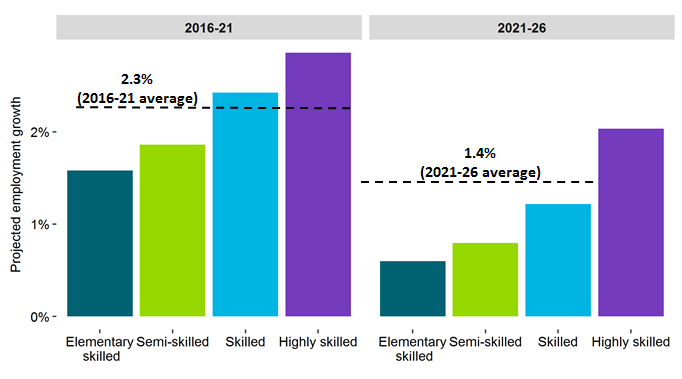
The data table for Figure 2 and the full data table for 97 occupations is available at the bottom of this page.
Data tables
Data table for Figure 1
Data table 1: All 28 industries
Data table for Figure 2
Data table 2: All 97 occupations