2021 release
The Modelled Territorial Authority Gross Domestic Product (MTAGDP) estimates have been developed from Statistics NZ Regional GDP estimates. They provide information at the territorial authority area level so that we can better understand local economies and industries.
On this page I tēnei whārangi
Downloadable data
Full data table for MTAGDP [CSV, 3.1 MB]
Key findings
- Over the five years to March 2020, nominal GDP grew in almost every territorial authority area, with especially high growth in Queenstown Lakes, Western Bay of Plenty and Tauranga.
- Population growth accounted for a high proportion of the nominal GDP growth in most fast-growing areas.
- Auckland is New Zealand’s largest territorial authority area. It remains New Zealand’s biggest contributor to national GDP and GDP growth, accounting for 38% of New Zealand’s GDP and 42% of GDP growth in the five-year period to 2020. However, some smaller areas are growing fast and increasing in economic importance. This includes Queenstown Lakes, Western Bay of Plenty, and Tauranga, whose shares of GDP growth were 2 times, 1.9 times and 1.6 times their shares of GDP, respectively.
- Cities have a high proportion of their GDP in services. Most other areas are either primary industry focused or are service-based with significant additional primary industry output.
About the MTAGDP data
This release presents annual nominal GDP estimates for the year ended March 2020 for each territorial authority and regional council area. A further breakdown by industry group is given, but is only available up to March 2019. These estimates pre-date the economic disruption from the COVID-19 pandemic.
Territorial authorities include both district councils and city councils. Some of these councils are unitary authorities, which also have the duties and powers of a regional council (Auckland Council and Nelson City Council, for example).
The estimates are of nominal GDP (sometimes known as current price GDP). Unlike real GDP, nominal GDP is not adjusted to remove the effects of inflation. This means that nominal GDP changes with shifts in both quantities and prices.
Territorial authority area GDP growth rates
Over the five years to March 2020, nominal GDP grew in almost every territorial authority area, with especially high growth in Queenstown Lakes, Western Bay of Plenty and Tauranga
In the five years from April 2015 to March 2020, 65 of the 66 territorial authority areas had positive nominal GDP growth (Figure 1).
- The highest growth was in Queenstown Lakes, which had a compound annual growth rate (CAGR), over five years, of 12.9%. Central Otago (adjacent to Queenstown Lakes) also had high growth of 8.9%.
- Three territorial authorities in the Bay of Plenty region also showed strong growth: Western Bay of Plenty (12.4% growth), Tauranga (10.1%), and Ōpōtiki (9.2%).
- Slightly negative growth was seen in Buller (-0.1%) and low growth was seen in New Plymouth (0.6%), South Taranaki (1.1%) and Wairoa (1.3%).
- These growth rates can be compared to an overall New Zealand CAGR of 5.9%. Growth rates exceeding the New Zealand average were seen in 33 of the 66 territorial authority areas.
Population growth accounted for a high proportion of the nominal GDP growth in most fast-growing areas
An area’s per capita GDP is its nominal GDP divided by its population. Growth in per capita GDP is a useful measure because it removes changes that are only due to population growth.
The three areas with the fastest growing nominal GDP (Queenstown Lakes, Tauranga, and the Western Bay of Plenty) also had high population growth and their per capita GDP growth rates were considerably lower than their nominal GDP growth rates. However, they were still among the fastest growing areas, as judged by per capita GDP CAGRs, meaning that they had strong growth over and above the population-driven increase (Figure 1).
Overall, 65 of the 66 territorial authority areas had positive per capita GDP growth (Figure 1).
- Western Bay of Plenty had the highest per capita GDP 5-year CAGR, at 8.7%.
- High per capita growth rates above 6% were also seen for Waimate (8%), Ōpōtiki (7.2%), Ruapehu (6.4%), Tauranga (6.3%), and Stratford (6.1%).
- New Plymouth was the only area where per capita GDP decreased, with a 5-year CAGR of -1.0%. This was driven by a 2016-17 contraction in the GDP of the industry group: Forestry, Fishing, Mining, Electricity, Gas, Water and Waste Services. However, per capita GDP in New Plymouth remained well above the national average, at $78,836 in 2020 (compared to the New Zealand average of $63,556).
- These rates can be compared to an overall New Zealand per capita GDP CAGR of 3.8%.
Figure 1. Five-year growth in nominal GDP and per capita GDP by territorial authority area
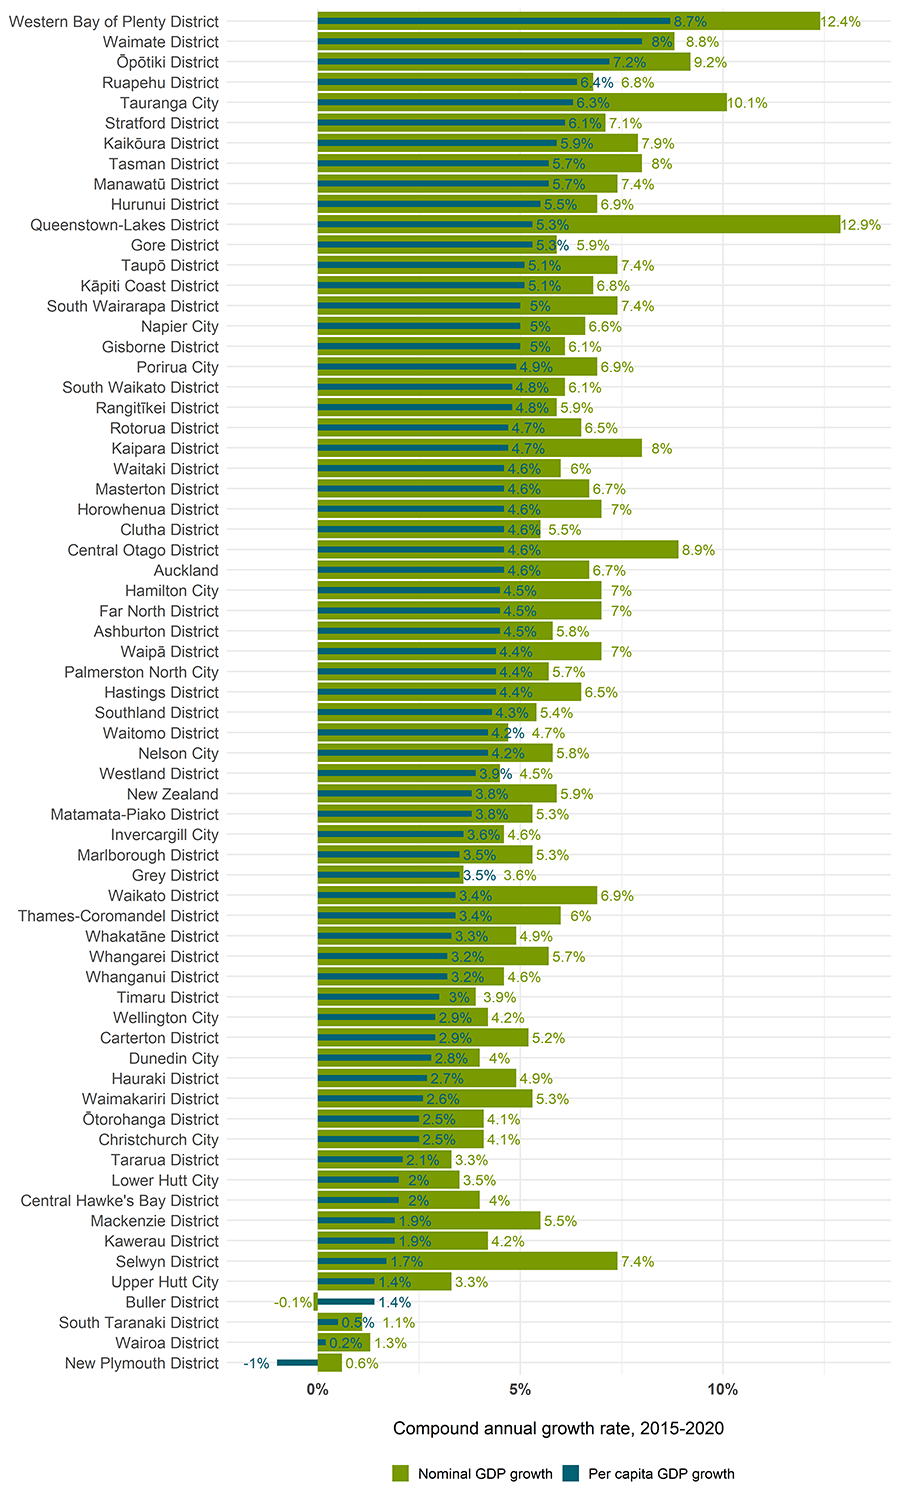
Chart description
Territorial authority area contributions to national GDP
Auckland is New Zealand’s biggest contributor to national GDP and GDP growth, but some smaller areas have higher shares of growth than would be predicted based on their size alone
Economically, Auckland is by far New Zealand’s largest territorial authority area, accounting for 37.7% of New Zealand’s GDP in 2015-2020 and a slightly higher proportion (42.2%) of New Zealand’s GDP growth over the same period. The next largest areas were the cities of Christchurch and Wellington. From 2015 to 2020, Christchurch accounted for 8.9% of national GDP, but a lower proportion (6.3%) of national GDP growth and Wellington accounted for 8.5% of national GDP and 6.2% of national GDP growth (Figure 2).
Figure 2 shows each area’s share of national GDP and share of national GDP growth in 2015-2020. It also presents ratios of each area’s share of GDP growth divided by share of GDP. Ratios greater than 1 indicate that an area has a higher share of national economic growth than what would be accounted for solely by the size of its economy. Ratios below 1 indicate that an area’s share of national growth is lower than its share of national GDP. New Zealand’s larger cities do not have the highest ratios. Some smaller areas had ratios considerably higher than those of the larger cities. For example, Queenstown Lakes, Western Bay of Plenty and Tauranga’s shares of GDP growth have been 2 times, 1.9 times and 1.6 times their shares of GDP, respectively.
Figure 2. Each territorial authority area’s share of GDP, share of GDP growth, and ratio of share of GDP growth to share of GDP, for 2015 to 2020
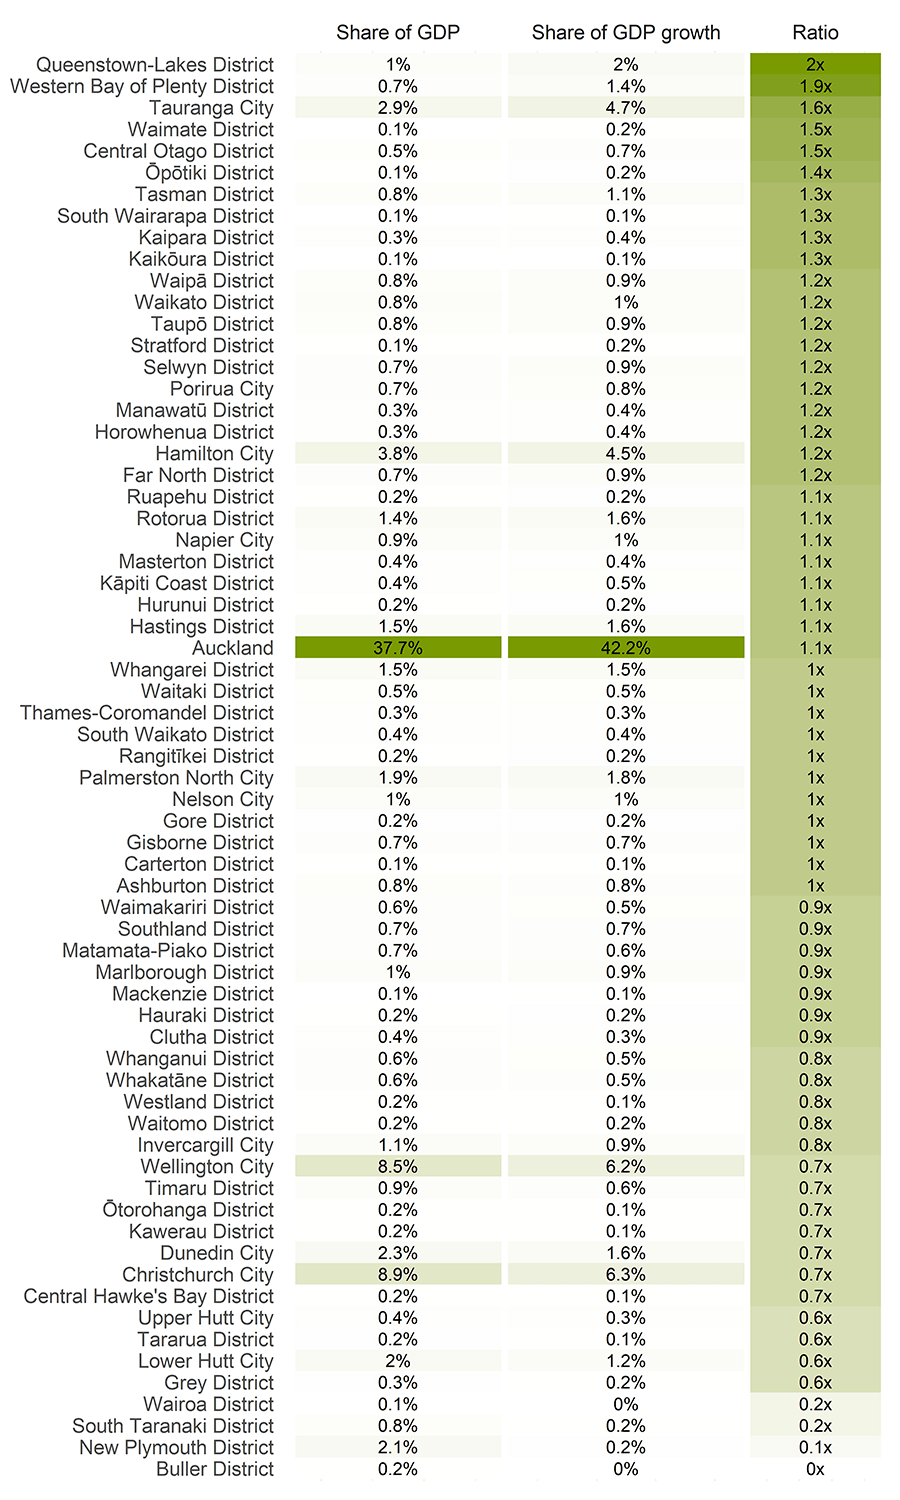
Note: Higher percentages or ratios are shaded darker green (with a different scale used for each column).
Chart description
Industry shares of GDP within territorial authorities
Territorial authority areas can be grouped into four types with cities tending to have a greater share of GDP in service industries and other areas more concentrated in primary or goods-producing industries
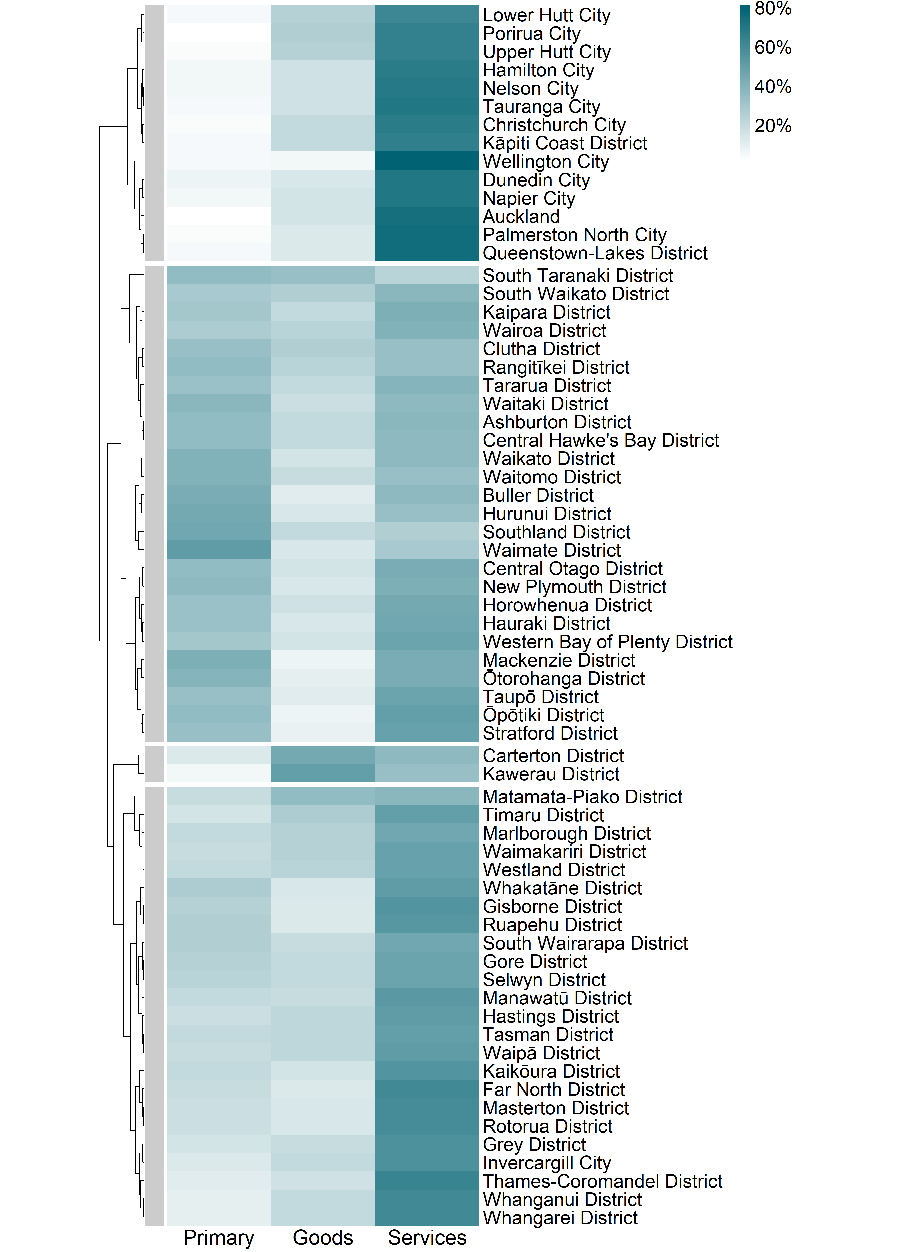
The distribution of GDP across industries differs among territorial authority areas. Figure 3 clusters the territorial authority areas into four types based on their industry distribution of GDP in 2015 to 2019.
- The cities, and Queenstown Lakes and Kāpiti Coast districts, were dominated by service industries, with 62 to 75% of their GDP in services. Very little (less than 7%) of their GDP was in primary industries.
- Twenty three districts and Invercargill City were services-based (38 to 60 percent of GDP in services), but also had significant primary industry output (10 to 28%). These are the last 24 areas in Figure 3.
- Carterton and Kawerau districts’ GDP was primarily in goods-producing industries, reflecting the predominance of manufacturing in these areas.
- The remaining areas were more primary industry oriented, with 27 to 51% of their GDP in primary industries. This is the second group of 26 areas in Figure 3.
Figure 3. The proportion of each territorial authority area’s GDP in primary industries, goods-producing industries, and service industries, 2015-2019
Note: Industries were grouped as follows:
- Primary industries: agriculture; forestry, fishing, mining, electricity, gas, water and waste services.
- Goods-producing industries: construction; manufacturing.
- Service industries: accommodation; administrative and support services; education and training; financial and insurance services; food and beverage services; health care and social assistance; information, media, telecommunications and other services; owner-occupied property operation; professional, scientific and technical services; public administration and safety; rental, hiring and real estate services; retail trade; and transport, postal and warehousing.
- The GDP of GST on Production, Import Duties and Other Taxes is not shown.
Hierarchical clustering was used to group areas, as shown by the dendrogram and four grey bars on the left of the heatmap. Blue boxes indicate each area’s proportion of GDP in primary, goods-producing, and service industries.
Chart description
Explore further
You can explore MTAGDP data graphically in our Regional Economic Activity Tools