Modelled Territorial Authority GDP 2020 release
The Modelled Territorial Authority Gross Domestic Product (MTAGDP) estimates have been developed from Stats NZ Regional GDP estimates. They provide information at the territorial authority area level so that we can better understand local economies and industries.
Territorial authorities include both district councils and city councils. Some of these councils are unitary authorities, which also have the duties and powers of a regional council (Auckland Council, and Nelson City Council, for example).
On this page
I tēnei whārangi
Main results
This release presents annual nominal GDP estimates for the year ended March 2019
In this release:
- Annual nominal GDP, up to the year ended March 2019, is provided for each territorial authority area and regional council region.
- A further breakdown by industry group is given, but is only available up to March 2018.
These estimates pre-date the COVID-19 pandemic.
The estimates are of nominal GDP (sometimes known as current price GDP). Unlike real GDP, nominal GDP is not adjusted to remove the effects of inflation. This means that nominal GDP changes with shifts in both quantities and prices.
Over the five years to March 2019, nominal GDP grew in 63 of the 66 territorial authority areas, and strong growth was seen in some areas
In the five years from April 2014 to March 2019, 63 out of the 66 territorial authority areas had positive nominal GDP growth.
- The highest growth was in Queenstown Lakes, which had a compound annual growth rate (CAGR), over five years, of 13.4 per cent.
- Tauranga, Western Bay of Plenty, and Kaipara also showed strong growth, with five-year CAGRs of 9.4 per cent, 8.7 per cent, and 8.3 per cent, respectively.
- No growth was seen in Ōtorohanga and negative growth was seen in New Plymouth (-1.4 per cent five-year CAGR) and Buller (-3.4 per cent).
- These growth rates are compared to an overall New Zealand CAGR of 5.4 per cent. Growth rates exceeding this New Zealand average were seen in 17 of the 66 territorial authority areas.
Figure 1: Five-year growth in nominal GDP by territorial authority area
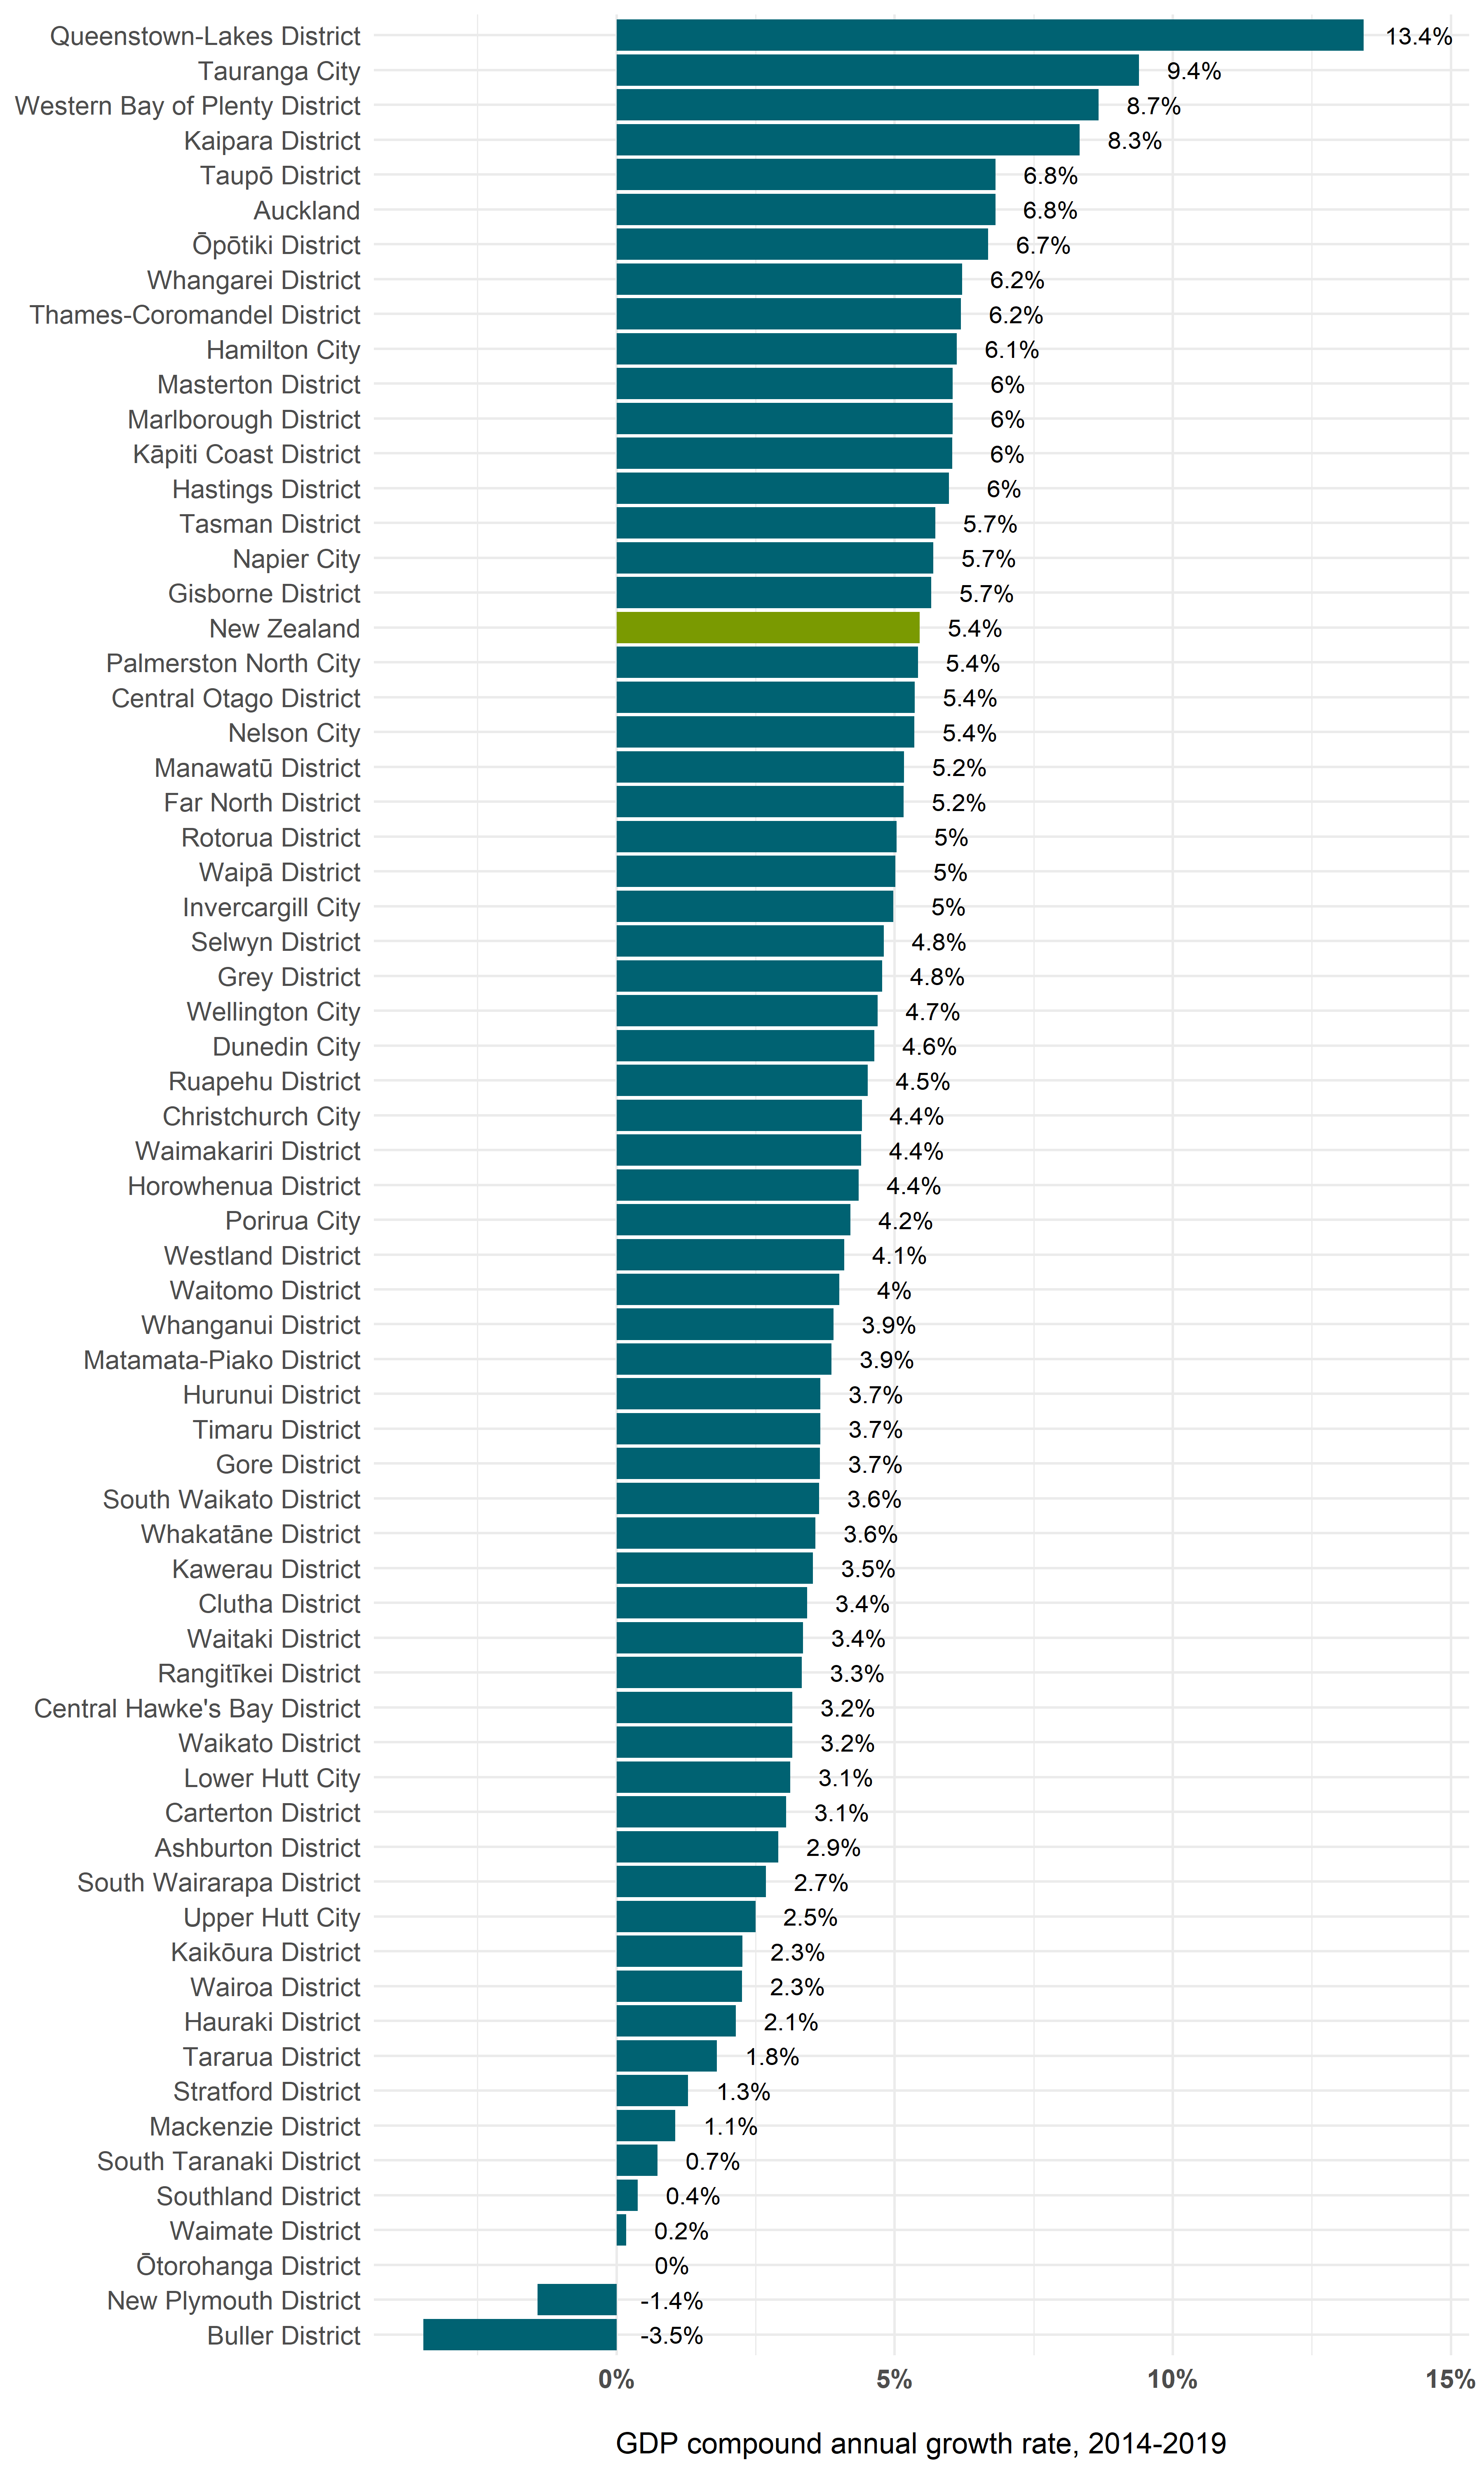
Chart description
Chart showing the five year compound annual growth rate (2014-2019) in nominal GDP, for each territorial authority area and for New Zealand overall.
The growth rates are as follows:
- Ashburton District: 2.9 per cent
- Auckland: 6.8 per cent
- Buller District: -3.5 per cent
- Carterton District: 3.1 per cent
- Central Hawke's Bay District: 3.2 per cent
- Central Otago District: 5.4 per cent
- Christchurch City: 4.4 per cent
- Clutha District: 3.4 per cent
- Dunedin City: 4.6 per cent
- Far North District: 5.2 per cent
- Gisborne District: 5.7 per cent
- Gore District: 3.7 per cent
- Grey District: 4.8 per cent
- Hamilton City: 6.1 per cent
- Hastings District: 6 per cent
- Hauraki District: 2.1 per cent
- Horowhenua District 4.4 per cent
- Hurunui District: 3.7 per cent
- Invercargill City: 5 per cent
- Kaikōura District: 2.3 per cent
- Kaipara District: 8.3 per cent
- Kāpiti Coast District: 6 per cent
- Kawerau District: 3.5 per cent
- Lower Hutt City: 3.1 per cent
- Mackenzie District: 1.1 per cent
- Manawatū District: 5.2 per cent
- Marlborough District: 6 per cent
- Masterton District: 6 per cent
- Matamata-Piako District: 3.9 per cent
- Napier City: 5.7 per cent
- Nelson City: 5.4 per cent
- New Plymouth District: -1.4 per cent
- New Zealand: 5.4 per cent
- Ōpōtiki District: 6.7 per cent
- Ōtorohanga District: 0 per cent
- Palmerston North City: 5.4 per cent
- Porirua City: 4.2 per cent
- Queenstown-Lakes District: 13.4 per cent
- Rangitīkei District: 3.3 per cent
- Rotorua District: 5 per cent
- Ruapehu District: 4.5 per cent
- Selwyn District: 4.8 per cent
- South Taranaki District: 0.7 per cent
- South Waikato District: 3.6 per cent
- South Wairarapa District: 2.7 per cent
- Southland District: 0.4 per cent
- Stratford District: 1.3 per cent
- Tararua District: 1.8 per cent
- Tasman District: 5.7 per cent
- Taupō District: 6.8 per cent
- Tauranga City: 9.4 per cent
- Thames-Coromandel District: 6.2 per cent
- Timaru District: 3.7 per cent
- Upper Hutt City: 2.5
- Waikato District: 3.2 per cent
- Waimakariri District: 4.4 per cent
- Waimate District: 0.2 per cent
- Waipā District: 5 per cent
- Wairoa District: 2.3 per cent
- Waitaki District: 3.4 per cent
- Waitomo District: 4 per cent
- Wellington City: 4.7 per cent
- Western Bay of Plenty District: 8.7 per cent
- Westland District: 4.1 per cent
- Whakatāne District: 3.6 per cent
- Whanganui District: 3.9 per cent
- Whangārei District: 6.2 per cent
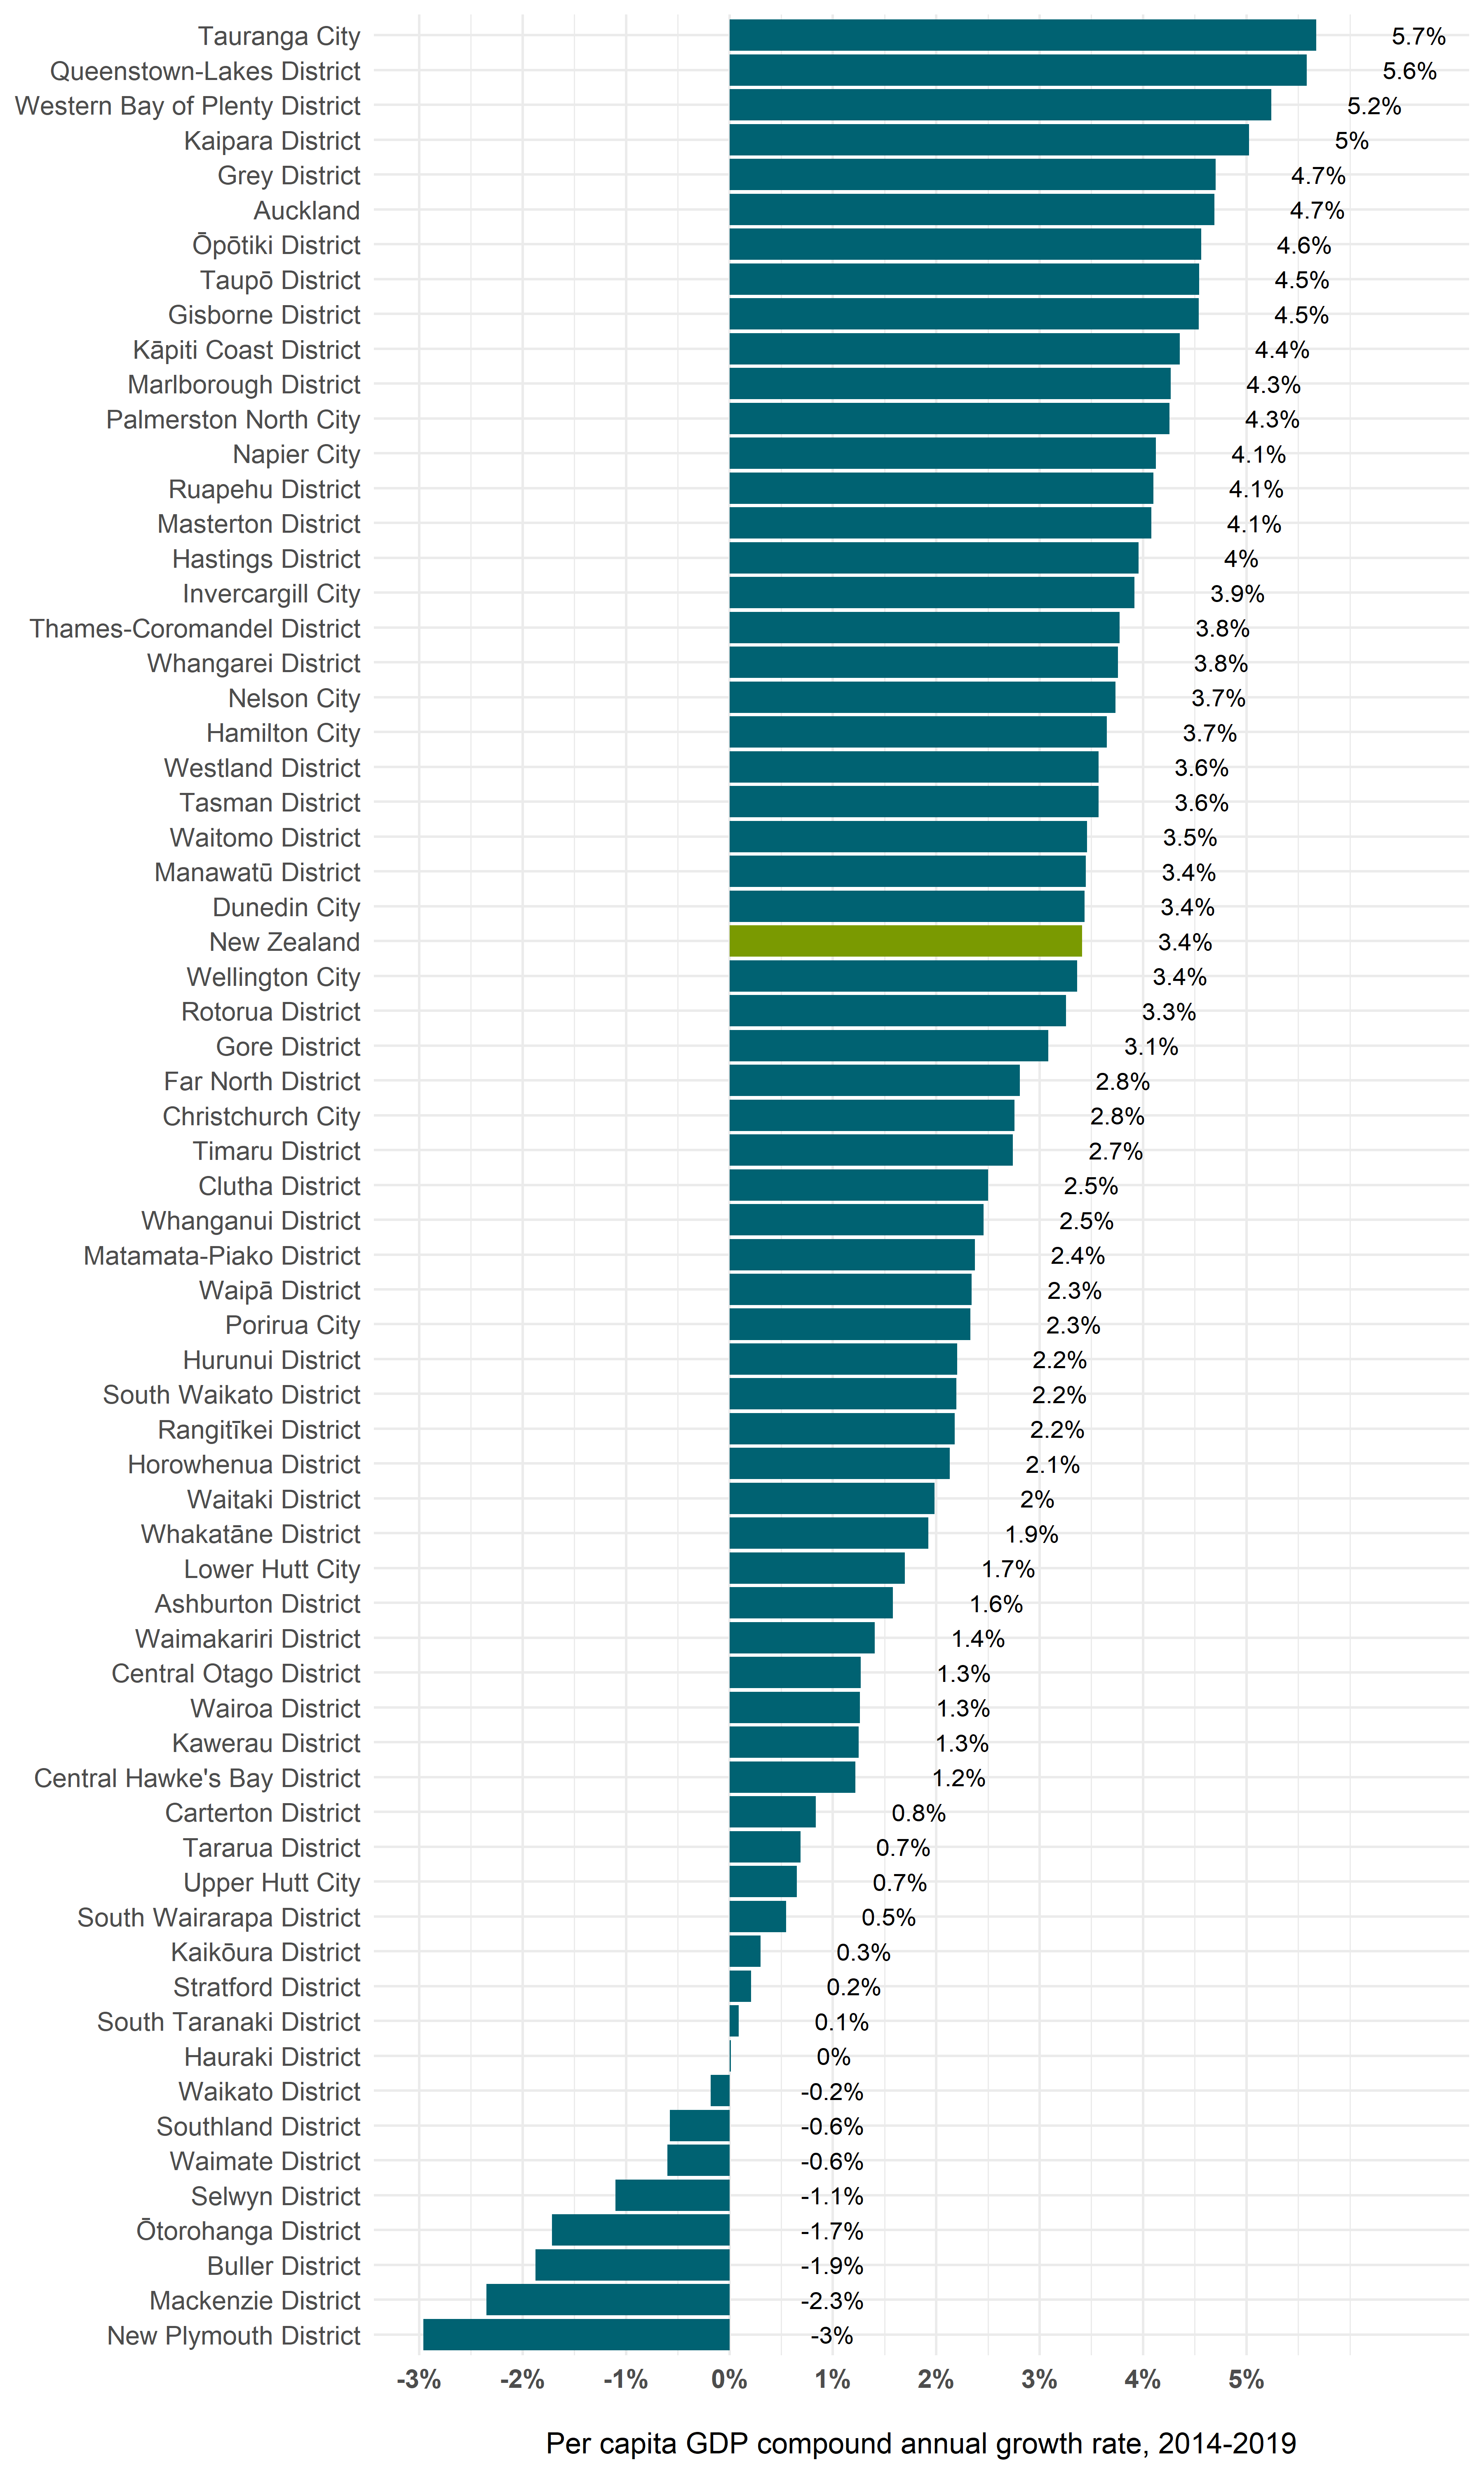
Per capita GDP grew in most regions
An area’s per capita GDP is its nominal GDP divided by its population. Growth in per capita GDP is a useful measure because it removes changes that are only due to population growth.
In the five years from March 2014 to March 2019, per capita GDP increased in 58 territorial authority areas and decreased in eight.
- Tauranga City and Queenstown Lakes District had the highest per capita GDP 5-year CAGRs, at 5.7 and 5.6 per cent respectively. They also had high population growth, with 5-year population CAGRs of 3.5 per cent in Tauranga and 7.4 per cent in Queenstown Lakes.
- The strongest reduction of per capita GDP was seen in New Plymouth District, with a 5-year CAGR of -3 per cent. During this period, New Plymouth’s per capita GDP dipped from $86,164 in 2014 to a low of $68,195 in 2017, with a recovery to $74,149 in 2019. Over the same period, the population grew with a CAGR of 1.6 per cent. The change in New Plymouth’s GDP was driven by a contraction in the GDP of Forestry, Fishing, Mining, Electricity, Gas, Water and Waste Services. This collection of industries accounted for 32 per cent of New Plymouth’s GDP in 2018 and had a per capita GDP CAGR of –9 per cent from 2014 to 2018.
Chart description
Chart showing the five year compound annual growth rate (2014-2019) in per capita nominal GDP, for each territorial authority area and for New Zealand overall. The growth rates are as follows:
- Ashburton District: 1.6 per cent
- Auckland: 4.7 per cent
- Buller District: -1.9 per cent
- Carterton District: 0.8 per cent
- Central Hawke's Bay District: 1.2 per cent
- Central Otago District: 1.3 per cent
- Christchurch City: 2.8 per cent
- Clutha District: 2.5 per cent
- Dunedin City: 3.4 per cent
- Far North District: 2.8 per cent
- Gisborne District: 4.5 per cent
- Gore District: 3.1 per cent
- Grey District: 4.7 per cent
- Hamilton City: 3.7 per cent
- Hastings District: 4.0 per cent
- Hauraki District: 0.0 per cent
- Horowhenua District: 2.1 per cent
- Hurunui District: 2.2 per cent
- Invercargill City: 3.9 per cent
- Kaikoura District: 0.3 per cent
- Kaipara District: 5.0 per cent
- Kapiti Coast District: 4.4 per cent
- Kawerau District: 1.3 per cent
- Lower Hutt City: 1.7 per cent
- Mackenzie District: -2.3 per cent
- Manawatu District: 3.4 per cent
- Marlborough District: 4.3 per cent
- Masterton District: 4.1 per cent
- Matamata-Piako District: 2.4 per cent
- Napier City: 4.1 per cent
- Nelson City: 3.7 per cent
- New Plymouth District: -3.0 per cent
- New Zealand: 3.4 per cent
- Opotiki District: 4.6 per cent
- Otorohanga District: -1.7 per cent
- Palmerston North City: 4.3 per cent
- Porirua City: 2.3 per cent
- Queenstown-Lakes District: 5.6 per cent
- Rangitikei District: 2.2 per cent
- Rotorua District: 3.3 per cent
- Ruapehu District: 4.1 per cent
- Selwyn District: -1.1 per cent
- South Taranaki District: 0.1 per cent
- South Waikato District: 2.2 per cent
- South Wairarapa District: 0.5 per cent
- Southland District: -0.6 per cent
- Stratford District: 0.2 per cent
- Tararua District: 0.7 per cent
- Tasman District: 3.6 per cent
- Taupo District: 4.5 per cent
- Tauranga City: 5.7 per cent
- Thames-Coromandel District: 3.8 per cent
- Timaru District: 2.7 per cent
- Upper Hutt City: 0.7 per cent
- Waikato District: -0.2 per cent
- Waimakariri District: 1.4 per cent
- Waimate District: -0.6 per cent per cent
- Waipa District: 2.3 per cent
- Wairoa District: 1.3 per cent
- Waitaki District: 2.0 per cent
- Waitomo District: 3.5 per cent
- Wellington City: 3.4 per cent
- Western Bay of Plenty District: 5.2 per cent
- Westland District: 3.6 per cent
- Whakatane District: 1.9 per cent
- Whanganui District: 2.5 per cent
- Whangarei District: 3.8 per cent.
Metropolitan comparison
GDP per capita has grown in New Zealand’s three main metropolitan areas
A comparison of the three main metropolitan areas shows that they have different overall levels of GDP per capita, but all have had GDP growth. The three metropolitan areas are: Auckland (the area covered by the Auckland Council), Wellington Met (comprised of Wellington City, Lower Hutt City, Upper Hutt City, and Porirua City territorial authority areas), and Christchurch Met (comprised of Christchurch City, Selwyn, and Waimakariri territorial authority areas).
Auckland, Wellington and Christchurch GDP per capita was higher than the rest of New Zealand
Wellington Met has had the highest GDP per capita of all metropolitan areas since at least 2006. The difference in GDP per capita between Wellington Met and Auckland has been maintained at approximately $15,000 since 2010. Christchurch Met GDP per capita grew quickly after the Canterbury earthquakes, then more slowly from 2015 onwards. All metropolitan areas have had higher GDP per capita than the rest of New Zealand during the period for which we have data (2006-19).
Figure 3: Annual nominal GDP per capita for main metropolitan areas, 2010-2019
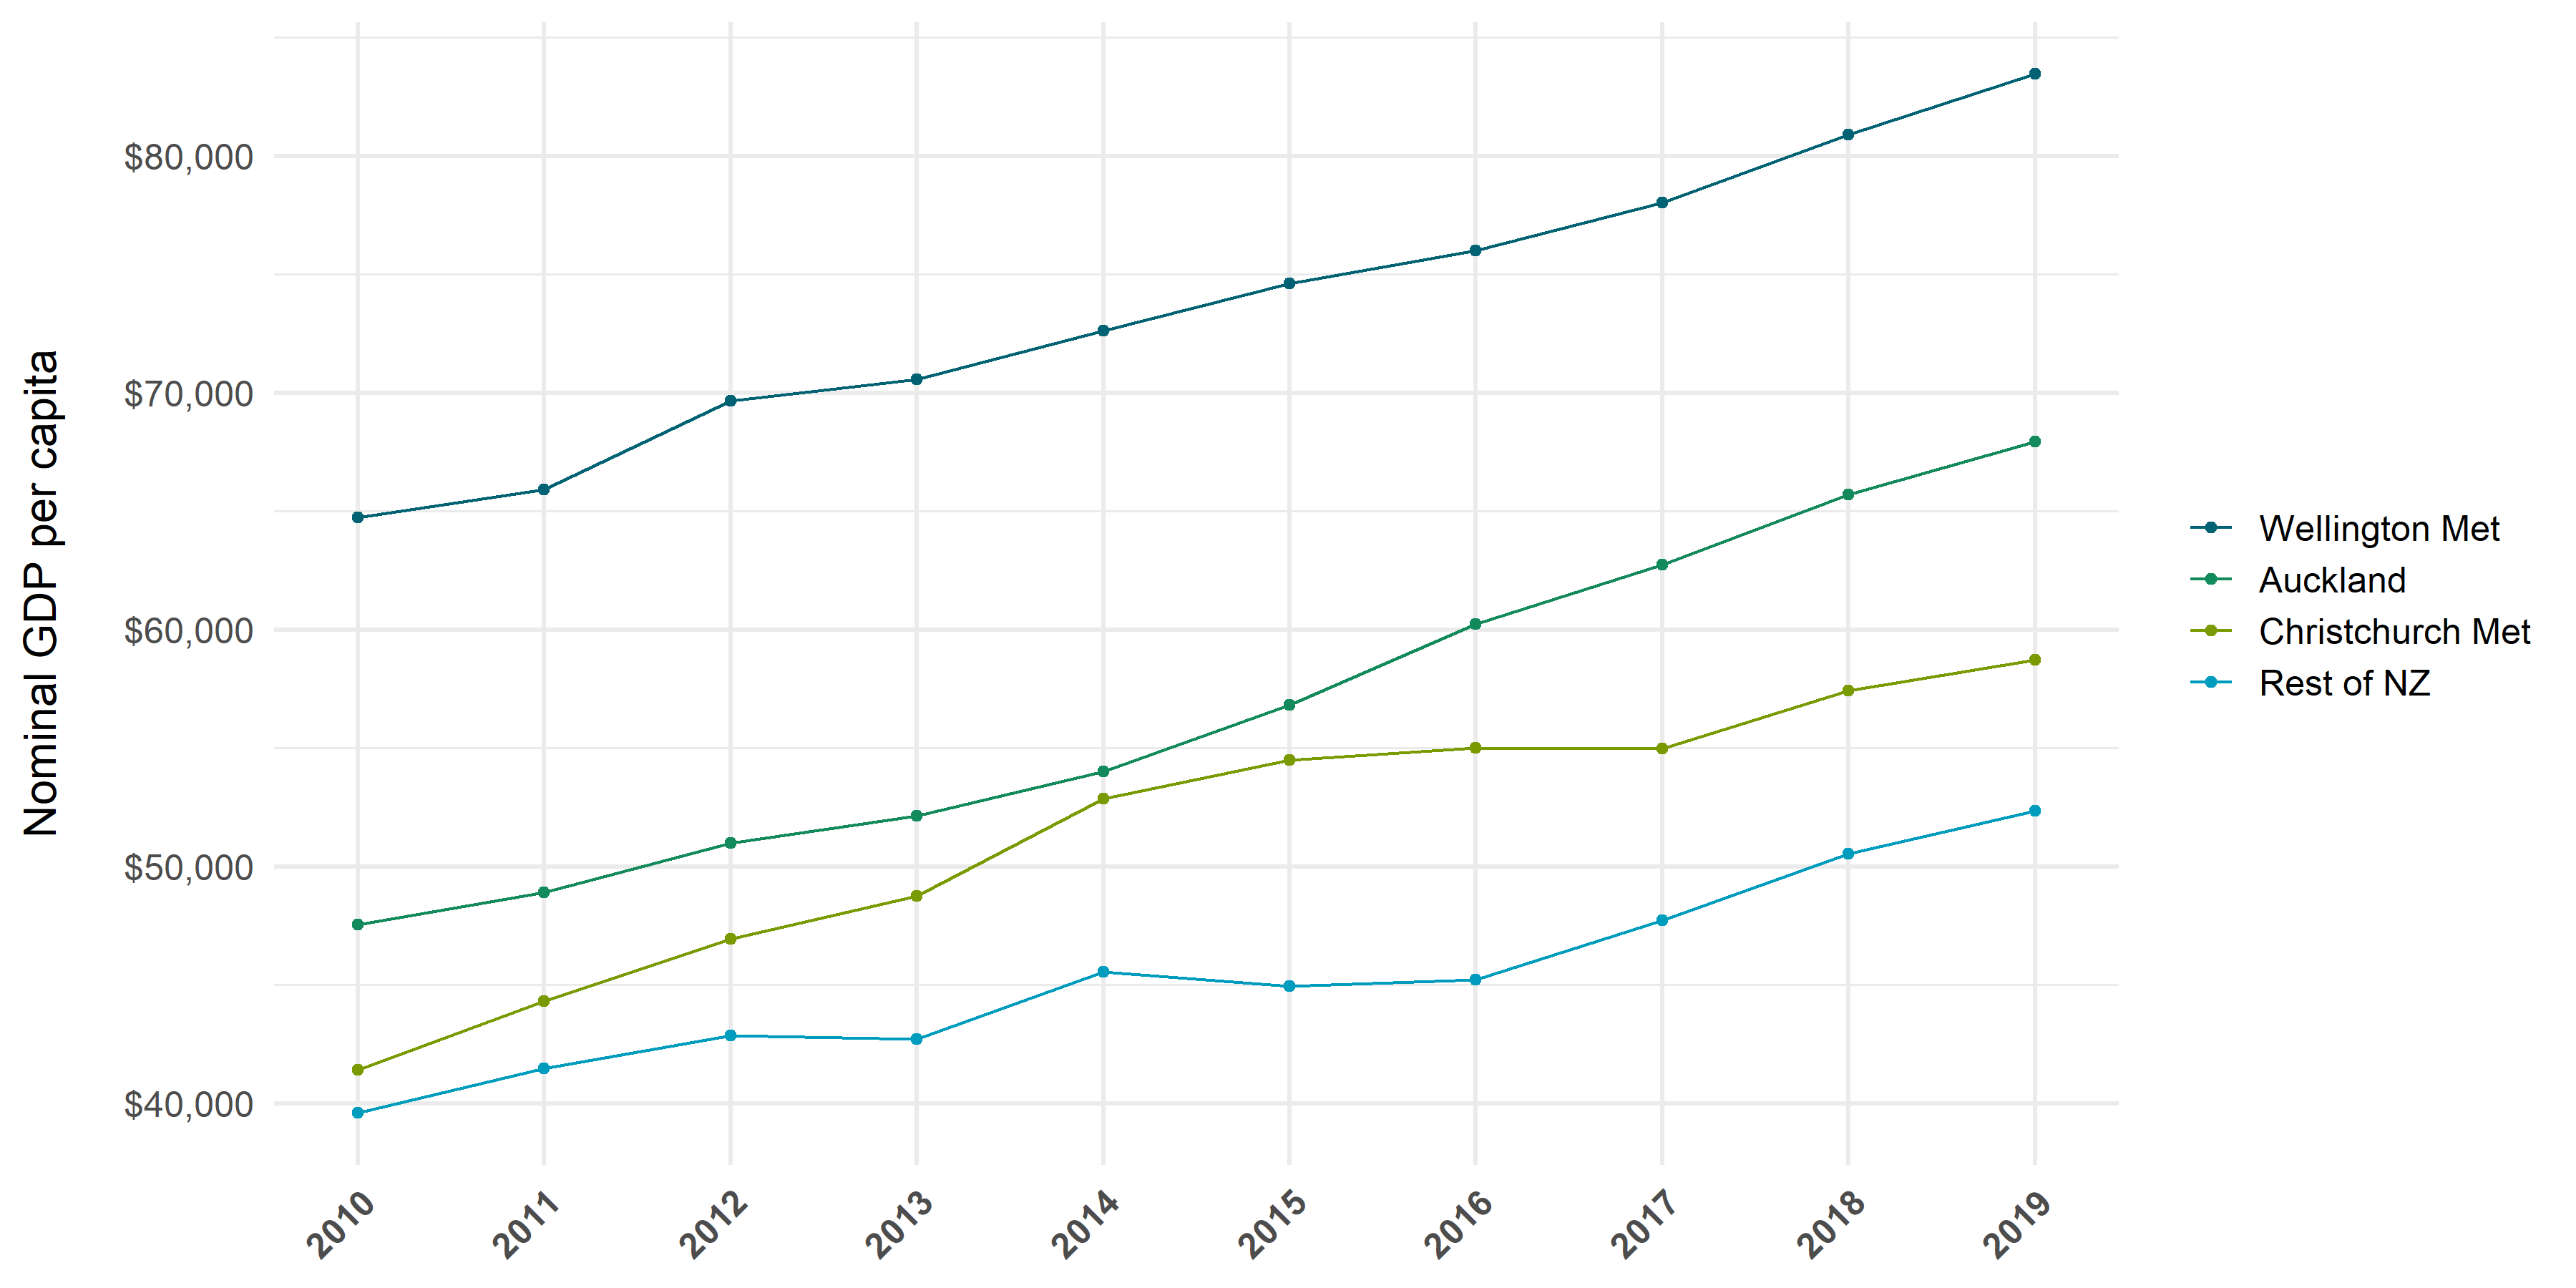
Chart description
Chart showing the annual nominal GDP per capita for Wellington Met, Auckland, Christchurch Met and the rest of New Zealand. Wellington Met has the highest per capita GDP, which climbed steadily, from $64740 in 2010 to $83458 in 2019. Auckland has the next highest per capita GDP, which also climbed steadily from $47540 in 2010 to $67925 in 2019. Christchurch Met per capita GDP was $41402 in 2010 and $58719 in 2019. It climbed steeply from 2010 to $52878 in 2014, then more slowly after that. All other areas are combined into a single category: the rest of New Zealand, which had the lowest GDP per capita: $39594 in 2010, rising to $52355 in 2019.
Auckland’s share of New Zealand’s GDP (37.6 per cent) was higher than its share of the population (33.8 per cent), as was Wellington Met’s (11.8 per cent of GDP and 8.6 per cent of the population). Christchurch Met had a slightly lower share of New Zealand’s GDP (10 per cent) than the population (10.4 per cent). And the remaining areas in New Zealand had a lower share of GDP (40.6 per cent) than the population (47.3 per cent).
Figure 4: Metropolitan areas’ shares of New Zealand’s nominal GDP and population in 2019
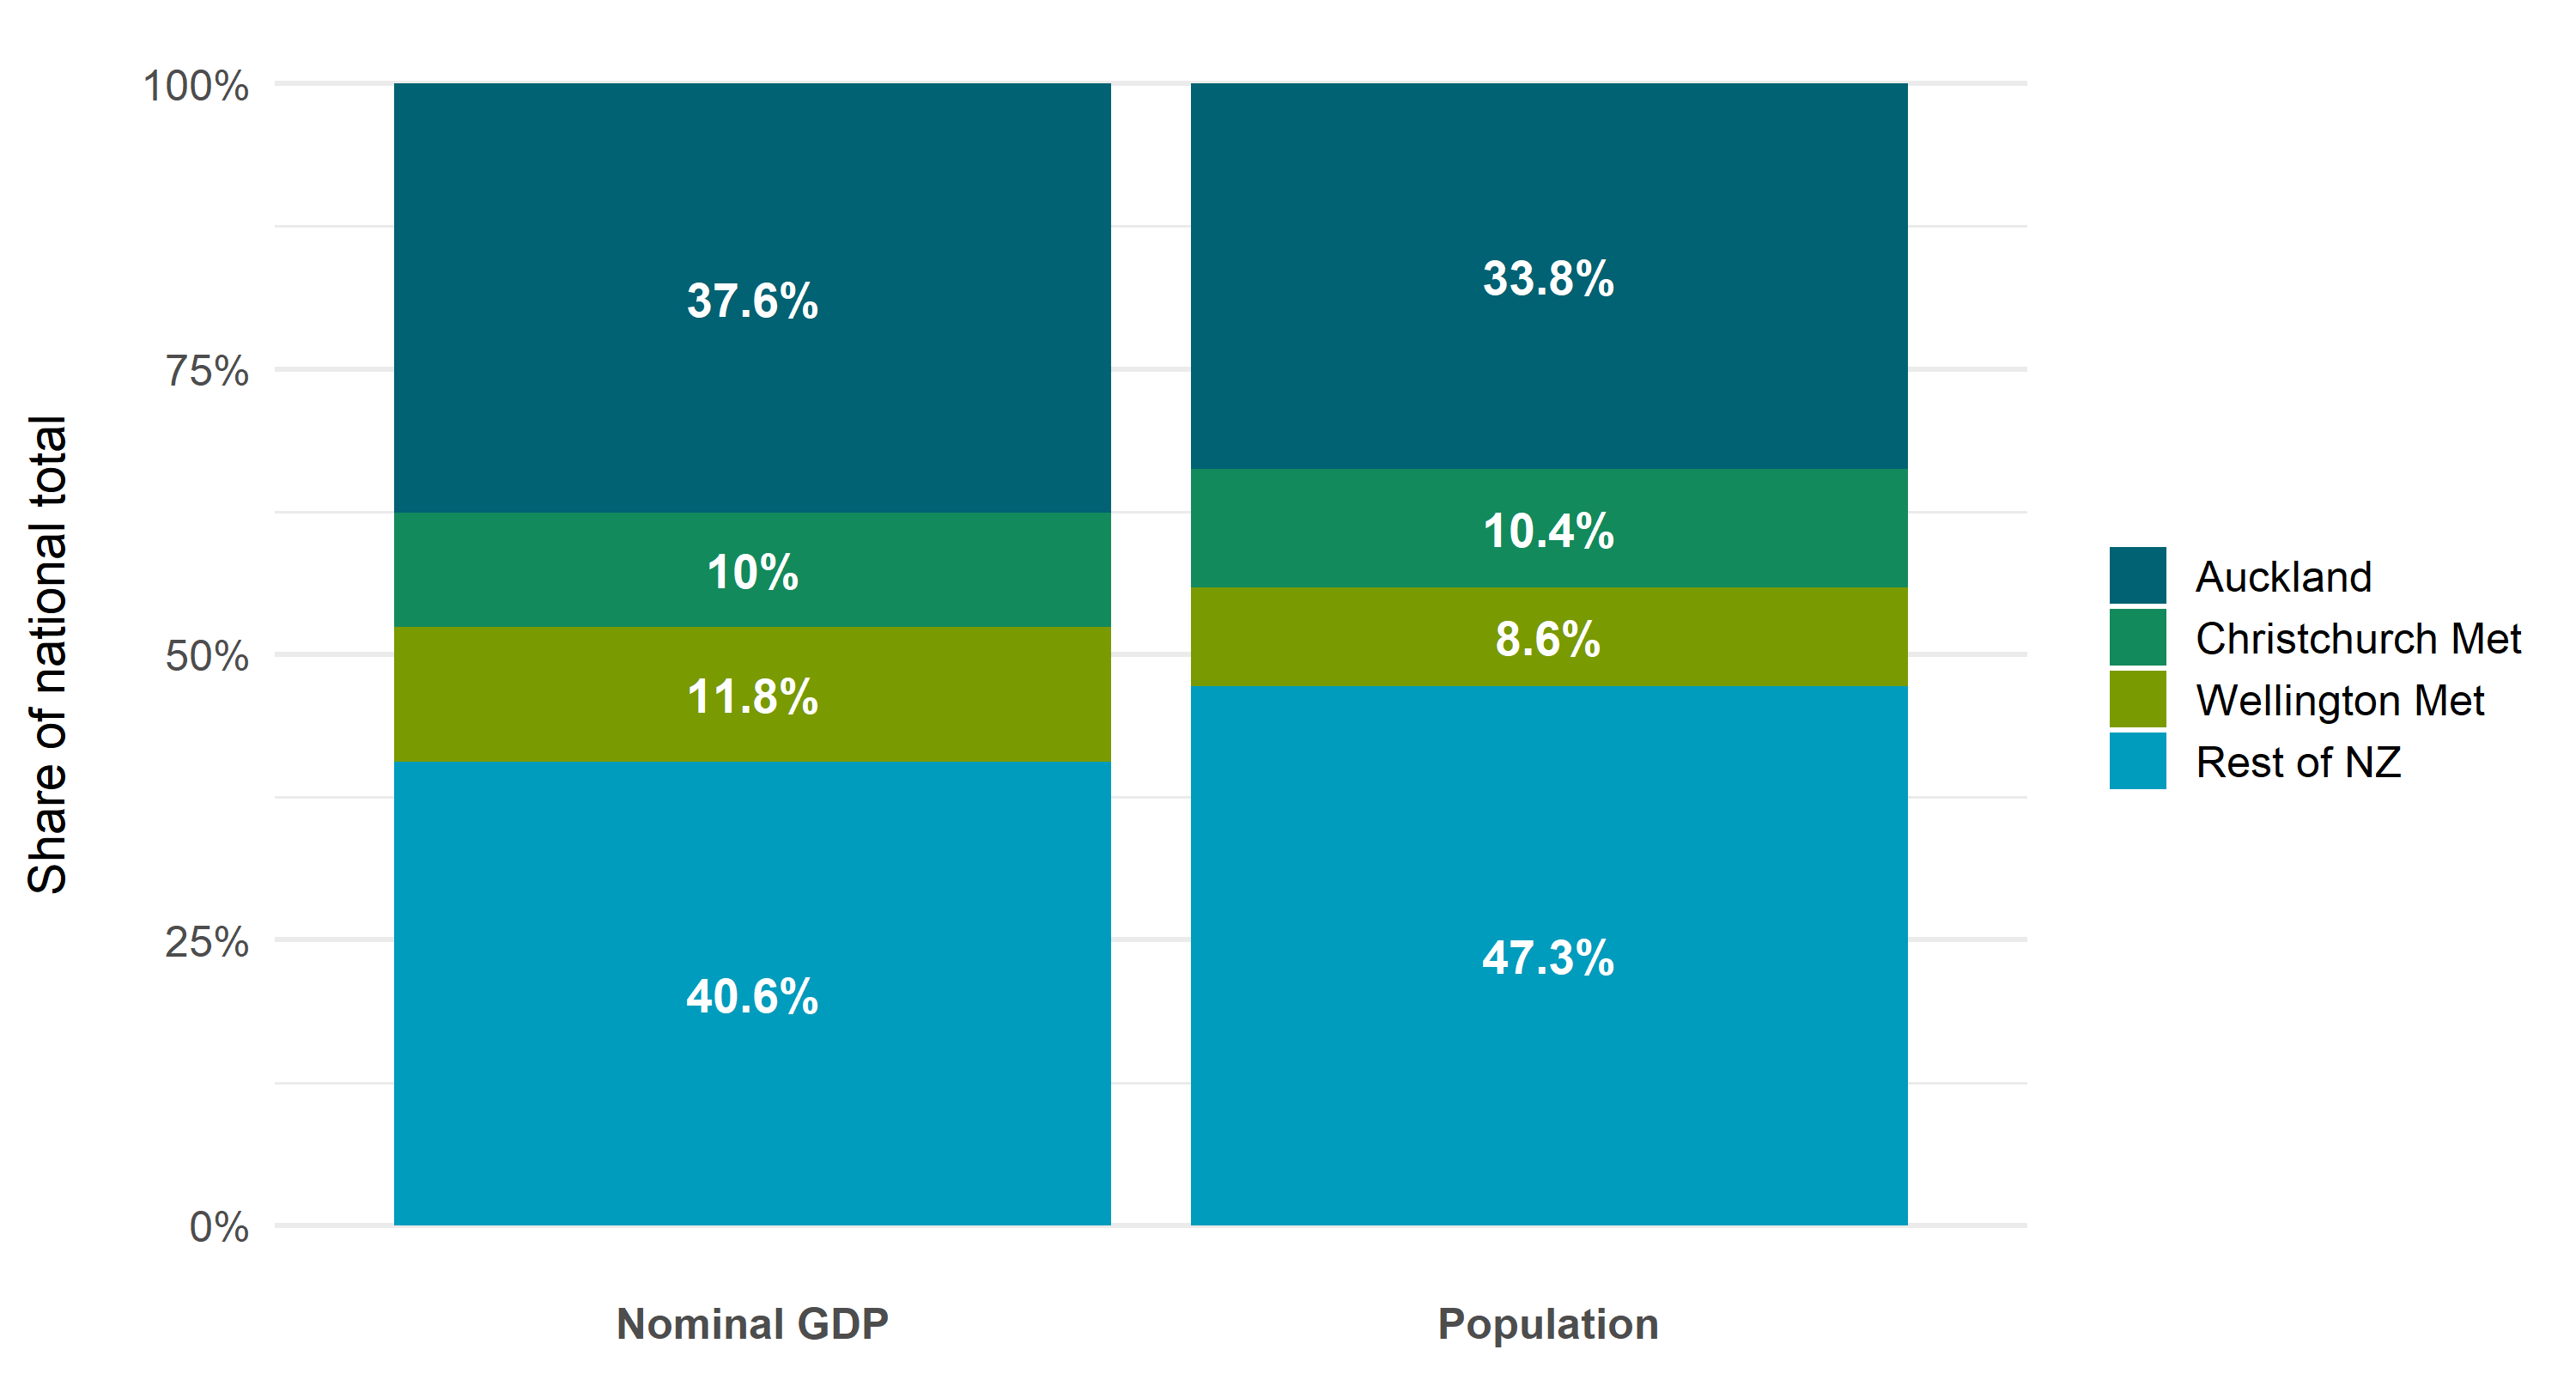
Chart description
Bar chart that compares each metropolitan area’s share of New Zealand’s nominal GDP with its share of the population, in 2019. The results are fully described in the text of this report.
Last updated: 21 December 2020