Modelled Territorial Authority GDP 2019 release
The Modelled Territorial Authority Gross Domestic Product (MTAGDP) estimates have been developed from Stats NZ Regional GDP estimates. They provide information at the territorial authority area level so that we can better understand local economies and industries.
Territorial authorities include both district councils and city councils. Some of these councils are unitary authorities, which also have the duties and powers of a regional council (Auckland Council, and Nelson City Council, for example).
On this page I tēnei whārangi
Data download
Full data table for MTAGDP [XLSX, 1.6 MB]
Main results
This release presents annual nominal GDP estimates for the year ended March 2018
In this release:
- Annual nominal GDP, up to the year ended March 2018, is provided for each territorial authority area and regional council region.
- A further breakdown by industry group is given, but is only available up to March 2017.
The estimates are of nominal GDP (sometimes known as current price GDP). Unlike real GDP, nominal GDP is not adjusted to remove the effects of inflation. This means that nominal GDP changes with shifts in both quantities and prices.
Nominal GDP grew in most regions and territorial authority areas
In the one-year period ended March 2018, annual nominal GDP increased in 60 of the 66 territorial authority areas. Six areas had negative growth, and a few had strong positive growth:
- The West Coast of the South Island was the only region that had a reduction in nominal GDP (-1.8%). Within this region, the Buller, Grey and Westland territorial authority areas’ declined -5.6%, -0.4% and -0.2% respectively.
- Outside of the West Coast region, negative nominal GDP growth also occurred in the Kawerau (-1.5%), Horowhenua (-1.5%) and Hurunui (-1.2%) territorial authority areas.
- The Queenstown-Lakes area had the strongest annual growth. At +15.8%, it was almost triple the New Zealand rate of +5.5%.
- Strong annual growth was also seen in the Tauranga (+10.3%), Invercargill (+9.3%) and Gore (+8.1%) territorial authority areas.
Over the five years from April 2013 to March 2018, nominal GDP grew in 62 of the 66 territorial authority areas. Four areas had negative growth over the five years, and a few had strong positive growth:
- Queenstown-Lakes had by far the strongest GDP growth, with a +7.9% compound annual growth rate (CAGR) over five years.
- In the South Island, strong growth was also seen in Marlborough (+5.9% five-year CAGR) and Tasman (+6.2% five-year CAGR).
- Strong five-year CAGRs were seen in the Northland territorial authority areas of Kaipara (+7.5%) and Whangarei (4.9%).
- In the Bay of Plenty region, strong five-year CAGRs were seen in Tauranga (+6.2%), Western Bay of Plenty (+5.5%), and Opotiki (+6.2%).
- Three Waikato region territorial authority areas had strong 5-year CAGRs: Taupō (+5.4%), Matamata-Piako (+5.3%) and Waitomo (+6.0%).
- In the Auckland region, the five-year CAGR was a strong +4.2%.
Population growth was not the only driver of growth in nominal GDP
An area’s per capita GDP is its nominal GDP divided by its population. Growth in per capita GDP is a useful measure because it removes changes that are only due to population growth.
Annual nominal GDP per capita for the year ended March 2018 increased in 57 of the 66 territorial authority areas, and decreased in nine:
- Strong growth in per capita nominal GDP was seen in Queenstown-Lakes (+9.0%), Invercargill (+8.8%) and Gore (+7.8%).
- Matamata-Piako and Tauranga also experienced strong per capita GDP growth for the year (+7.6% and +7.5% respectively).
- The Buller territorial authority area had the largest annual fall in per capita nominal GDP (-5.3%). Kawerau and Horowhenua per capita GDP also fell (-3.5% and -3.2% respectively).
Over the five years from April 2013 to March 2018, GDP per capita grew in 62 of the 66 territorial authority areas:
- The strongest per capita GDP CAGRs over the five years were in Queenstown-Lakes (+7.9%) and Kaipara (+7.5%).
- The weakest per capita GDP five-year CAGRs were in New Plymouth and Buller Districts, which declined by -3.8% and -3.4% per year, respectively.
Table 1: Fastest growing territorial authority areas ordered by the nominal GDP per capita compound annual growth rate over 5 years (2013-18)
| Territorial authority regions | GDP per capita growth | GDP growth | Population growth | |||
|---|---|---|---|---|---|---|
| 2013-2018* | 2017-2018 | 2013-2018* | 2017-2018 | 2013-2018* | 2017-2018 | |
| Queenstown-Lakes District | 7.9% | 9.0% | 13.8% | 15.8% | 5.5% | 6.3% |
| Kaipara District | 7.5% | 1.7% | 10.0% | 5.1% | 2.3% | 3.4% |
| Opotiki District | 6.2% | 0.1% | 6.8% | 1.7% | 0.5% | 1.6% |
| Tauranga City | 6.2% | 7.5% | 8.7% | 10.3% | 2.3% | 2.6% |
| Tasman District | 6.2% | 5.6% | 7.5% | 7.4% | 1.2% | 1.8% |
| Waitomo District | 6.0% | 6.4% | 6.6% | 6.3% | 0.6% | -0.1% |
| Marlborough District | 5.9% | 5.6% | 6.7% | 6.8% | 0.8% | 1.2% |
| Western Bay of Plenty District | 5.5% | -0.3% | 7.3% | 2.1% | 1.7% | 2.4% |
| Taupō District | 5.4% | 5.7% | 6.8% | 7.1% | 1.3% | 1.4% |
| Matamata-Piako District | 5.3% | 7.6% | 6.7% | 9.3% | 1.3% | 1.6% |
*Compound Annual Growth Rate (CAGR)
Source: MBIE
Figure 1: Fastest growing territorial authority areas (2013-18)
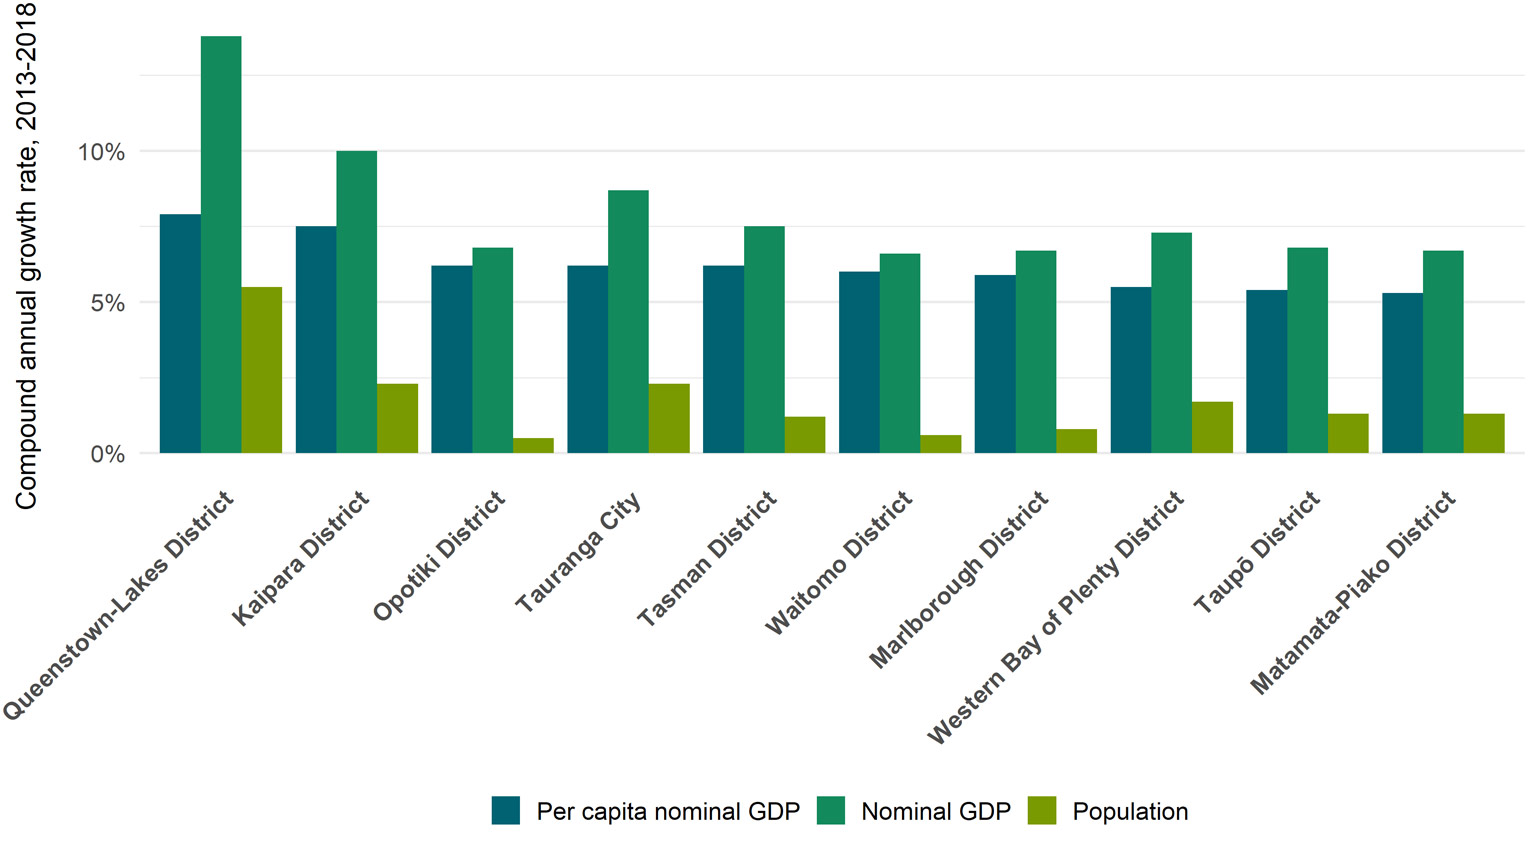
Chart description
Table 2: Slowest growing territorial authority areas ordered by the nominal GDP per capita compound annual growth rate over 5 years (2013-18)
| Territorial authority regions | GDP per capita growth | GDP growth | Population growth | |||
| 2013-2018* | 2017-2018 | 2013-2018* | 2017-2018 | 2013-2018* | 2017-2018 | |
| New Plymouth District | -3.8% | -0.6% | -2.7% | 0.7% | 1.2% | 1.3% |
| Buller District | -3.4% | -5.3% | -4.3% | -5.6% | -0.9% | -0.2% |
| Kawerau District | -1.7% | -3.5% | -1.0% | -1.5% | 0.8% | 2.0% |
| Stratford District | -0.9% | 0.8% | -0.4% | 1.9% | 0.5% | 1.1% |
| Central Hawke's Bay District | 0.4% | -1.0% | 1.5% | 1.0% | 1.0% | 2.0% |
| Selwyn District | 0.5% | 1.3% | 6.5% | 6.6% | 5.9% | 5.2% |
| Upper Hutt City | 1.0% | 2.7% | 2.0% | 4.0% | 1.0% | 1.3% |
| Waimate District | 1.0% | 0.3% | 1.4% | 0.3% | 0.4% | -0.1% |
| Otorohanga District | 1.2% | 1.1% | 2.4% | 2.5% | 1.3% | 1.4% |
| Lower Hutt City | 1.2% | 3.3% | 2.0% | 4.6% | 0.8% | 1.2% |
*Compound Annual Growth Rate (CAGR)
Source: MBIE
Figure 2: Slowest growing territorial authority areas (2013-18)
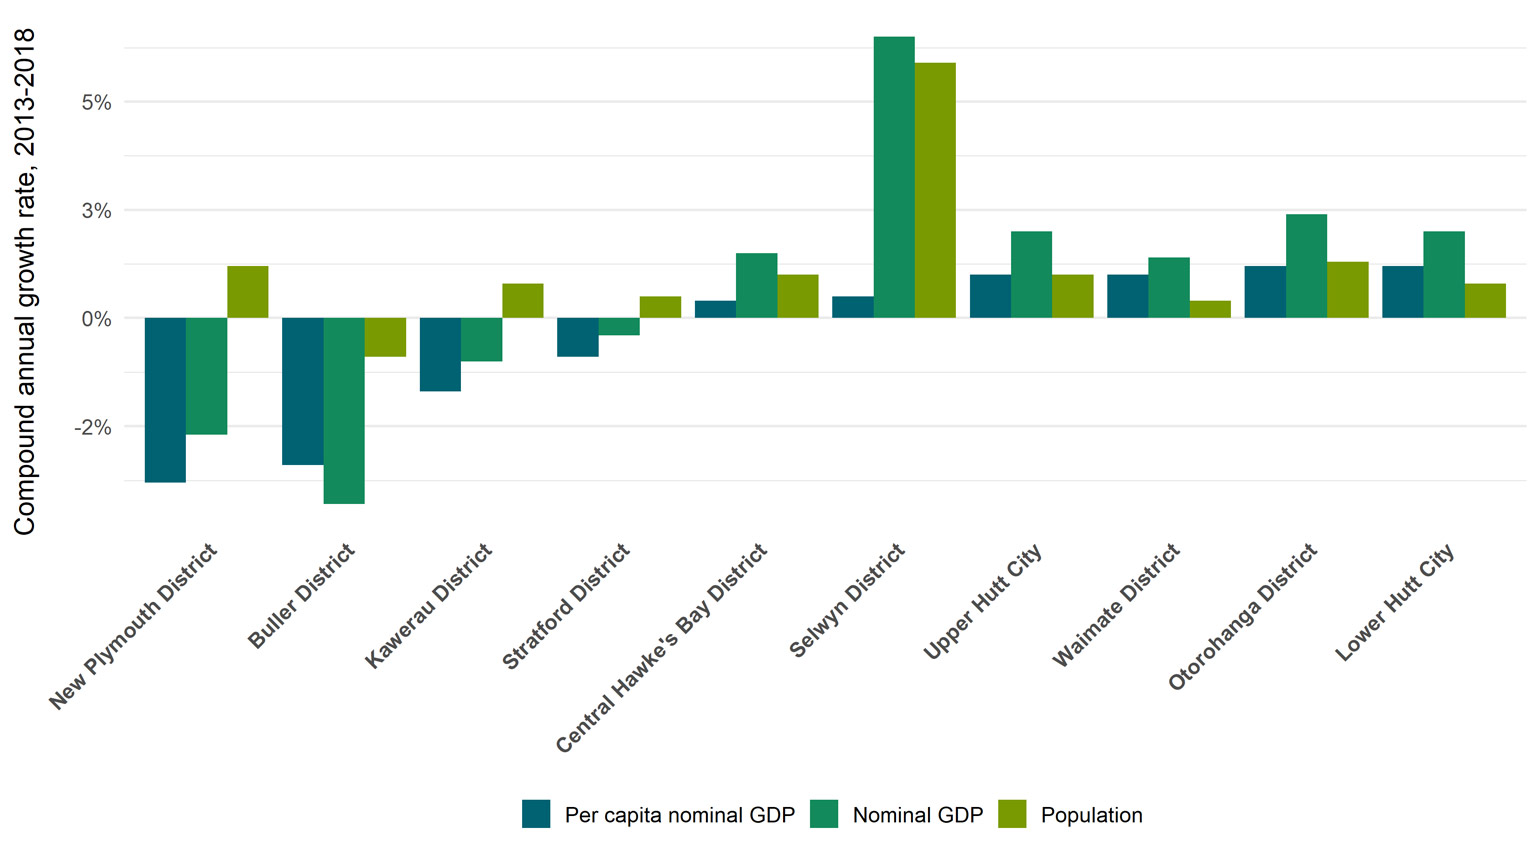
Chart description
Figure 3: Map of territorial authority GDP per capita five-year growth rates
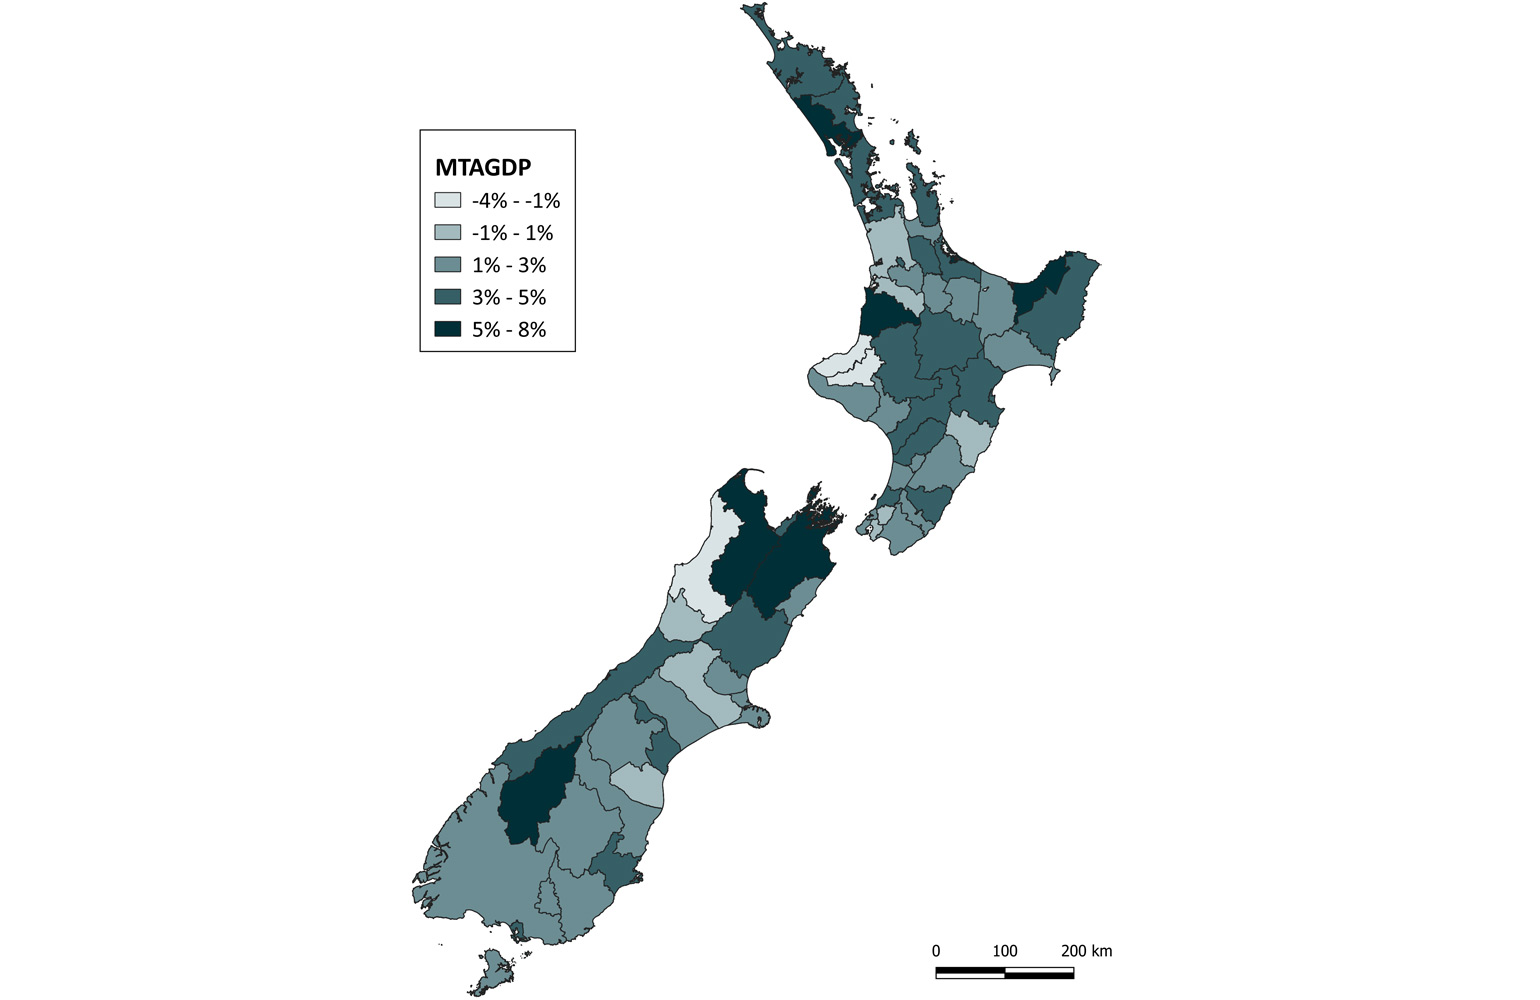
Average GDP per capita growth (2013-18)
Map description
Summaries for highlighted regions
Queenstown-Lakes
Queenstown-Lakes had very high GDP growth
Over the five years to March 2018, Queenstown-Lakes had the strongest GDP and GDP per capita growth of any territorial authority area. It also had very high population growth during this period.
Growth in GDP per capita (2013-18) was twice the New Zealand average. In 2013, Queenstown-Lakes per capita GDP was about 10% higher than the national average: $54,000 compared to $49,000 for New Zealand. In 2018, Queenstown Lakes GDP per capita had grown to $79,000, 35% higher than the New Zealand per capita GDP of $58,000.
Figure 4: Annual nominal GDP per capita, Queenstown-Lakes compared to New Zealand, 2009-2018
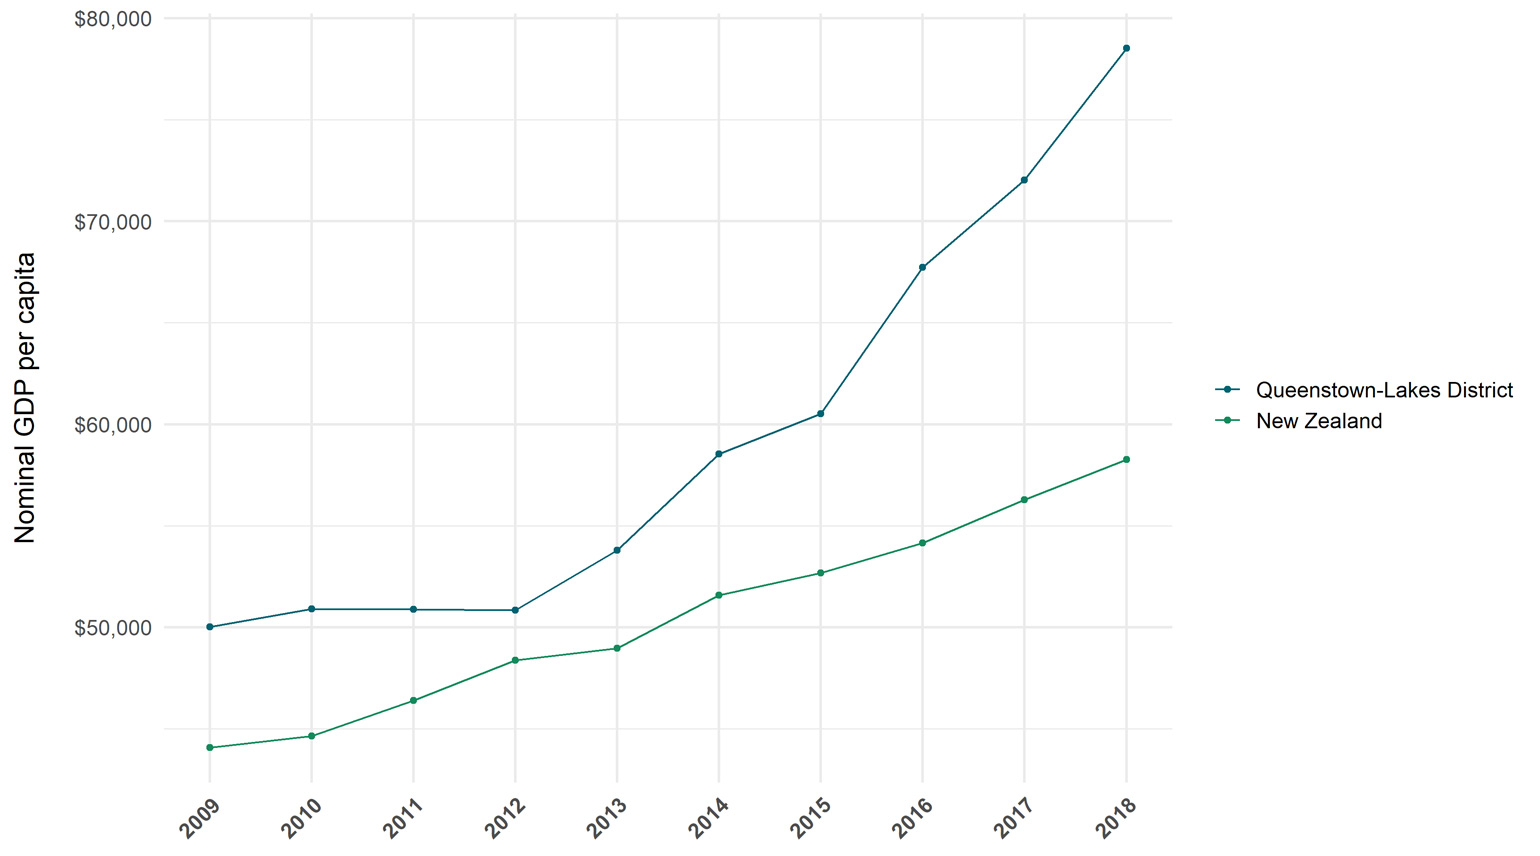
Chart description
Queenstown Lakes GDP growth has been driven by tourism and a growing population
Tourism and a rapidly growing population have fuelled the Queenstown-Lakes economy. This is reflected in the strength of its two largest industries: rental, hiring and retail estate services (16.2% of the Queenstown-Lakes nominal GDP in 2017) and construction (10.4% of the 2017 nominal GDP). Information media, telecommunications and other services (in particular, the arts and recreation services component of this) was Queenstown-Lakes third largest industry at 8.8%.
All three of these industries grew strongly:
- The GDP contribution of rental, hiring and retail estate services doubled to over $400 million between 2012 and 2017.
- Construction more than doubled from nearly $130 million in 2012, to $270 million in 2017.
- There was fluctuation in the growth of the information media, telecommunications and other services industry, but overall it grew more than 60% to $230 million in 2017.
Related to tourism, the accommodation industry was the sixth largest contributor to Queenstown-Lakes GDP (6.7% of 2017 nominal GDP) and accounted for a 10 times greater share of GDP than the national average.
Figure 5: Nominal GDP over time for the five largest industries in Queenstown-Lakes
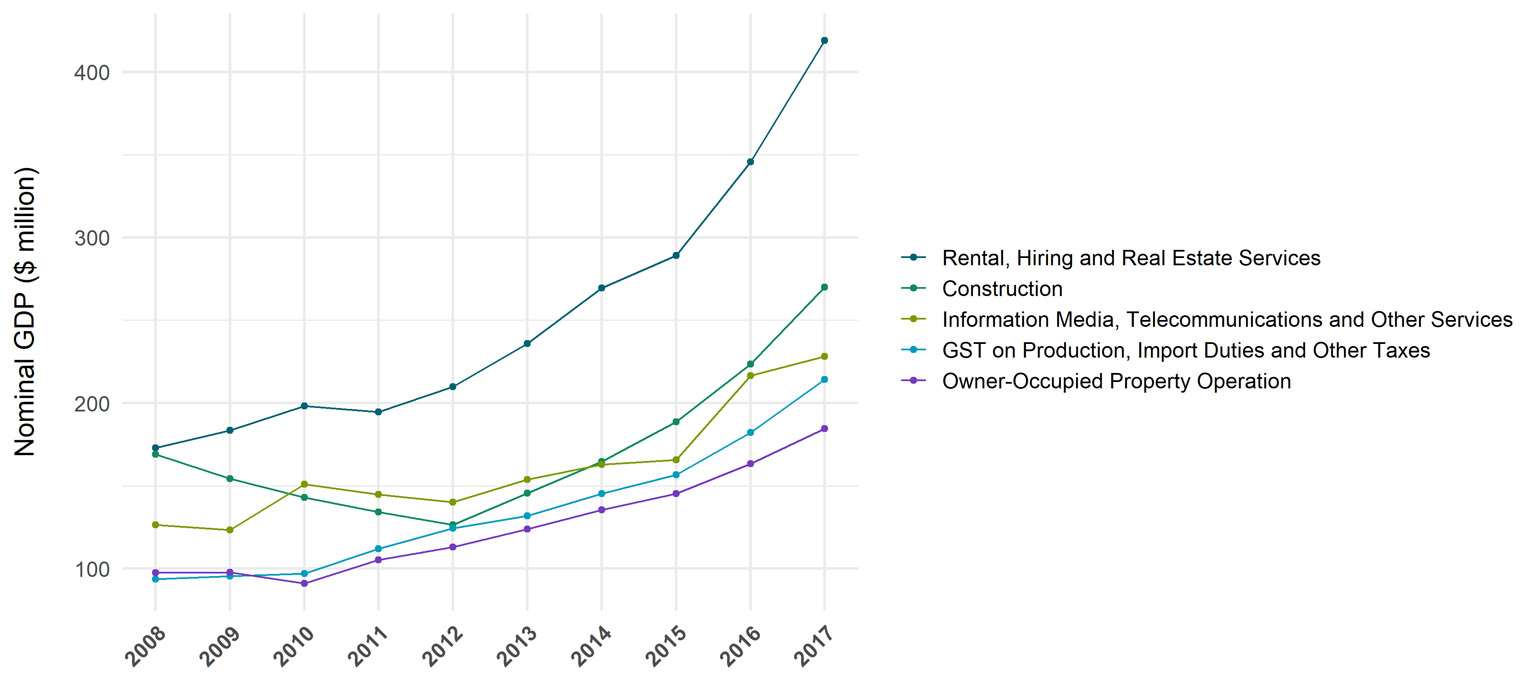
Chart description
Non tourism-related industries in Queenstown Lakes are smaller than New Zealand averages
Industries that are mostly unaffected by tourism, such as professional, scientific and technical services, agriculture, and manufacturing, had a lower share of the Queenstown-Lakes GDP than the national average. Most markedly, the manufacturing industry’s share of Queenstown-Lakes GDP was a modest 2.4%, compared to over 10% for New Zealand.
Figure 6: Industry share of Queenstown-Lakes’ nominal GDP, 2017
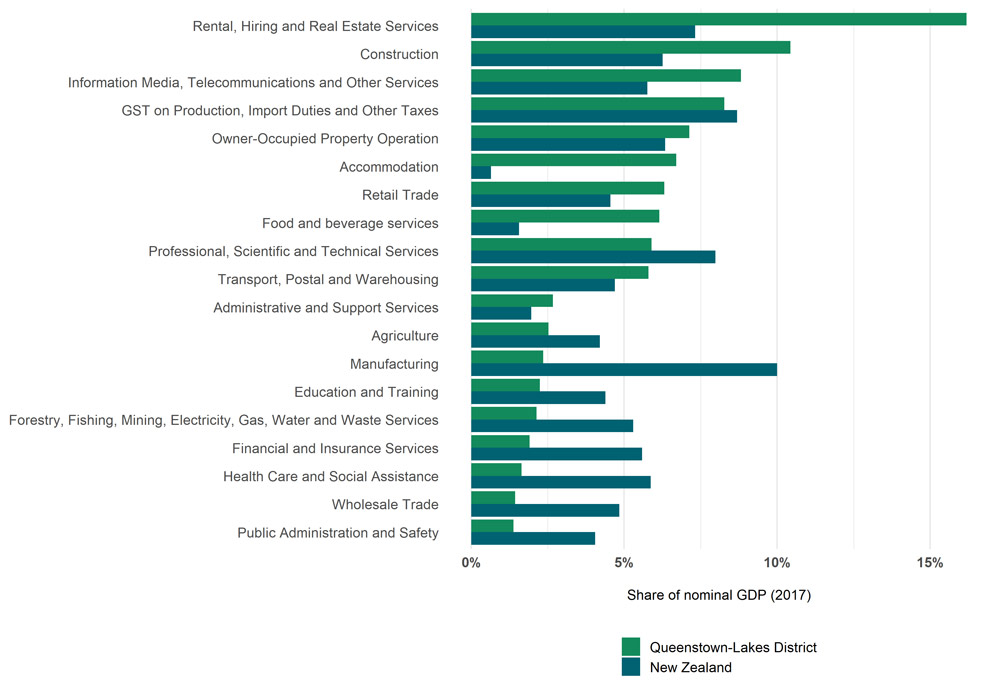
Chart description
Metropolitan comparison
GDP per capita has grown in New Zealand’s three main metropolitan areas
A comparison of the three main metropolitan areas shows that they have different overall levels of GDP per capita, but all have had GDP growth. The three metropolitan areas are: Auckland (the area covered by the Auckland Council), Wellington Met (comprised of Wellington City, Lower Hutt City, Upper Hutt City, and Porirua City territorial authority areas), and Christchurch Met (comprised of Christchurch City, Selwyn, and Waimakariri territorial authority areas).
Auckland, Wellington and Christchurch GDP per capita was higher than the rest of New Zealand
Wellington Met has had the highest GDP per capita of all metropolitan areas since at least 2006. The difference in GDP per capita between Wellington Met and Auckland has been maintained at approximately $15,000 since 2009. Christchurch Met GDP per capita grew quickly after the Canterbury earthquakes, then more slowly from 2015 onwards. All metropolitan areas have had higher GDP per capita than the rest of New Zealand during the period for which we have data (2006-18).
Figure 7: Annual nominal GDP per capita for main metropolitan areas, 2009-2018
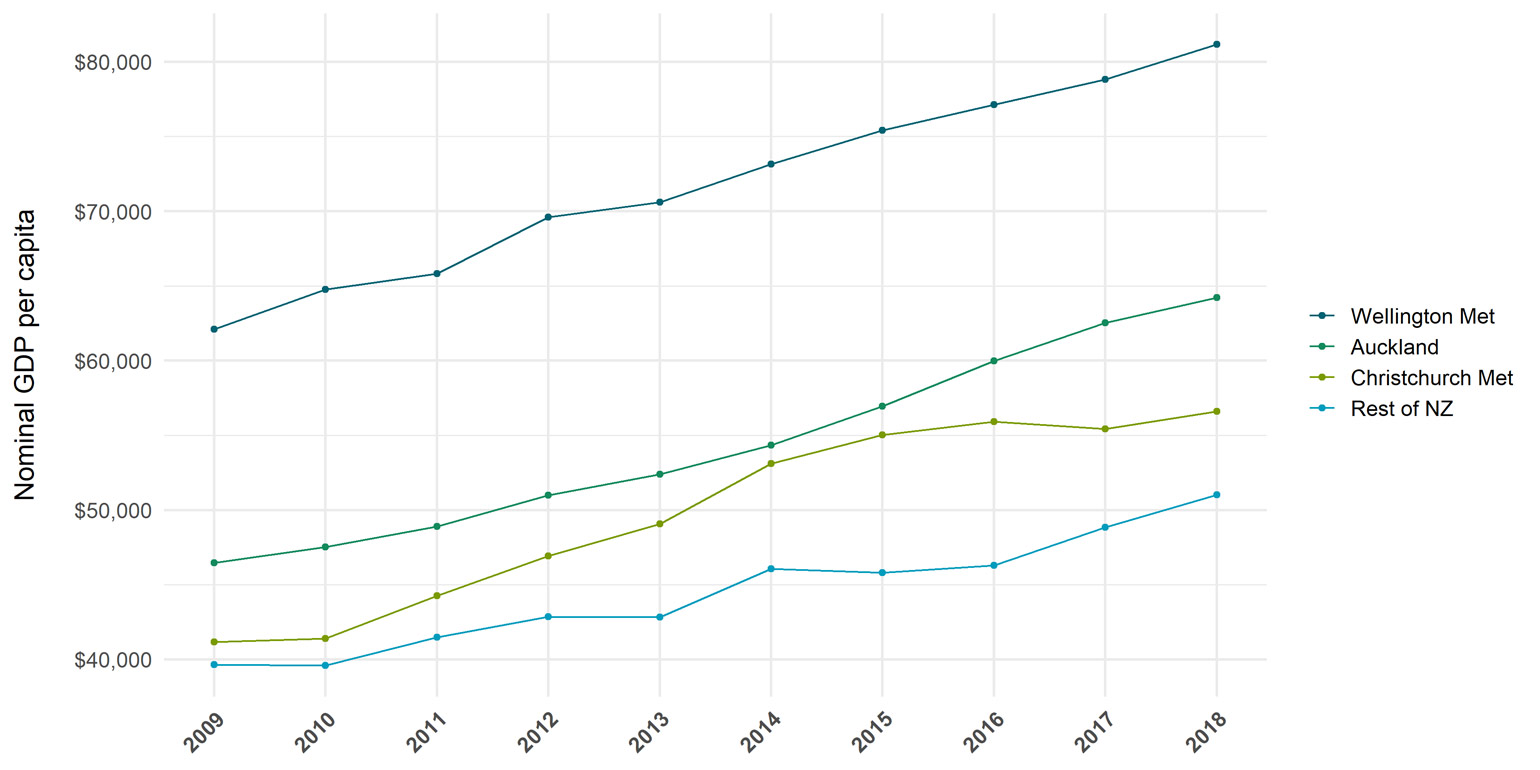
Chart description
Auckland’s share of New Zealand’s GDP (37.9%) was higher than its share of the population (34.6%), as was Wellington Met’s (12% of GDP and 8.7% of the population). Christchurch Met had a slightly lower share of New Zealand’s GDP (10.1%) than the population (10.5%). And the remaining areas in New Zealand had a lower share of GDP (40.1%) than the population (46.2%).
Figure 8: Metropolitan areas’ shares of New Zealand’s nominal GDP and population in 2018
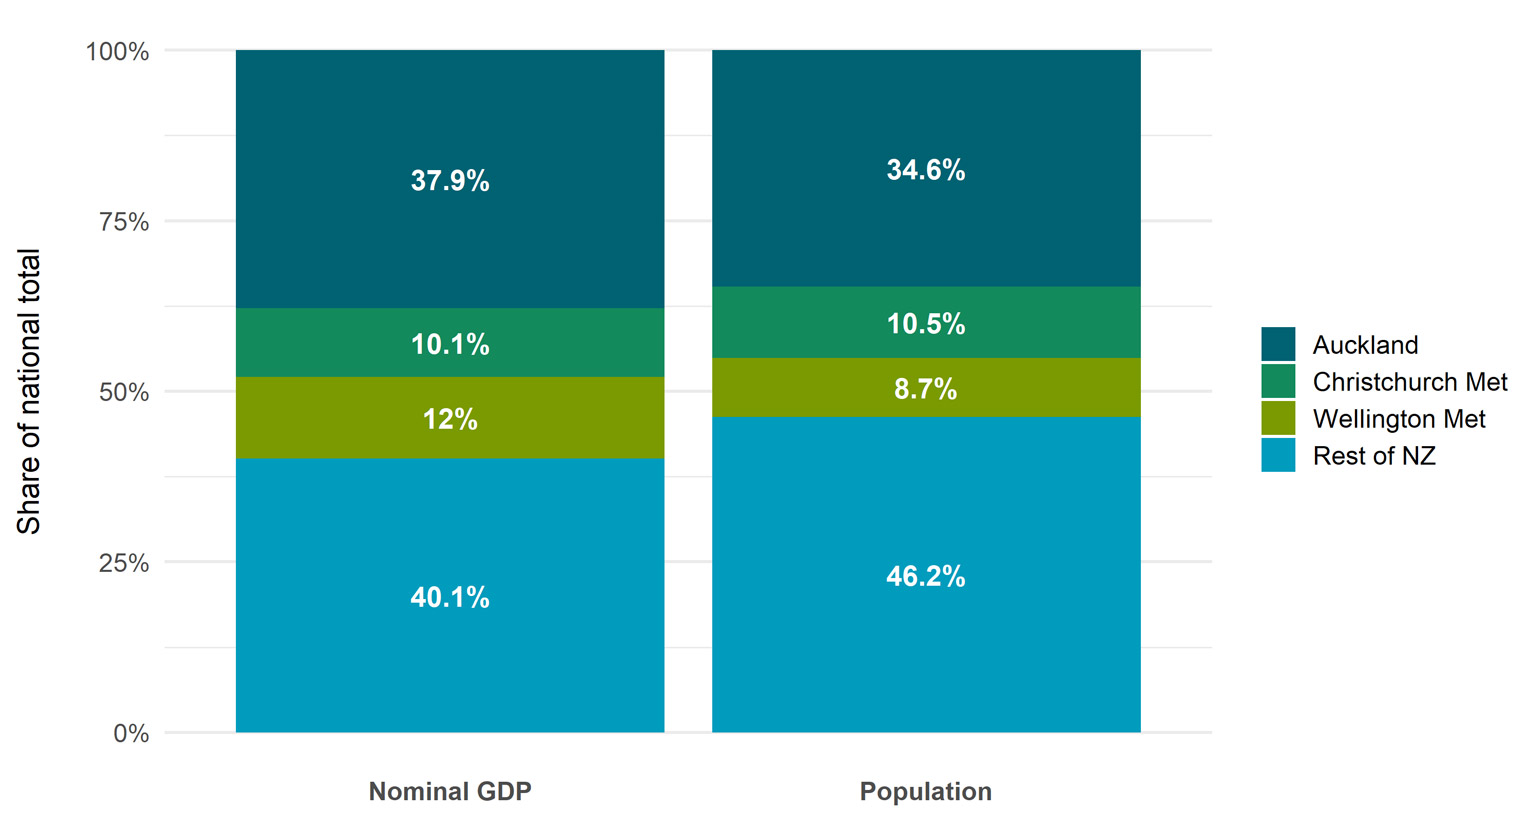
Chart description
Explore further
You can explore MTAGDP data graphically in our Regional Economic Activity Tools