Modelled Territorial Authority GDP 2018 release
The 2018 release of our experimental Modelled Territorial Authority Gross Domestic Product (MTAGDP) estimates is for the year ended March 2017.
On this page I tēnei whārangi
Data download
Full data table for MTAGDP [CSV, 2.9 MB]
Main results
Annual nominal GDP
The annual nominal GDP figures for territorial authority regions align with Statistics New Zealand’s annual nominal GDP figures for regional council regions. Nominal or current price GDP does not control for changes in prices.
- Annual nominal (non-inflation adjusted) GDP increased in 64 of the 66 territorial authority regions for the year ended March 2017. Only Central Hawke’s Bay had a small decline of -2.2%, while Wairoa was unchanged.
- Waipa and Kawerau had the strongest nominal annual GDP growth to the year ended March 2017 at +12.0% and +11.8% respectively, almost twice the New Zealand growth rate of +6.2%.
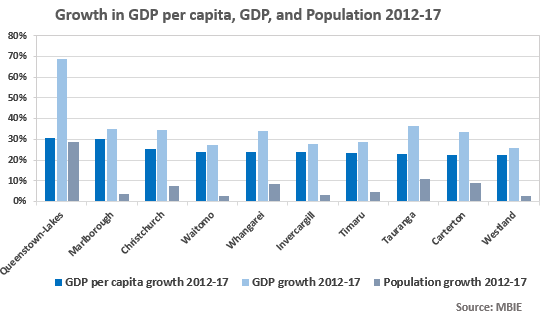
- Over a 5-year period, 59 of the 66 regions experienced nominal GDP growth. Queenstown-Lakes had by far the strongest growth, up +68.5%. Other regions that had very strong growth over this period include the Canterbury districts of Selwyn (+38.9%), Waimakariri (+38.7%), and Christchurch City (+34.7%). Tauranga, in the Bay of Plenty, grew +36.5%, and growth was also very strong in the Northland regions of Whangarei (+34.3%) and Kaipara (+34.1%).
- As a combined Regional Council and Territorial Authority, Auckland also grew a very strong +34.6% over the 5 years to March 2017, as did Marlborough (+34.9%). Carterton (+33.4%) was the stand out district for the Wellington region.
Per capita GDP
GDP per capita (nominal), controls for population growth and allows for a better comparison of GDP values between regions.
- Annual nominal GDP per capita for the year ended March 2017 increased in 64 of the 66 territorial authority regions. Central Hawke’s Bay had the largest fall (-4.0%) while Wairoa (also in the wider Hawke’s Bay region) fell -0.7%.
- Kawerau (+9.6%), Westland (+9.3%) and Waipa (+9.1%) had the strongest GDP per capita growth for the year ended March 2017. Westland’s per capita growth was accentuated by nearly flat population growth. Invercargill and Gore also had strong per capita GDP growth rates (+8.8 and +8.4%, respectively) accentuated by flat population growth.
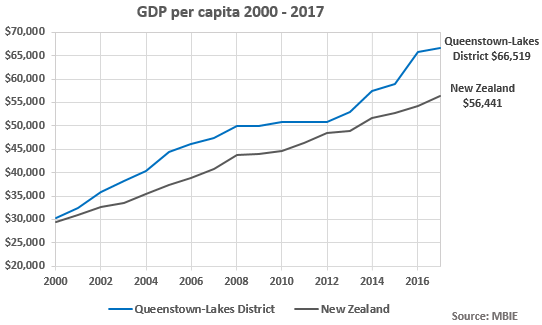
- Over a 5-year period, 54 of the 66 regions experienced GDP per capita growth. The strongest growth was seen in Queenstown (+30.8%) and Marlborough (+30.2%). Though the strongest, Queenstown’s GDP per capita growth was heavily offset by large population growth of +28.8% over the 5 years. Other regions growing robustly in GDP per capita were Christchurch (+25.4%), Waitomo (+24.1%), Whangarei (+24.0%), and Invercargill (+23.8%).
- Wellington City ($112,700) had easily the largest GDP per capita. It was followed by South Taranaki ($78,600) and New Plymouth ($72,900), and then by Queenstown-Lakes ($66,500) and Christchurch ($65,600).
- The territorial authorities with the lowest per capita GDP in the year ended March 2017 were Kapiti Coast ($22,200), Waimakariri ($26,400), South Wairarapa ($26,700), and Horowhenua ($27,700).
Table 1: Fastest growing TA regions by nominal capital GDP per capita growth over 5 years (2012-17)
| Territorial authority regions | GDP per capita growth | GDP growth | Population growth | |||
|---|---|---|---|---|---|---|
| 2012-2017 | 2016-2017 | 2012-2017 | 2016-2017 | 2012-2017 | 2016-2017 | |
| Queenstown-Lakes | 30.8% | 1.1% | 68.5% | 8.1% | 28.8% | 6.9% |
| Marlborough | 30.2% | 4.4% | 34.9% | 6.0% | 3.6% | 1.5% |
| Christchurch | 25.4% | 3.2% | 34.7% | 5.0% | 7.4% | 1.7% |
| Waitomo | 24.1% | 4.2% | 27.2% | 5.0% | 2.5% | 0.7% |
| Whangarei | 24.0% | 5.9% | 34.3% | 8.3% | 8.3% | 2.3% |
| Invercargill | 23.8% | 8.8% | 27.6% | 9.0% | 3.0% | 0.2% |
| TImaru | 23.3% | 4.1% | 28.7% | 5.0% | 4.4% | 0.9% |
| Tauranga | 22.8% | 6.5% | 36.5% | 9.3% | 11.2% | 2.6% |
| Carterton | 22.5% | 4.1% | 33.4% | 5.7% | 8.9% | 1.6% |
| Westland | 22.4% | 9.3% | 26.0% | 9.9% | 2.9% | 0.6% |
Source: MBIE
Regional summaries for highlighted regions
The following summaries are for regions that have stood out because they have had the highest or lowest GDP growth rates or GDP per capita. This section takes a look at the economic characteristics and composition of these regions using the GDP by industry figures that are available for March 2000-16 years.
We focus on the regions with outstanding per capita GDP growth over a 5-year period, which is the preferred indicator of growth as it smooths out short-term fluctuations and is less subject to revisions in the data. The main standout is the Queenstown-Lakes District.
Queenstown-Lakes
-
Queenstown-Lakes had easily the strongest growth in GDP over the 5 years to March 2017, at +68.5%. Its annual growth to 2017 was also relatively high at +8.1%. Its per capita GDP growth over 5 years was a very strong +30.8%, but this was less than half its total GDP growth rate due to very high population growth over the same period (+28.8%). Its annual per capita growth rate over the year to 2017 was a low +1.1% due mainly to the strongest population growth in the country over that period (+6.9%).
-
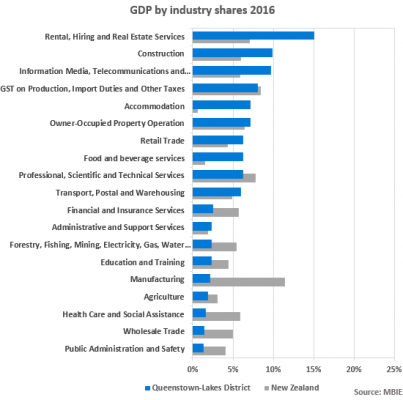
Tourism and a rapidly growing population are fueling the Queenstown-Lakes economy, and this is reflected in the strength of its 2 largest industries, which were rental, hiring and retail estate services (15.1% of Queenstown’s total GDP in 2016) and construction (9.9%). Information media, telecommunications and other services (in particular, the arts and recreation services component of this) is Queenstown’s third largest industry at 9.7%. GDP growth in the 4-year period from 2012 to 2016 was driven by strong increases in rental, hiring and real estate services; construction; and information media, telecommunications and other services (particularly arts and recreation services). Food and beverage services, and transport, postal and warehousing, were also strong contributors to growth over the period.
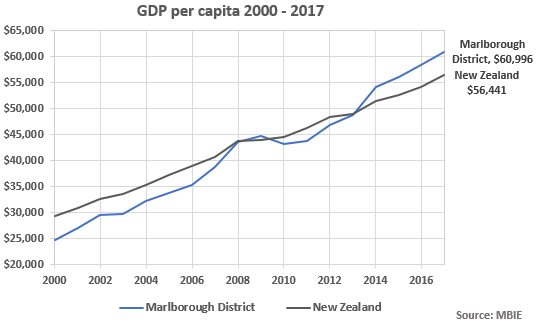
Marlborough
-
Marlborough had the fifth strongest growth in GDP over the 5 years to March 2017, at +34.9%. Its annual growth to 2017 was also a robust +6.0%. Its per capita GDP growth over 5 years was a very strong +30.3%, just behind Queenstown, and partly due to only moderate population growth of +3.6% over that period. Its annual per capita growth rate over the year to 2017 was a reasonable +4.4%.
-
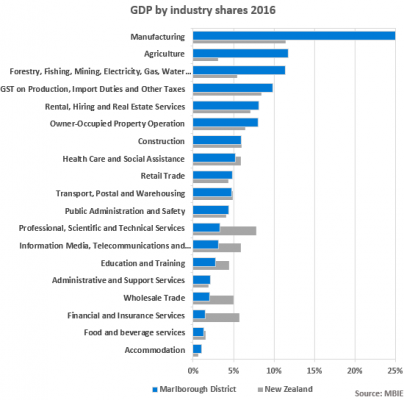
Manufacturing (particularly food and beverage manufacturing) is the main industry in Marlborough, followed by agriculture. They shared 22% and 10% respectively of the region’s GDP in 2016. This likely reflects the strength of wine production in the region. Over half of the land area in New Zealand committed to wine growing is in Marlborough. Growth in the manufacturing sector (especially in food and beverage manufacturing) drove the region’s overall economic growth over the period 2012 to 2016. Agriculture, and services to agriculture, were also strong contributors to the region’s high economic growth.
Explore further
You can explore MTAGDP data graphically in our Regional Economic Activity Tools