2026 release
The experimental Modelled Territorial Authority Gross Domestic Product (MTAGDP) allocates GDP values to second-tier local government administrative boundaries - namely, territorial authorities - based on Stats NZ’s Regional GDP estimates.
On this page I tēnei whārangi
While MTAGDP aims to estimate and allocate GDP to specific territorial authorities, the New Zealand economy operates as a single, interconnected, and interdependent system. No territorial authority is economically self-contained; activities span across territorial and regional boundaries, including non-adjacent regions and international markets. Despite this complexity, there is strong demand for GDP estimates at more granular, local levels.
MTAGDP measures are used to:
- quantify the size of local economies
- inform economic analysis, planning, and investment decisions
- highlight the contribution of territorial authorities to regional and national economies.
This modelling approach provides insights at the territorial authority level, supporting a deeper understanding of local economies and their industry structures.
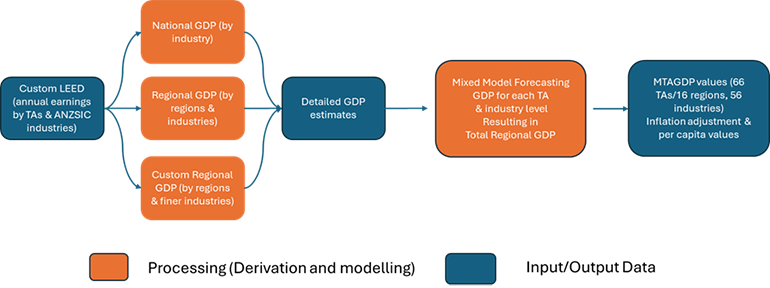
While regional GDP estimates are derived using a bottom-up method based on firm-level data, MTAGDP employs a top-down approach. It begins with regional estimates and disaggregates them to the local level. All annual values are considered estimates, with the latest year’s forecasts marked as provisional.
For the 2026 release, we present results from a refined and enhanced model, including estimates for the year ended March 2025 and updated figures for previous years.
Key findings
Nominal GDP growth
Over the 5 years to March 2025, nominal GDP increased in all territorial authority. The 5 largest increases were observed in:
- Invercargill
- Buller
- Tauranga
- Queenstown-Lakes
- Palmerston North.
GDP per capita
Invercargill and Palmerston North recorded the highest increases in GDP per capita. Key contributing industries were:
- Health care and social assistance
- Owner-occupier property operation.
Industry growth nationwide
The top 3 industries with the largest increases were:
- Health care and social assistance
- Construction
- Professional services.
Downloadable data
Nominal CAGR GDP and GDP per capita growth across territorial authorities
Between 2020 and 2025:
- Nominal GDP grew in all 66 territorial authority areas.
- GDP per capita increased in 61 of 66 areas.
As illustrated in Figure 1 and Figure 2, most areas experienced growth in both Compounded Annual Growth Rate (CAGR) for GDP and GDP per capita for the year ending March 2025. The top and bottom 10 Territorial Authority for CAGR for GDP are presented below.
Figure 1: 5-year percentage growth in CAGR for nominal GDP and GDP per capita by Territorial Authority (2025)
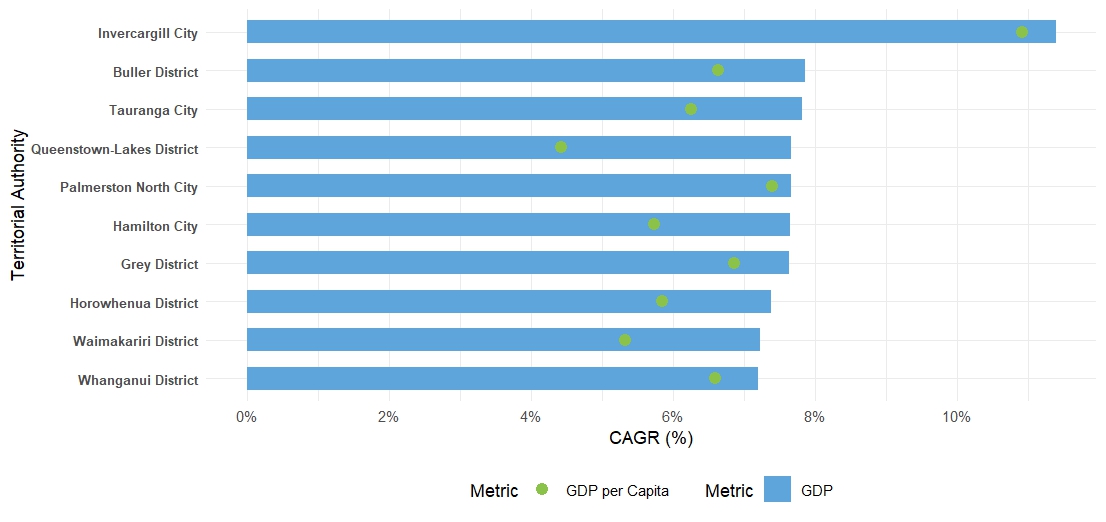
Chart showing the top 10 5 year compound annual growth rates (2020-2025) of nominal GDP of Territorial Authority and their corresponding GDP per Capita.
Text description for Figure 1
Figure 2: Bottom 10 territorial authorities by CAGR (GDP) 2020 - 2025
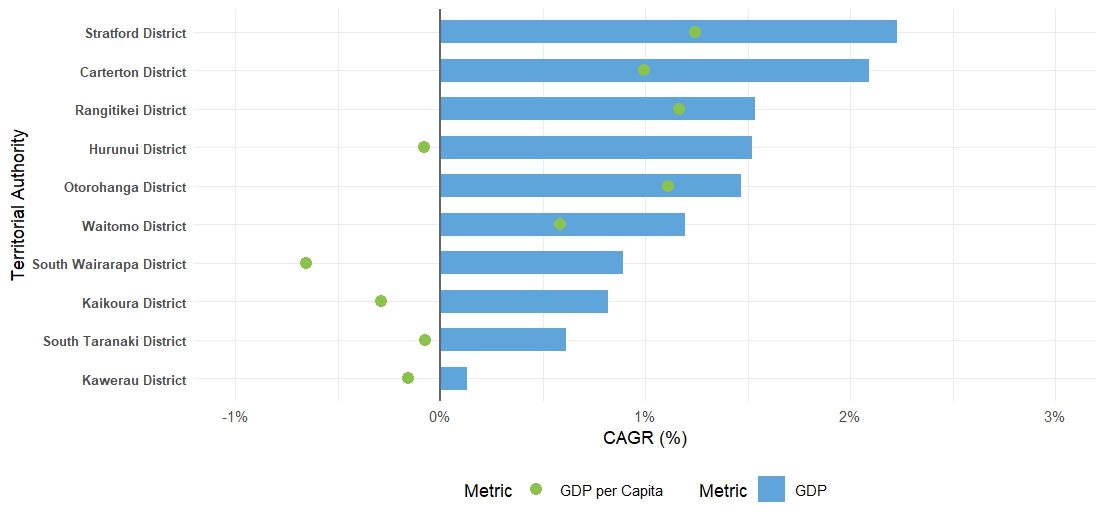
Chart showing the bottom 10 five year compound annual growth rates (2020-2025) of nominal GDP of Territorial Authority and their corresponding GDP per capita.
Text description for Figure 2
Metropolitan comparison
The 3 metropolitan areas are defined as:
- Auckland: Auckland Council area
- Wellington Metro: Wellington City, Lower Hutt City, Upper Hutt City, Porirua City
- Christchurch Metro: Christchurch City, Selwyn, Waimakariri Districts.
Figures 3 and 4 compare these metropolitan areas with provincial regions in the North and South Islands.
- Wellington continues to lead in GDP per capita among metropolitan areas.
- However, since 2010, Wellington’s GDP and GDP per capita growth have been slower compared to Auckland and Christchurch, and even more so compared to provincial South Island regions.
- Provincial North Island recorded the slowest growth in both metrics over the same period.
Figure 3: Normalised nominal GDP per capita for NZ regions (2010 to 2025)
Normalised GDP per capita by region (2010 = 1).
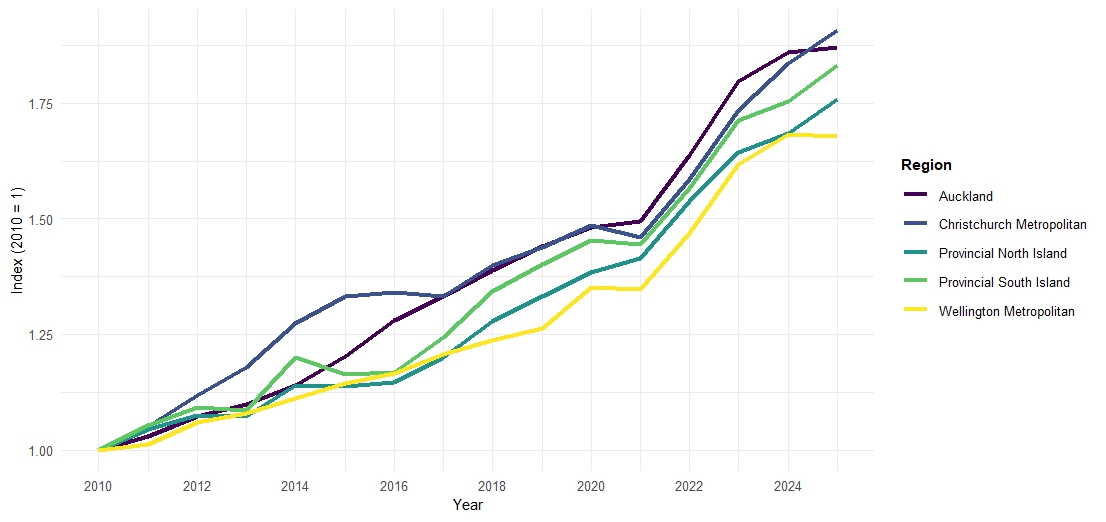
Normalised GDP by region (2010 = 1)
Text description for Figure 3
Figure 4: Annual nominal GDP per capita by regions (2010 to 2025)
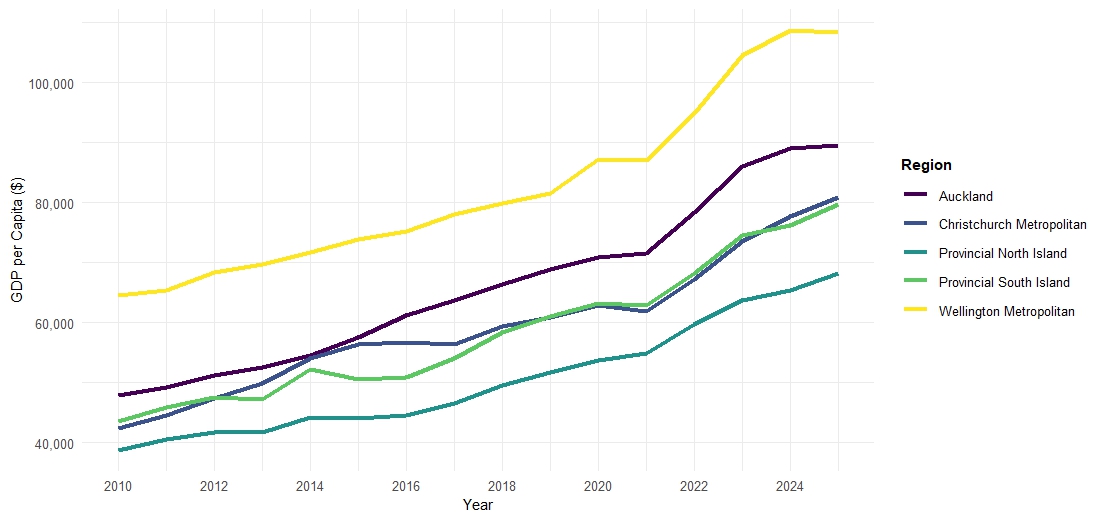
GDP per capita by region (2010 onwards)
Text description for Figure 4
Industry trends
Figures 5 and 6 show the industries with strongest and weakest growth from 2020 to 2024.
Strong industry growth
Over the 4 years to 2024, the industries with the most significant growth nationwide were:
- Health care and social assistance
- Financial and Insurance Services
- Construction.
Figure 5: Top 5 industries by GDP growth (2020 to 2024)
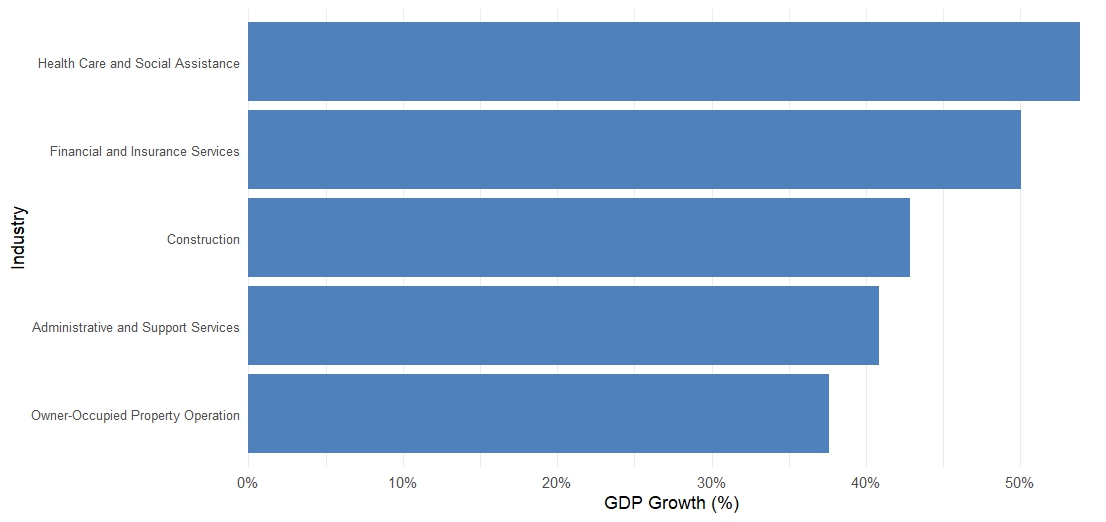
Chart showing the 5 industries that have grown the most between 2020 and 2024.
Text description for Figure 5
Weakest industry growth
Over the 4 years to 2024, the industries with the weakest growth nationwide were:
- Manufacturing
- Agriculture.
Figure 6: Bottom 5 industries by GDP growth (2020 to 2024)
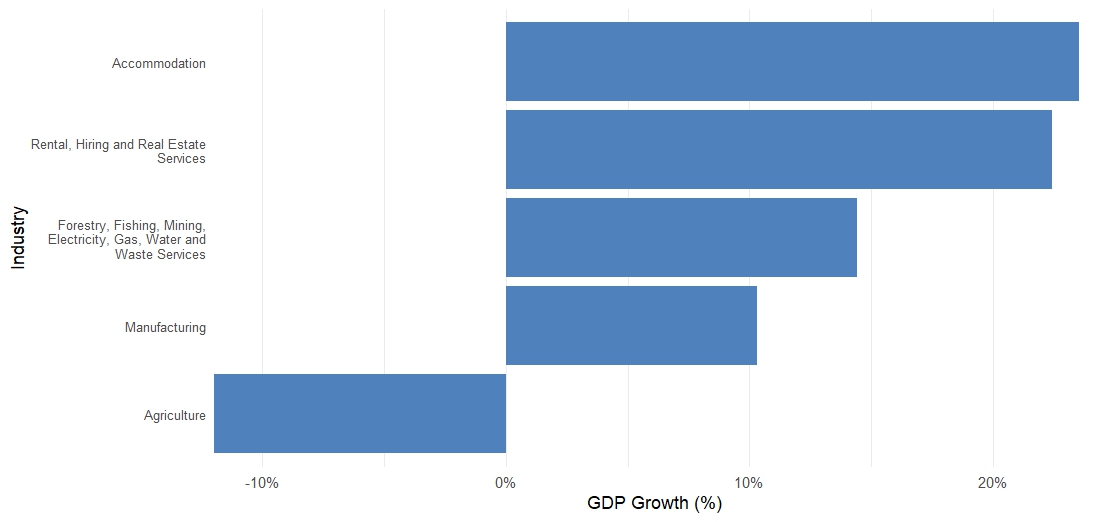
Chart showing the 5 industries that have grown the least between 2020 and 2024.
Text description for Figure 6
About the MTAGDP data
We reviewed and updated the MTAGDP method in 2025. The data now includes:
- GDP by TA and industry from 2000 to 2024 (year ending March)
- Total GDP by TA for 2025.
We’ve made the method simpler, improved the forecasting, and used better input data.
Important
The raw data used in MTAGDP is based on Stats NZ published and custom data, but the methodology is developed by MBIE. Stats NZ will not be held accountable for any error, inaccurate findings or interpretation within the MTAGDP results.
Due to the experimental nature of this product, it should be used with caution. While care and diligence have been used in developing the data for this product, MBIE cannot warranty it is error-free and will not be liable for any loss or damage suffered by the use, directly or indirectly, of it.
Visual representation of the GDP