Workforce demographics
On this page
Age
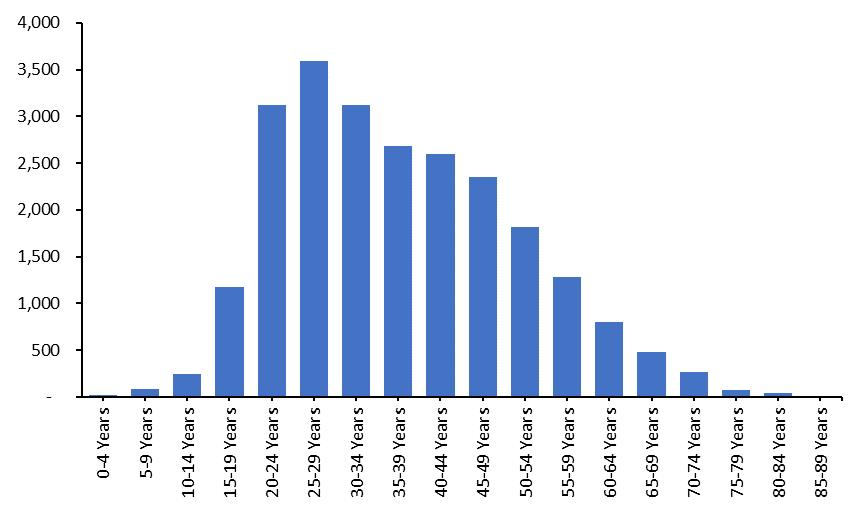
In March 2021, just over half of the screen sector’s workforce (53%) was aged between 20 and 39, while those 50 and over accounted for about 20% of the screen sector’s workforce (Figure 9).
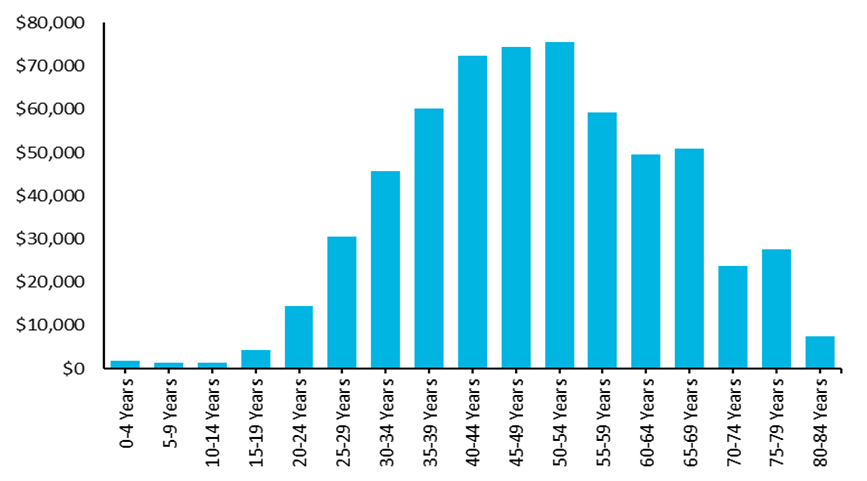
Figure 10 shows that in the tax year ending March 2021, screen sector workers within the 50 to 54 years age category had the highest average earnings of $75,600 per annum.
Figure 9: Count of screen sector workers broken down by 5-year age groups in the tax year ending March 2021
Data table for figure 9
Figure 10: Average earnings of screen sector workers broken down by 5-year age groups in the tax year ending March 2021
Data table for figure 10
Gender
In 2021, female workers accounted for 50.2% of the screen sector workforce and males accounted for 49.8%[1] (Table 6). This 50/50 split between male and female workers has remained stable over the last decade.
The distribution of earnings between male and female workers in the screen sector was relatively even in the tax year ending March 2021, with males and females having average earnings of $46,928 and $46,427 respectively[2][3] (Table 6).
Table 6: Female and male share of workforce and average earnings
| Female | Male | |
| Share of workforce | 50.2% | 49.8% |
| Average earnings | $46,427 | $46,928 |
Ethnicity
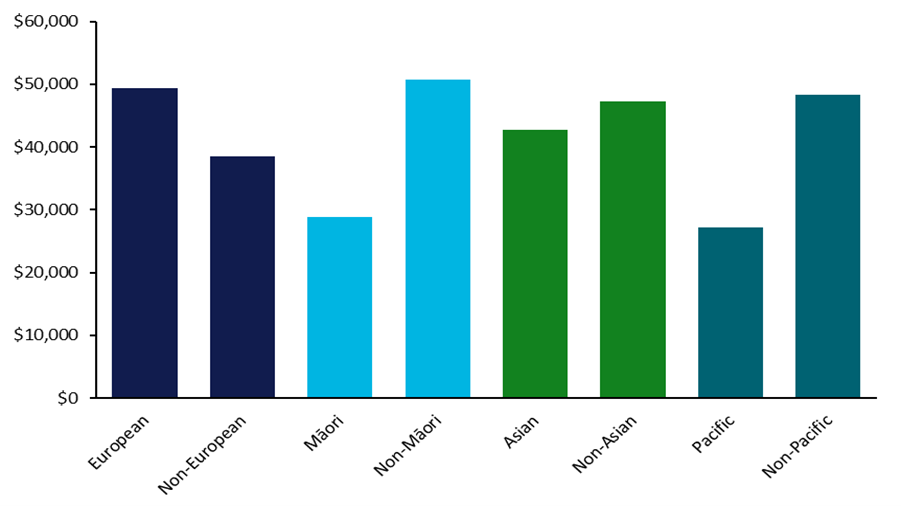
In the year ending March 2021, most screen sector workers (77%) identified with being European. This was followed by Māori at 17%, Asian at 11%, and Pacific at 7% (Table 7)[4].
In 2021, 21% of sole traders identified with being Māori. 15% of Directors, Shareholders, and Partners, and 14% of Waged and salaried employees identified with being Māori (Table 8).
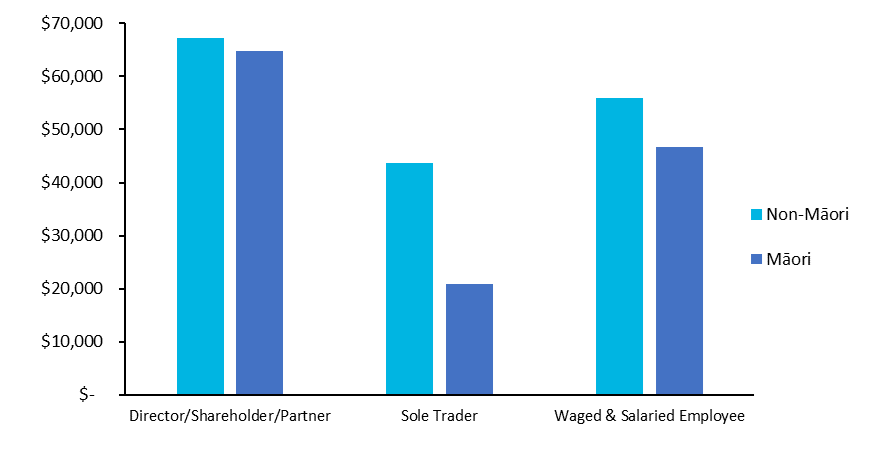
Between 2012 and 2021 average earnings for Māori workers receiving wages or salaries increased by 38%. Over the same period, the average earnings for Māori Directors, Shareholders and Partners increased by 21%, while the average earning for Māori sole traders increased by 19%.
In 2021 the average earnings of Māori Directors, Shareholders, and Partners were 4% less than non-Māori. The average earnings of Māori sole traders were 52% lower than the average earnings of non-Māori sole traders, and the average earnings of Waged and salaried Māori employees where 17% less than non-Māori (Figure 12).
Table 7: Count of people working in the screen sector broken down by ethnicity in the tax year ending March 2021
| Ethnicity | Share |
| European | 78.50% |
| Māori | 17.60% |
| Pacific | 7.40% |
| Asian | 11% |
| MELAA[5] | 3.70% |
| Other | 1.80% |
Table 8: Count of people working in the screen sector broken down by worker type and ethnicity in the tax year ending March 2021
| Māori ethnicity or descent | Non-Māori ethnicity or descent | |
| Sole trader | 3,270 | 11,952 |
| Waged and salaried employee | 972 | 5,883 |
| Director/shareholder/partner | 240 | 1,335 |
Figure 11: Average earnings of people working in the screen sector broken down by ethnicity in the tax year ending March 2021
Data table for figure 11
Figure 12: Average earnings of people working in the screen sector in 2021 broken down by worker type and ethnicity
Data table for figure 12
Highest qualification
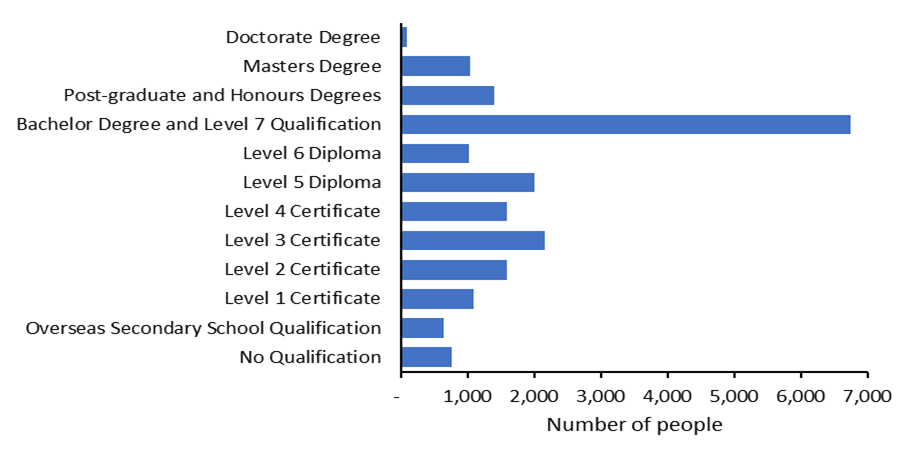
In 2021, 34% of the screen sector’s workforce had a bachelor’s degree, or level 7 equivalent, as their highest qualification (Figure 13). This proportion has remained stable between 2012 and 2021.
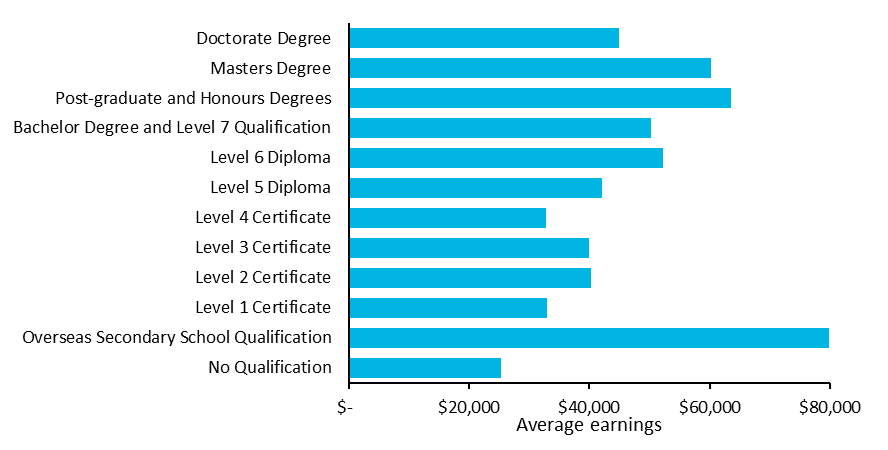
Screen sector workers with an overseas secondary school qualification as their highest qualification, had the highest average earnings in the tax year ending March 2021 of $79,800 (Figure 14). However, the average earnings of this group has been volatile over the last 10 years.
Screen sector workers with either a Post-graduate and Honours Degree, or a Master’s Degree, have had the highest percentage increase in average earnings at about 60% between 2012 and 2021.
Figure 13: Count of people working in the screen sector broken down by highest qualification in the tax year ending March 2021
Data table for figure 13
Figure 14: Average earnings of people working in the screen sector broken down by highest qualification in the tax year ending March 2021
Data table for figure 14
Visa status
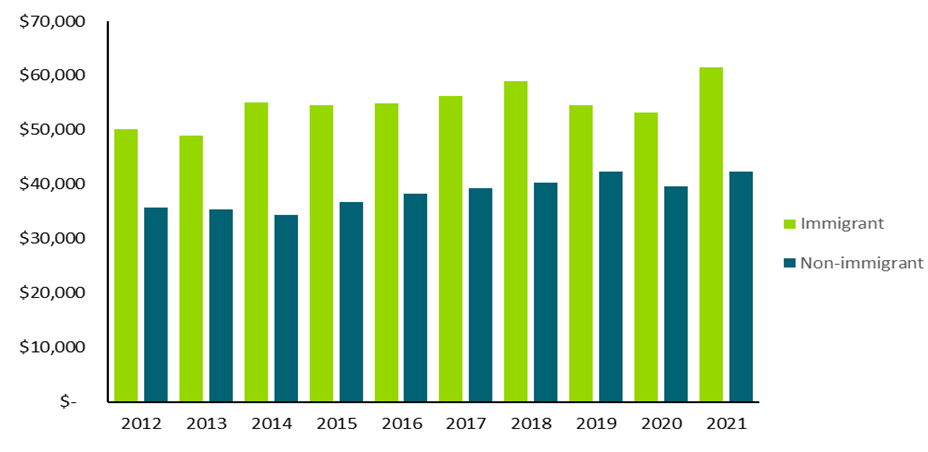
In 2021, 23% of the screen sector’s workforce had immigrated to Aotearoa New Zealand (on visas, including Permanent Resident visas). Between 2012 and 2021, the number of immigrants working in the screen sector increased by 1,707, or 44% (Table 9).
In the tax year ending March 2021, on average, migrants in the screen sector workforce earned around $19,000 more than non-migrants, with migrants having average earnings of $61,552 which compares with $42,337 for non-migrants (Figure 15).
Table 9: Count of screen sector workers who have immigrated to New Zealand broken down by year of employment[6]
| Year | Count |
| 2012 | 3,879 |
| 2013 | 4,056 |
| 2014 | 3,705 |
| 2015 | 3,774 |
| 2016 | 4,368 |
| 2017 | 4,692 |
| 2018 | 4,779 |
| 2019 | 5,442 |
| 2020 | 5,949 |
| 2021 | 5,586 |
Figure 15: Average earnings of screen sector workers broken down by visa status in tax years ending March 2021
Data table for figure 15
Notes
[1] It is important to note that gender data is not recorded for 25% of screen sector workers, additionally information on non-binary genders was not available in the source data.
[2] The average earnings of screen sector workers with no gender information available is $47,200. Given that gender information is sourced from the 2018 Census a reasonable explanation is that this group has a higher number of immigrants (whom have a higher average earning than non-immigrants). Females have had a 24% increase in average earnings since 2012 which is higher than males 21% increase.
[3] It is important to note that average earnings data does not account for the number of hours worked and can’t be used as a measure/comparison of pay rates.
[4] People can identify with more than 1 ethnicity, therefore the sum of all individuals by ethnicity would be greater than the total. All proportions are fractions of the total e.g. 77% of the workforce identify as European vs. 23% who do not identify as European and 11% of the workforce identify as Asian vs. 89% who don’t identify as Asian.
[5] MELAA – Middle Eastern, Latin American, and African.
[6] This visualisation captures any person in New Zealand on a visa (including a Permanent Resident visa) that works in the screen sector during each tax year.