Screen sector workforce
On this page
The screen sector’s workforce is made up of directors/shareholders/partners, sole traders, and waged and salaried employees. In the year to March 2021, a total of 24,096[1], [2] people worked in the screen sector. Between 2012 and 2021 the number of screen sector workers increased from 21,048 to 24,096, growing at an average rate of 1.7% each year (Table 4).
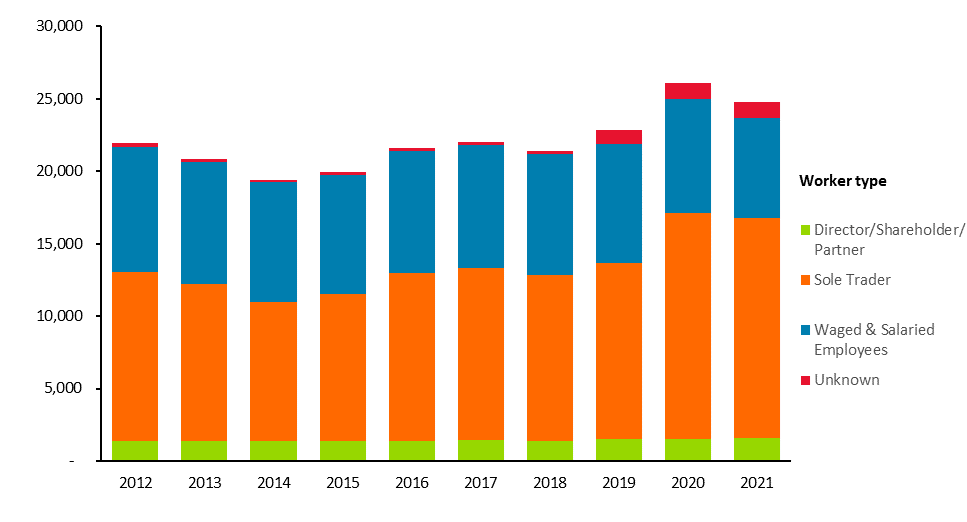
In 2021, 15,222 people worked in the screen sector as sole traders and made-up 61% of the workforce. There were also 6,855 waged and salaried employees, accounting for 28% of the workforce (Figure 5).
Employment relationships in the screen sector have continued to move away from traditional employment relationships where employees are engaged through written employment agreements and compensated through wages or salaries, towards agreements where workers are hired as contractors or sole traders. Accordingly, the share of screen sector workers earning income through wages or salaries decreased from 36.2% in 2012 to 25.6% in 2021. This transition has been notable within both the Production and Distribution sub-sectors, where between 2012 and 2021 the share of Waged and salaried employees decreased from 11% to 7% for Production, and from 82% to 68% for Distribution.
In contrast the post-production sub-sector has seen a decrease in the proportion of sole traders contracted, decreasing from 85% in 2012 to 76% in 2021. The shares of both Waged and salaried employees, and directors, shareholders, and partners increased (Figure 5).
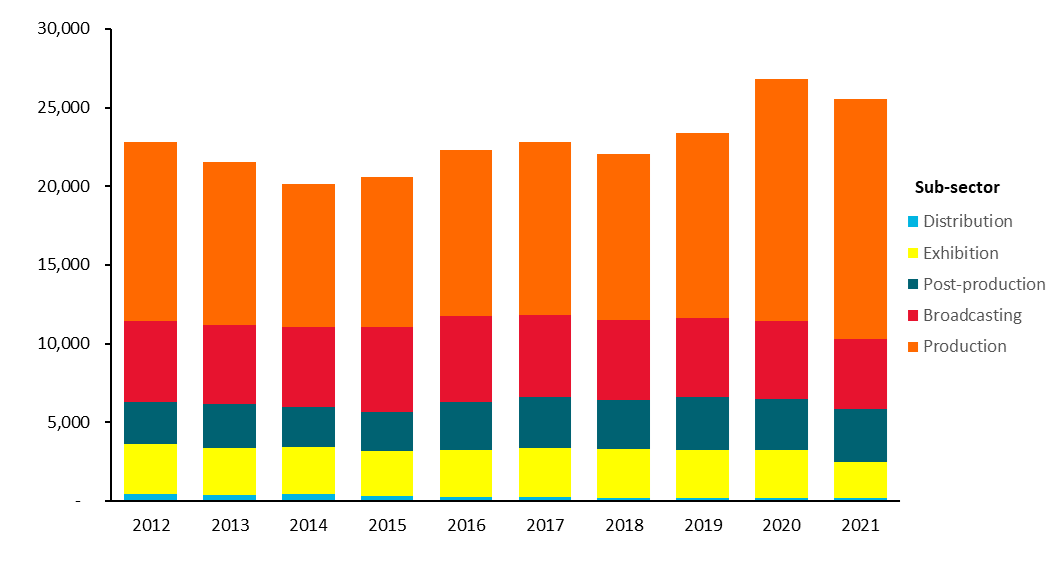
The share of screen sector workers engaged by Production firms increased from 50% of workers in 2012 to 60% in 2021 (Figure 6).
Table 4: Count of people working in the screen sector
| Year | Count of workers |
| 2012 | 21,048 |
| 2013 | 20,031 |
| 2014 | 18,699 |
| 2015 | 19,164 |
| 2016 | 20,718 |
| 2017 | 21,165 |
| 2018 | 20,661 |
| 2019 | 21,999 |
| 2020 | 25,416 |
| 2021 | 24,096 |
Figure 5: Count of people working in the screen sector broken down by year and worker type
Data table for figure 5
Figure 6: Count of people working in the screen sector broken down by sub-sector
Data table for figure 6
Earnings
The average earnings of screen sector workers has increased from $38,409 in 2012 to $46,818 in 2021, an increase of 22% (Table 5)[3].
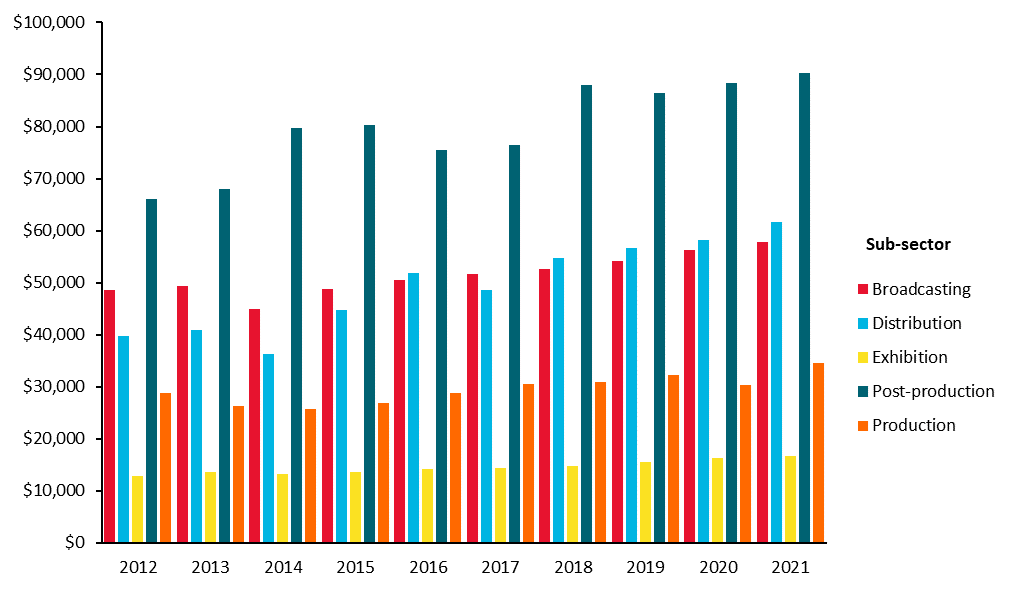
In the tax year ending March 2021, people working for firms in the Post-production sub-sector had the highest average earnings of $90,300. Workers engaged by the Exhibition and Production sub-sectors had the lowest average earnings at $16,700 and $34,600 respectively (Figure 7).
Between 2012 and 2021, screen sector workers in the Distribution sub-sector had the largest increase in average earnings from $39,600 to $61,600, up by 55%. Over the same period, average earnings in the Broadcasting sub-sector were relatively flat, increasing by 19% (Figure 7).
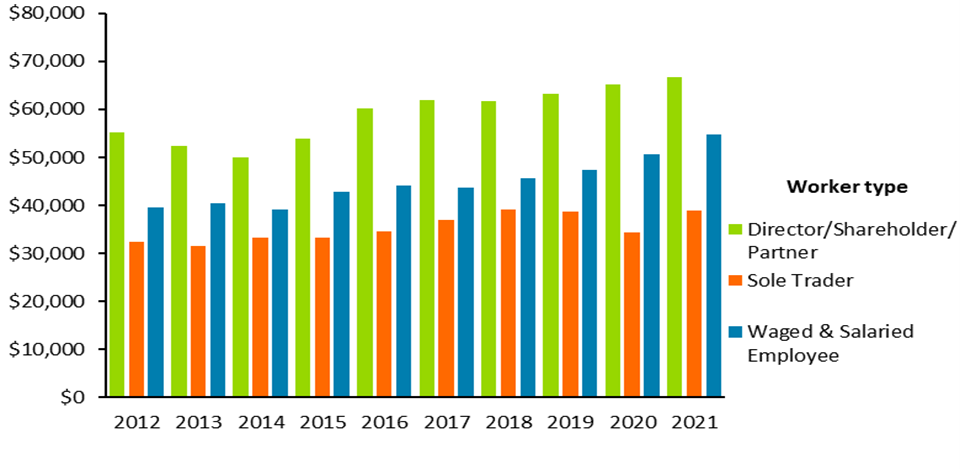
When it comes to worker types, Waged and salaried employees had the greatest increase in average earnings between 2012 and 2021 increasing from $39,500 to $54,700, or 38%. Comparatively, shareholders earnings increased by 21% and sole traders were up 19% (Figure 8).
Table 5: Average earnings of workers in the screen sector
| Year | Average earnings |
| 2012 | $38,409 |
| 2013 | $38,117 |
| 2014 | $38,506 |
| 2015 | $40,205 |
| 2016 | $41,791 |
| 2017 | $43,054 |
| 2018 | $44,681 |
| 2019 | $45,428 |
| 2020 | $42,834 |
| 2021 | $46,818 |
Figure 7: Average earnings of screen sector workers broken down by sub-sector
Data table for figure 7
Figure 8: Average earnings of screen sector workers broken down by worker type
Data table for figure 8
Notes
[1] The screen sector workforce includes any person who works in the industry at any point over the 12-month period. This means that someone who worked in the screen sector for one day will be counted, as will someone who worked in the sector for 3 months, or the full year. A person is counted only once for each year they worked in the screen sector even if they worked for multiple businesses in that year.
[2] The previous version of this report captured a monthly snapshot of people working in the screen sector as of February 2020 (13,900), for comparison the number of people working in the screen sector as at March 2021 was 13,926.
[3] This measure is only inclusive of earnings from the screen sector and includes screen sector earnings from all worker types. Average hourly wage cannot be derived from this data as it is not exclusive to full time equivalent employees.