Number and size of firms in the screen sector
On this page
As at March 2021, there were 5,166 screen sector firms in Aotearoa New Zealand[1]. Table 2 shows that the number of firms in the sector increased at about 4% annually between 2012 and 2021. This rate of increase is in line with the growth in the number of firms in the economy, with the number of live firms in Stats NZ’s Business Register also increasing at about the same rate.
For this report three categories of screen sector workers (hereafter ‘workers’) in the screen sector workforce have been defined: Directors/Shareholders/Partners, Sole traders, and Waged & Salaried employees.
- Directors/Shareholders/Partners[2] are often involved in forming and establishing a firm, owning a firm, managing a firm, and the decision making for that firm.
- Sole traders tend to have their own firm, working for themselves or work as a contractor for another person or firm.
- Waged and salaried employees are those employed by a firm as an employee while being paid a wage or a salary. They could be employed in a permanent capacity, fixed term capacity, seasonally, or casually.
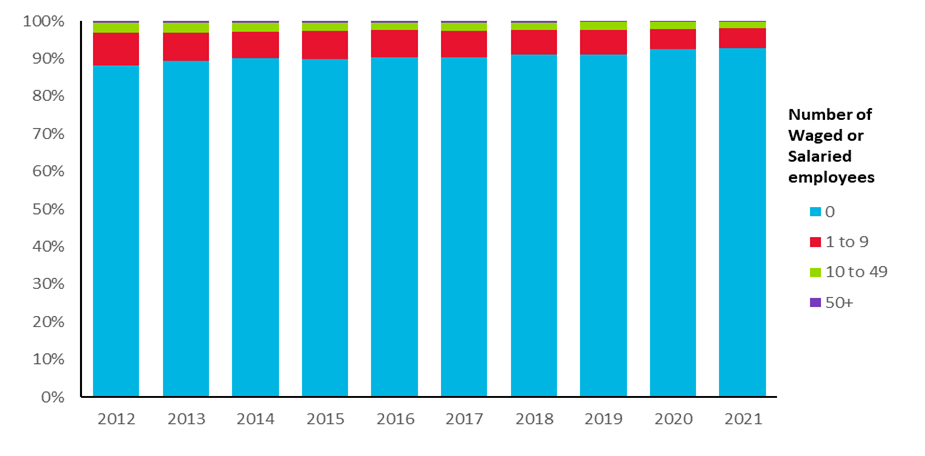
Between 2012 and 2021 growth in firm numbers was isolated to firms without Waged and salaried employees. The share of firms that don’t employ Waged and salaried employees increased from 88% of screen sector firms in 2012 to 93% in 2021 (Figure 1).
Between 2012 and 2021 these smaller firms have seen the most growth, while the numbers of people working in larger firms has
Table 2: Count of screen sector firms 2012 to 2021
| Year | Count of screen sector firms |
| 2012 | 3,600 |
| 2013 | 3,660 |
| 2014 | 3,927 |
| 2015 | 3,960 |
| 2016 | 4,299 |
| 2017 | 4,362 |
| 2018 | 4,710 |
| 2019 | 4,683 |
| 2020 | 4,923 |
| 2021 | 5,166 |
Figure 1: Share of screen sector firms employing Waged & Salaried employees by firm size
Data table for figure 1
Figure 2: Count of screen sector firms broken down by firm size (number workers)
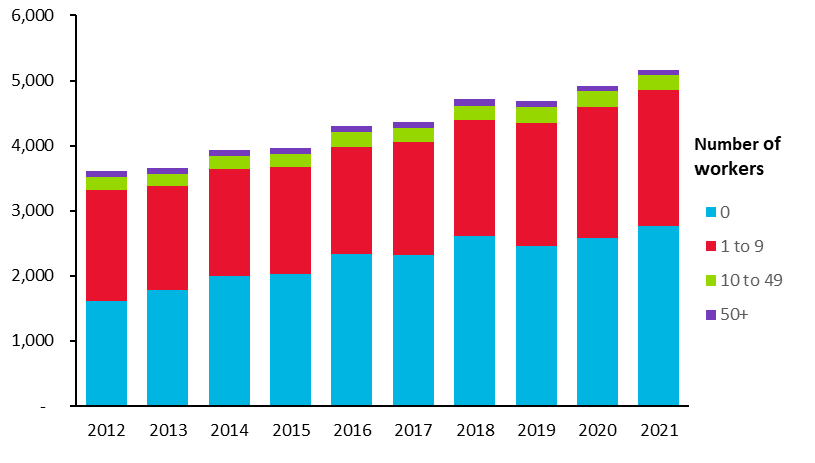
Data table for figure 2
Sub-sectors
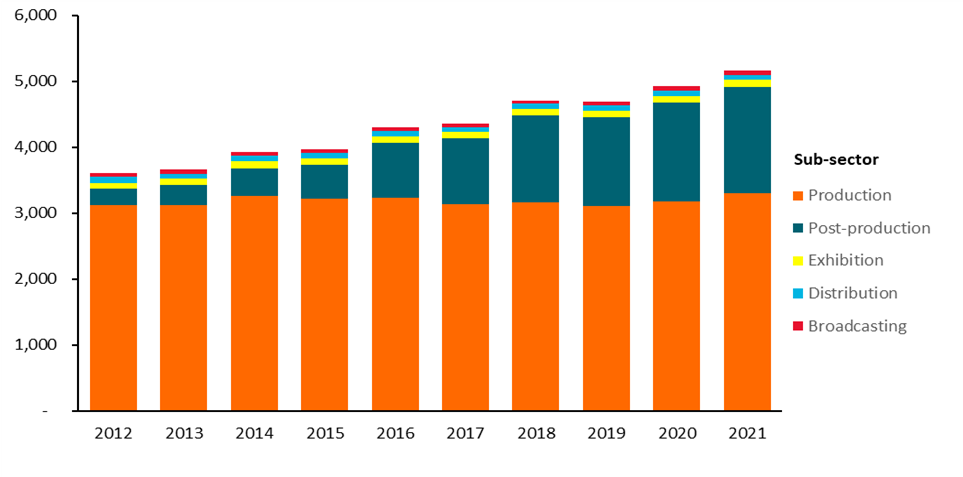
Most firms in Aotearoa New Zealand’s screen sector operate in the Production and the Post-production sub-sectors[3]. Figure 3 shows that the number of firms in the Production sub-sector has remained relatively steady between 2012 and 2021.
Figure 3: Count of screen sector firms broken down by sub-sector
Data table for figure 3
Notes
[1] The data in this report represent an analysis of the entire set of firms "live" between 2012-2021 and identifiable as belonging to the screen sector. This approach reveals a greater number of firms than would be reported through official statistics, which impose a test of economic significance for inclusion. Future reports in this series are expected to cover both the economically significant, and the totality of the sector.
[2] “Directors, Shareholders and Partners” are generic descriptions for the purposes of tax filings; they do not indicate alignment to particular roles in the screen sector such as director of a film.
[3] Note, firms with zero workers include firms that have no links to people in IRD data in the reference year but have had links (and thus workers) in previous years. Firms may no longer be active in the reference year but have not yet registered as exited, or they could be special purpose vehicles. We will look to explore this further in the next iteration of this report as the high number of firms with zero workers could be due to the nature of the screen sector.