Financial performance
On this page
Revenue
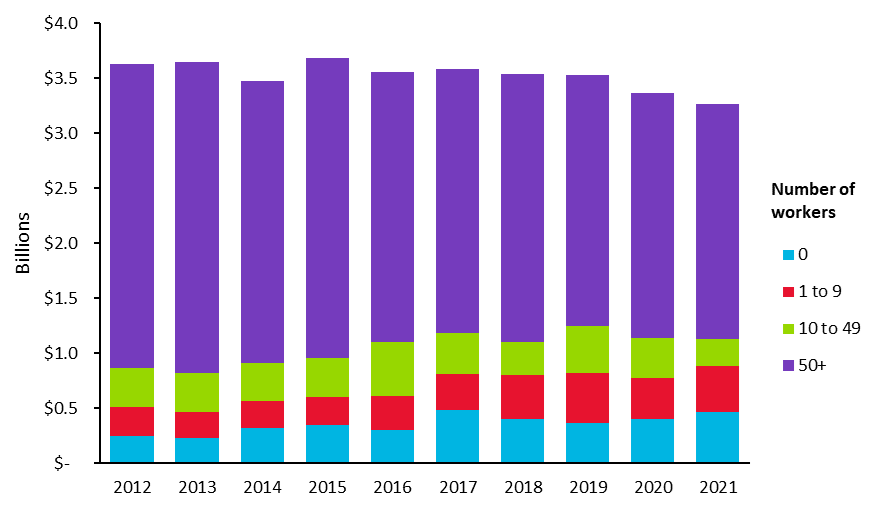
Between 2012 and 2021 total annual revenue for firms in the screen sector remained relatively stable at about $3.5 billion, with slight declines in 2020 and 2021 (Table 10).
Screen sector revenue is mostly concentrated within firms with large workforces. In the tax year ending March 2021, 66% of industry revenue (or $2.1 billion) is attributable to screen sector firms engaging 50 or more workers (Figure 16).
While screen sector firms with larger workforces are on average generating greater revenue, the average revenue of firms with smaller workforces has been increasing, while that of larger firms has been decreasing (Figure 16).
Table 10: Revenue of screen sector firms broken down by year
| Year | Screen sector revenue |
| 2012 | $3,631,000 |
| 2013 | $3,643,000 |
| 2014 | $3,470,000 |
| 2015 | $3,684,000 |
| 2016 | $3,556,000 |
| 2017 | $3,582,000 |
| 2018 | $3,537,000 |
| 2019 | $3,529,000 |
| 2020 | $3,361,000 |
| 2021 | $3,262,000 |
Figure 16: Revenue of screen sector firms broken down by year and firm size (based on number of workers)
Data table for figure 16
Table 11: Average revenue of screen sector firms broken down by firm size (based on number of all workers in the tax year ending March 2021).
| Firm size (workers) | Average firm revenue |
| 0 | $169,292 |
| 1 to 9 | $197,486 |
| 10 to 49 | $1,094,782 |
| 50+ | $24,576,931 |
Expenditure
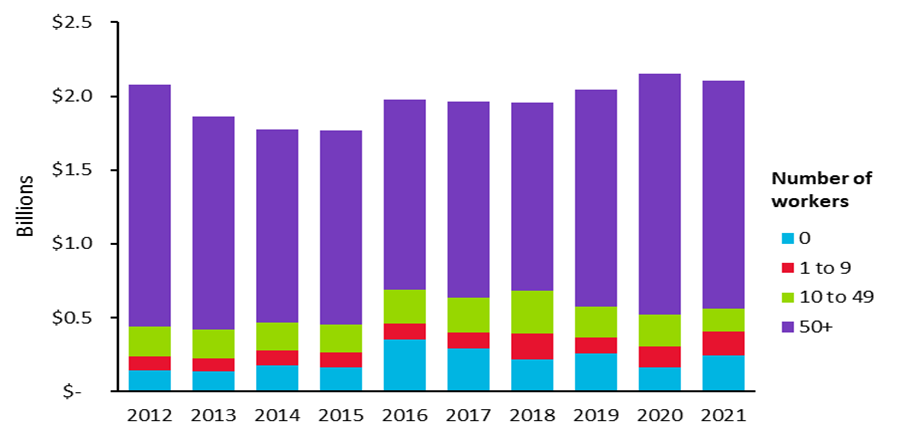
Between 2012 and 2021 total annual screen sector expenditure remained relatively stable, at around $2 billion (Table 12)[1].
In 2021, most screen sector expenditure came from the larger firms (those with 50 or more workers) and which accounted for 73% of the sectors’ total expenditure (Figure 17).
In the tax year ending March 2021, 54% of screen sector firms’ expenditure was attributable to firms operating in the Production sub-sector. This was followed by the Broadcasting sub-sector at 23%, the Post-production sub-sector at 17%, and the Exhibition and Broadcasting sub-sectors at 4% and 2% respectively.
Table 12: Expenditure of screen sector firms broken down by year
| Year | Screen sector expenditure |
| 2012 | $2,080,000 |
| 2013 | $1,859,000 |
| 2014 | $1,778,000 |
| 2015 | $1,765,000 |
| 2016 | $1,975,000 |
| 2017 | $1,962,000 |
| 2018 | $1,956,000 |
| 2019 | $2,046,000 |
| 2020 | $2,153,000 |
| 2021 | $2,102,000 |
Figure 17: Expenditure of screen sector firms broken down by year and firm size (based on number of workers)
Data table for figure 17
Regions
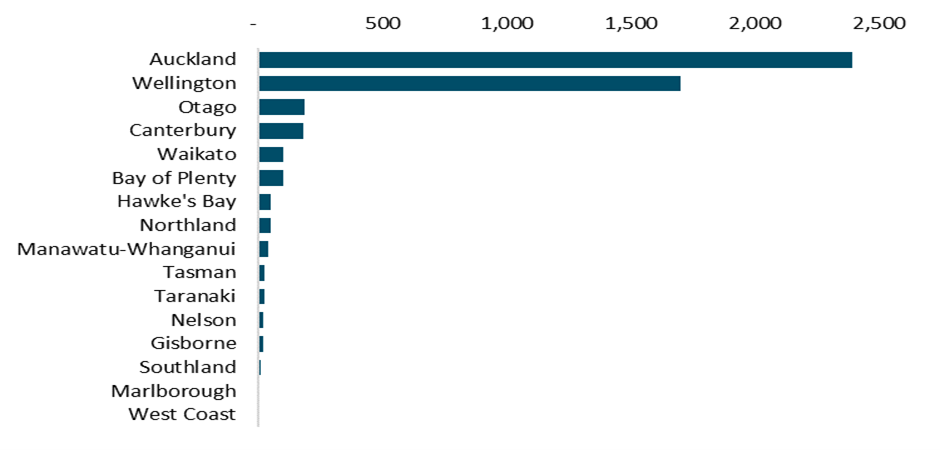
In 2021 the Auckland region was home to the largest number of screen sector firms in Aotearoa New Zealand, with 2,394 firms. This was followed by the Wellington region with 1,698 firms. Together, they comprise 83% of all screen sector firms operating in Aotearoa New Zealand, (Figure 18)[2].
In accord with regional firm counts, the Auckland region also had the highest number of people working in the screen sector in Aotearoa New Zealand with approximately 13,473 people in the year ending March 2021. This was followed by the Wellington region with approximately 4,425 people. Together, they account for 74% of the screen sector workforce.
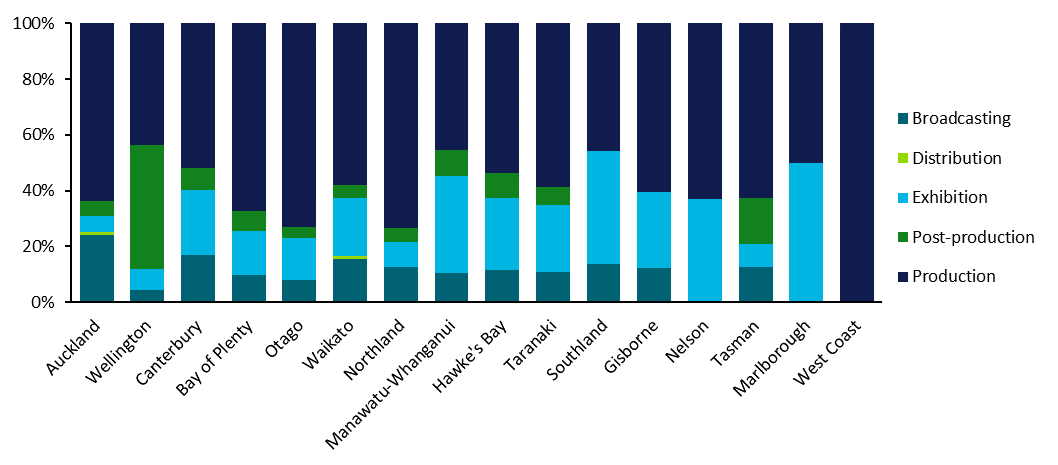
Auckland’s screen sector workforce is concentrated within firms operating within the Production sub-sector, which accounts for 64% of the region’s screen sector workforce. Wellington’s screen sector workforce is concentrated within 2 sub-sectors, with firms within the Post-production and Production sub-sectors accounting for 45% and 44% of Wellington’s screen sector workforce respectively (Figure 19).
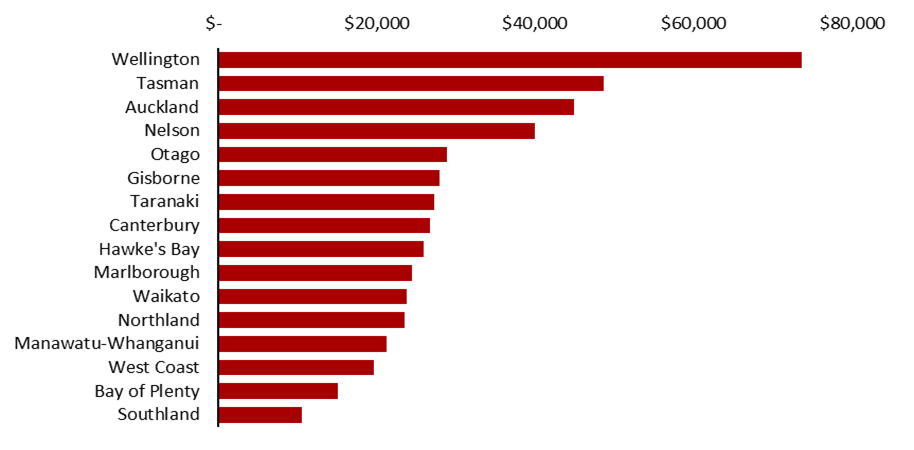
Wellington region has the highest average earnings for the screen sector workforce of $73,600 in Aotearoa New Zealand in the year ending 2021; this can mostly be explained by the high proportion of firms in the Post-production sub-sector based in Wellington. Workers in the Tasman region had the second highest average earnings of $48,600. Screen sector workers in the Auckland region earnt $44,900 on average, reflecting a broader range of sub-sectors firms and job types in Auckland (Figure 20)[3].
Revenue
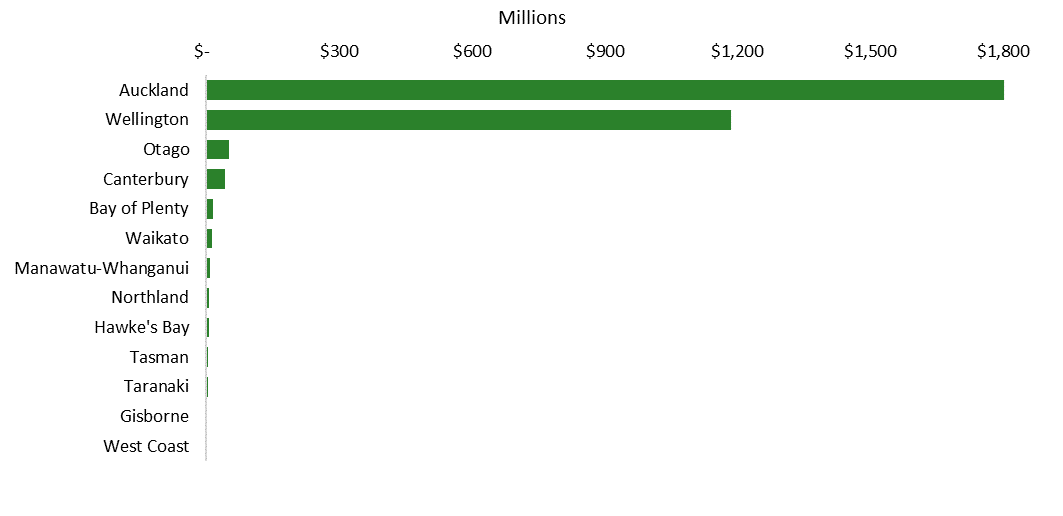
Firms within the Auckland region accounted for over half the total screen sector revenue for Aotearoa New Zealand in the tax year ending March 2021. The Auckland region generated a total revenue of $1.8 billion in 2021, 58% of the sector’s total. This was followed by the Wellington region with 37% of the total revenue at $1.2 billion (Figure 21)[4].
Screen sector firms in the Auckland region had the highest average revenue in the country at $765 thousand in the 2021 tax year. This was 10% higher than the region with the second highest average firm revenue – Wellington, which had an average revenue of $699 thousand.
Figure 18: Count of screen sector firms in the tax year ending March 2021 broken down by region
Data table for figure 18
Figure 19: Regional shares of people working in the screen sector broken down by sub-sector in the tax year ending March 2021
Data table for figure 19
Figure 20: Average earnings of people working in the screen sector broken down by regional council in the tax year ending March 2021
Data table for figure 20
Figure 21: Total revenue of screen sector firms in the tax year ending March 2021 broken down by region
Data table for figure 21
Table 13: Average revenue of screen sector firms in the tax year ending March 2021 broken down by region[5]
| Region | Average revenue |
| Northland | $136,554 |
| Auckland | $765,441 |
| Waikato | $115,692 |
| Bay of Plenty | $155,248 |
| Gisborne | $112,676 |
| Hawke's Bay | $120,490 |
| Taranaki | $134,882 |
| Manawatu-Whanganui | $198,384 |
| Wellington | $698,689 |
| Tasman | $142,178 |
| Canterbury | $228,133 |
| West Coast | $117,397 |
| Otago | $280,301 |
Notes
[1] Expenditure is the total purchases and expenses of firms (GST inclusive). This does not include expenses paid to persons not GST registered such as waged and salaried employees.
[2] Region data was not available for about 5% of firms.
[3] For the workforce, regional council is assigned based on where the worker lives rather than where the employer is located.
[4] Regional council data was not available for 2% of total sector revenue.
[5] Data for Southland, Nelson, and Marlborough has been suppressed due to low firm counts.