Current state: Gender and ethnic pay and workforce representation
On this page
To report on MBIE’s pay gap, data analysis has been completed on the following criteria:
- gender and ethnic by pay gap (based on average base salaries for permanent and fixed term employees)
- representation of the workforce and leadership by levels of seniority – employee, people leader and senior leader
- same or similar roles data was reviewed by pay band.
Data is presented when there is a minimum of 20 people in a comparison category.
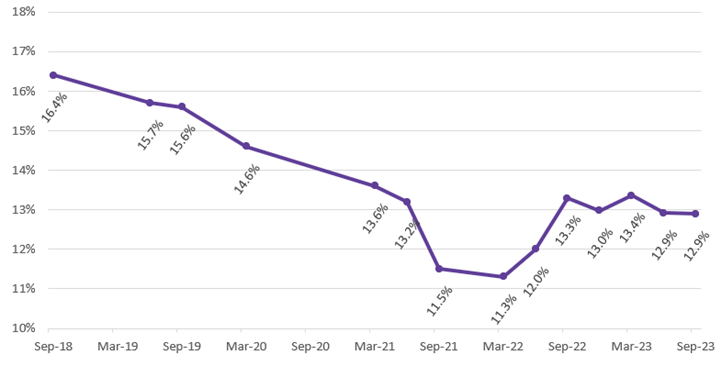
MBIE gender pay gap trend (%)
Text description of graph
MBIE’s overall gender pay gap has reduced by 7.3%, down from 20.2% in 2016 and is trending downwards. The current gender pay gap as of 30 September 2023 is 12.9%.
Gender representation by seniority (%)
Our workforce is comprised of 60.7% female, 37.7% and 1.6% another gender/not disclosed. MBIE has a higher proportion of females. Their representation is reduced as roles get more senior, whilst male representation increases. The table below shows gender representation by seniority.
| Seniority | Female | Male |
| Individual contributor | 64% | 36% |
| People Leader (Tiers 4 to 7) | 55% | 45% |
| Senior Leader (Tiers 1 to 3) | 54% | 46% |
| Total * | 62% | 38% |
* Note: This table does not include ‘Another gender/Not disclosed'. This due to the small numbers represented at each grouping.
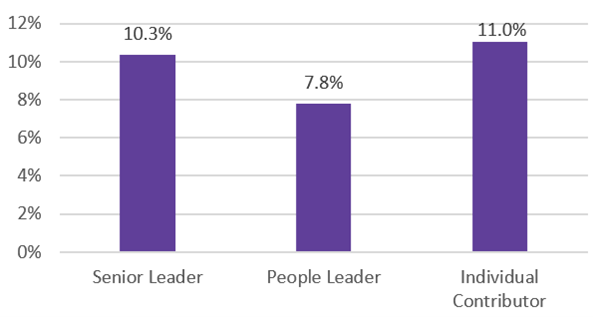
Gender pay gap (by seniority)
Text description of graph
When compared to data from September 2022, the gender pay gap for senior leaders has decreased 2.1% (from 12.4%). There has been a slight increase in the People Leader pay gap by gender (1.2% increase). There has been a 1.5% decrease for individual contributors (down from 12.5%).
To better understand gender pay gaps for same or similar roles, analysis has been completed to review workforce representation and pay gap by pay band.
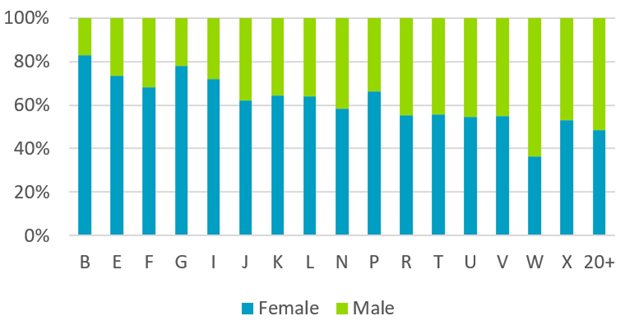
Gender representation (by pay band)
Text description of graph
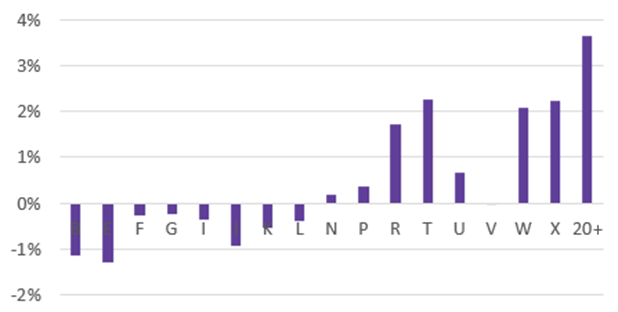
Gender pay gap (by pay band)
Text description of graph
The analysis by pay band shows gaps are comparatively low with a variance of less than 2.0% in most cases. Pay bands W and X are comprised of a small number of technical roles. The greatest pay gap by pay band is in the 20 and above (20+) group (3.7%). This group contains a wider range of roles so more variance is to be expected.
Pay increases for employees covered by the Career and Pay Progression (CAPP) framework continue to be managed through an annual step-based progression process. The progression system is based on a pay ladder that is neutral from both a gender and ethnicity perspective.
MBIE also continues to focus on reducing gender pay gaps for those in more senior positions. MBIE will complete a remuneration review of 20+ bands in the first quarter of 2024.
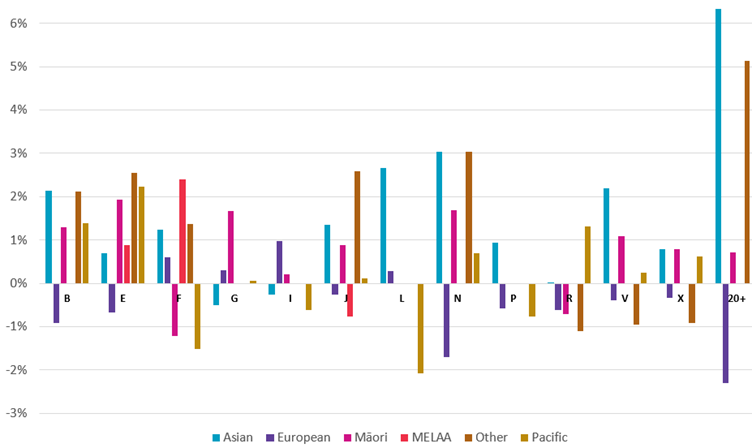
MBIE ethnic pay gap trend (%)
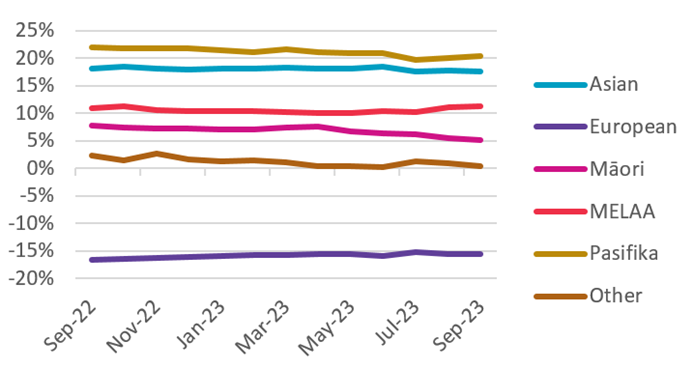
Text description of graph
The ethnic pay gap trend graph shows ‘slight’ declines in ethnic pay gaps when compared to last year. Ethnic pay gaps are calculated as per guidance by Te Kawa Mataaho (the Public Service Commission), for example comparing average pay of Māori to non-Māori.
Ethnic representation by seniority (%)
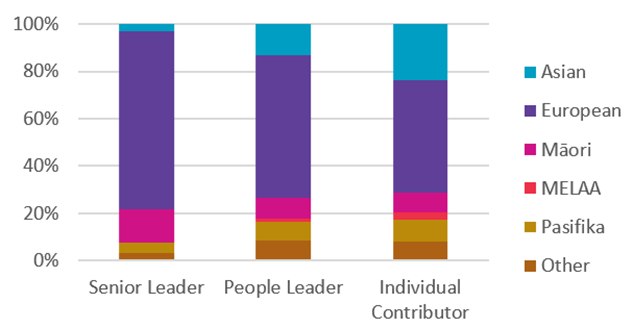
Text description of graph
European employees are progressing to higher leadership positions than our Māori, Pacific, Asian and MELAA communities.
“I [would] like to move into an Executive role but when I look [up] at managers/GMs, I don’t see how I fit in.”
Pasifika Employee Malaga Participant, 2020
MBIE will continue to focus on removing bias from the employee experience and improving leadership representation. Specific focus will be on recruiting, building pipelines of diverse talent, and providing equitable career development and progression opportunities.
Ethnic pay gap by seniority
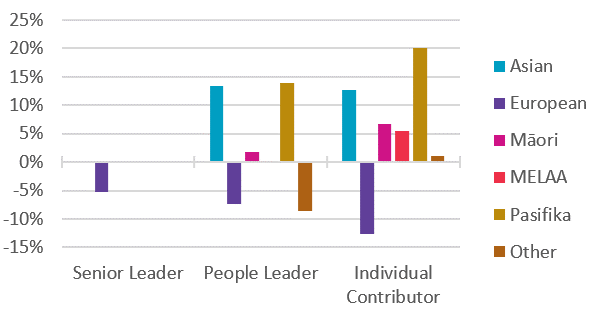
Text description of graph
Those who identify as Asian or Pacific have the largest pay gaps. This is within both people leader and individual contributor levels.
Ethnic representation (by pay band)
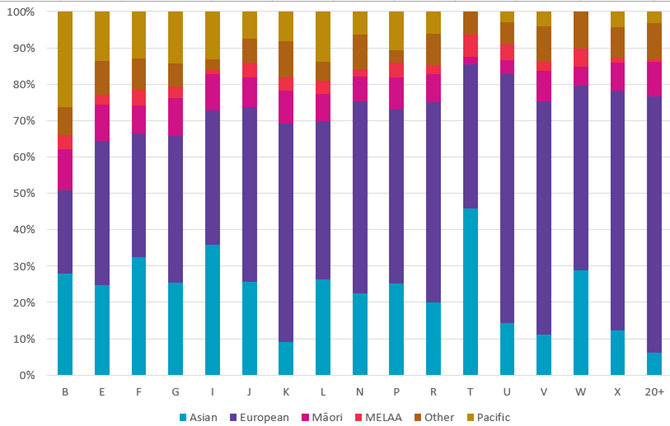
Text description of graph
When analysing representations of ethnicities across same or similar roles there is an increasing proportion of European in the higher pay bands. Inversely a higher percentage of Pacific people are in pay band B which is a lower paid role. When reviewing ethnic pay gap for same or similar roles (by pay band) the gaps are comparatively low. There is a variance of less than 3% in most cases. The greatest gap is in the 20 and above pay bands, which contain a wider range of roles.
Ethnic pay gap (by pay band)
Text description of graph
The low percentage of gender and ethnic pay gaps in same or similar roles suggest implemented initiatives have achieved the goal of reducing the prevalence of unexplained bias. There needs to be a continued focus to ensure gains continue. The intersection of gender and ethnicity needs focus and attention, actions have been identified to develop and support careers of:
- wāhine Māori
- Pacific women
- women from ethnic communities.
Average salary by gender and ethnicity (intersectionality)
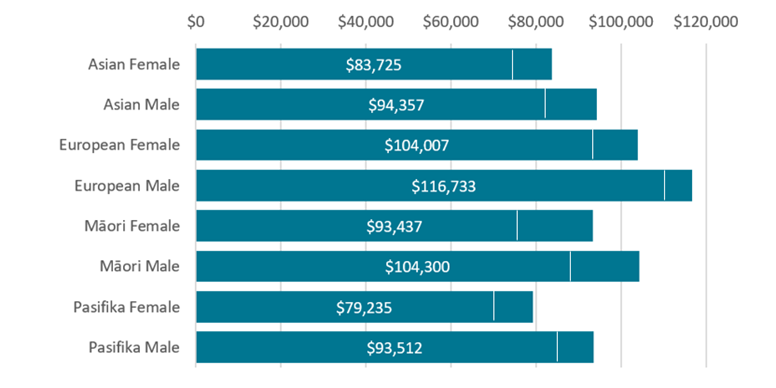
Text description of graph
The graph above displays average (mean) salary, the median salary is also indicated by the lines within each bar.
MBIE ethnic populations compared to Aotearoa
The below table compares MBIE ethnic populations with the Aotearoa New Zealand population (2018 census).
| Ethnicity | People Leaders (30 September 2023) |
Individual contributors (30 September 2023) |
Aotearoa NZ Census |
| Māori | 8.3% | 8.5% | 16.5% |
| Pacific | 7.9% | 9.6% | 8.1% |
| Asian | 13.0% | 24.3% | 15% |
| MELAA | 1.5% | 3.3% | 1.5% |
| European | 59.0% | 48.7% | 70% |
| Other ethnic group | 8.1% | 8.1% | 7.2% |
| Unknown | 12.0% | 9.9% | - |
| Total | 109.8% | 112.4% | 112.3%* |
* MBIE people can now record more than 1 ethnicity and Aotearoa NZ Census statistics includes those that identify with more than 1 ethnicity. So the total can be more than 100%.
Māori are significantly underrepresented at both people leader (8.3%) and individual contributors (8.5%). This is in comparison with the Aotearoa New Zealand population (16.5%). MBIE has improved representation in senior leadership.
Pacific employee numbers decrease as the seniority of positions increase. Representation is comparative to Aotearoa New Zealand population (8.1%). People leader 7.9% and individual contributor 9.6%.
Asian numbers decrease as seniority increases. While 24.3% of individual contributors are Asian, this decreases to 13% for Asian people leaders.
MELAA make up 3.3% of individual contributors and 1.5% of people leaders. This is a slight decrease from September 2022 but in line with the national population (1.5%).
European/Pakeha is the only ethnic group that has a higher percentage of people in people leader positions (59.0%) than individual contributors positions (49.7%).
MBIE still has over 10% of people where there is no ethnicity recorded. Analysis shows our employees of longer tenure have a higher rate of no ethnicity being recorded. Those with a tenure of less than 2 years have a rate of 95.7% ethnicities recorded. This timing reflects the implementation of the SAP HRIS and the ability to record more than 1 ethnicity. It remains a priority to run a campaign for employees to update their ethnicity and iwi in the HRIS system.